. 2023 Aug 31;14(4):e0104623.
doi: 10.1128/mbio.01046-23. Epub 2023 Jun 30.

Optimized quantification of intra-host viral diversity in SARS-CoV-2 and influenza virus sequence data

Affiliations

Optimized quantification of intra-host viral diversity in SARS-CoV-2 and influenza virus sequence data

A E Roder et al. mBio. .

Abstract

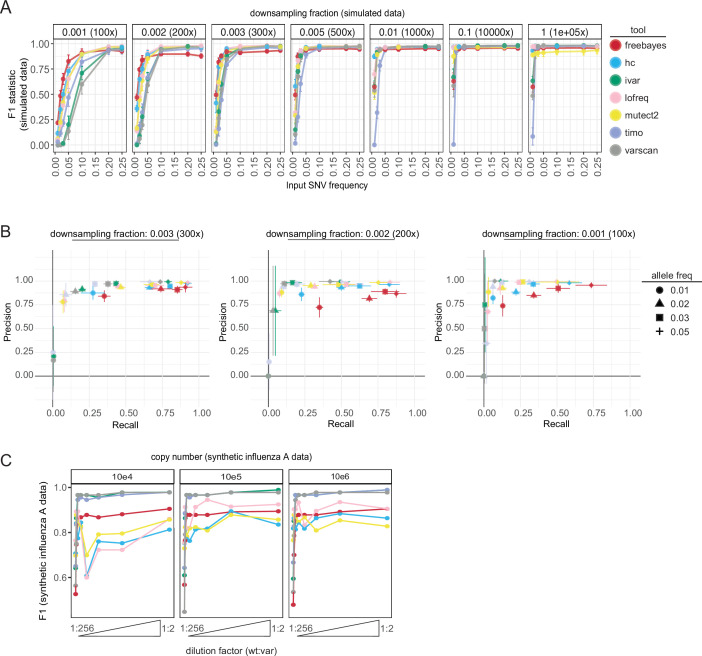
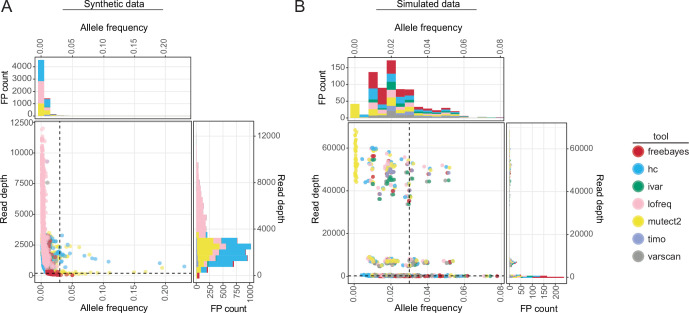
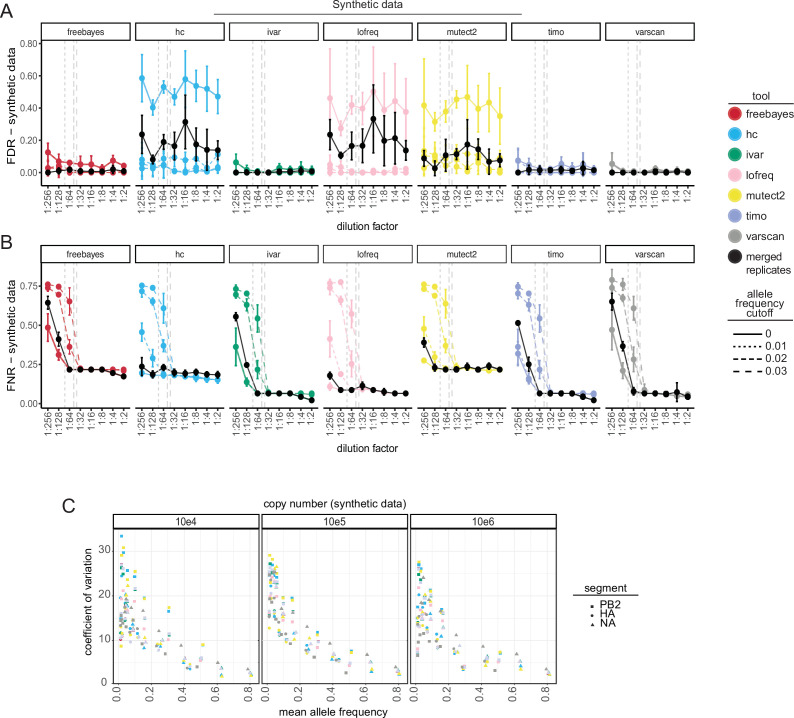
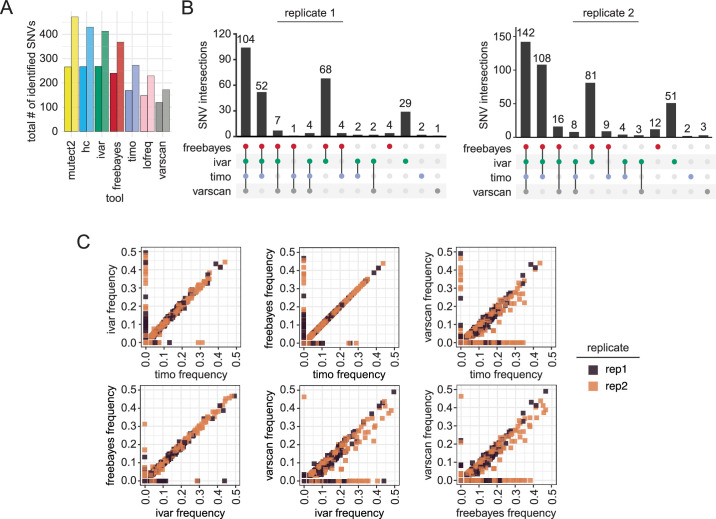
High error rates of viral RNA-dependent RNA polymerases lead to diverse intra-host viral populations during infection. Errors made during replication that are not strongly deleterious to the virus can lead to the generation of minority variants. However, accurate detection of minority variants in viral sequence data is complicated by errors introduced during sample preparation and data analysis. We used synthetic RNA controls and simulated data to test seven variant-calling tools across a range of allele frequencies and simulated coverages. We show that choice of variant caller and use of replicate sequencing have the most significant impact on single-nucleotide variant (SNV) discovery and demonstrate how both allele frequency and coverage thresholds impact both false discovery and false-negative rates. When replicates are not available, using a combination of multiple callers with more stringent cutoffs is recommended. We use these parameters to find minority variants in sequencing data from SARS-CoV-2 clinical specimens and provide guidance for studies of intra-host viral diversity using either single replicate data or data from technical replicates. Our study provides a framework for rigorous assessment of technical factors that impact SNV identification in viral samples and establishes heuristics that will inform and improve future studies of intra-host variation, viral diversity, and viral evolution. IMPORTANCE When viruses replicate inside a host cell, the virus replication machinery makes mistakes. Over time, these mistakes create mutations that result in a diverse population of viruses inside the host. Mutations that are neither lethal to the virus nor strongly beneficial can lead to minority variants that are minor members of the virus population. However, preparing samples for sequencing can also introduce errors that resemble minority variants, resulting in the inclusion of false-positive data if not filtered correctly. In this study, we aimed to determine the best methods for identification and quantification of these minority variants by testing the performance of seven commonly used variant-calling tools. We used simulated and synthetic data to test their performance against a true set of variants and then used these studies to inform variant identification in data from SARS-CoV-2 clinical specimens. Together, analyses of our data provide extensive guidance for future studies of viral diversity and evolution.

Keywords: SARS-CoV-2; bioinformatics; genomics; influenza.


Conflict of interest statement

The authors declare no conflict of interest.

Figures

Fig 1
Fig 1
Variant caller performance on simulated and synthetic data. (A) F1 statistic for each variant caller on simulated data across a range of downsampling fractions (y-axis: 0.001–1, expected read depth: 100×–100,000×) and allele frequency values (x-axis: 0.01–0.25 or 1%–25%). Values shown are mean and standard deviation of the four viruses (A/H1N1, A/H3N2, B/Victoria, and SARS-CoV-2) using standard input parameters (Table S1). Color represents the variant caller used. (B) Precision (y-axis) and recall (x-axis) graphs of each variant caller across allele frequencies 1%–5% (point shape) for downsampling fractions 0.003 (~300× read depth, left), 0.002 (~200×, middle), and 0.001 (~100×, right). Color represents variant caller. Mean and standard deviation are shown across the four viruses for precision and recall scores. (C) F1 statistic (y-axis) for each variant caller using standard inputs on synthetic influenza A virus data across a range of copy numbers (104–106) and dilutions (wt:var—1:256, 1:128, 1:64, 1:32, 1:16, 1:8, 1:4, 1:2). Data are grouped across the PB2, HA, and NA segments to calculate F1. Color represents the variant caller used.
Fig 2
Fig 2
The output frequency and coverage of false-positive variants in synthetic and simulated data. (A and B) Scatter plots and associated histograms showing the number of false-positive SNVs identified at different output allele frequencies and total read depths for all callers and copy numbers (103–106) in the synthetic influenza A virus samples (A) or across all callers, viruses, and downsampling fractions in simulated data (B). Dotted lines are drawn at allele frequency = 0.03 and read depth = 200×. Color represents the variant caller used.
Fig 3
Fig 3
Effect of frequency cutoffs and sequencing replicates on variant detection and quantification in synthetic influenza A virus data. (A) False discovery rate (FDR) ( FPFP+TP ) and (B) false negative rate (FNR) ( FNFN+TP ) of synthetic influenza A virus data as a function of dilution factor using either single replicate data (colored points and lines) with applied frequency cutoffs (line type) or merged two replicate data without cutoffs (solid black points and lines). Variants below the applied frequency cutoff are filtered out and considered false negatives. Dashed vertical lines indicate the location of allele frequency cutoffs relative to the dilution factors. Values shown are the mean and standard deviation across all sequenced copy numbers (103–106). FP: false positive, TP: true positive, FN: false negative. (C) Coefficient of variation (y-axis, standarddeviationmean×100 ) of synthetic influenza A virus data across a range of copy numbers (104–106) vs the mean allele frequency (x-axis) within a segment and dilution factor. Only true-positive variants found across all variant callers were considered in this analysis. Color represents the variant caller used. Point shape indicates the synthetic gene segment.
Fig 4
Fig 4
Effect of variant caller on identification and allele frequency estimation of SNVs in SARS-CoV-2 data from clinical samples. (A) Bar plot showing raw number of minor variants identified by each variant caller in replicate 1 (left bar) or replicate 2 (right bar) using a 3% allele frequency cutoff. (B) UpSetR plot showing agreement of minority variants in each replicate across Freebayes, iVar, timo, and Varscan using an allele frequency cutoff of 0.03 (3%) and coverage cutoff of 200×. Vertical bars indicate the size of the shared set of variants, while dots and connecting lines show which callers share a given set of identified variants. (C) Scatter plot showing the output frequency of minority variants identified by two different variant callers. Color represents replicate. Variants with frequency of 0 were not identified by that variant caller.
Fig 5
Fig 5
Reproducibility of minority variants across sequencing replicates. (A) Bar plot showing number of reproducible minor variants across sequencing replicates by each variant caller using a 1% allele frequency cutoff. Percentages shown are the percentage of total individual variants that were reproducible. Background bars indicate the total number of variants found by each tool in each replicate (left: replicate 1, right: replicate 2). Data are sorted by percentage of shared SNVs. (B) UpSetR plot showing overlap of reproducible variants across Freebayes, iVar, timo, and Varscan, using a frequency cutoff of 0.01 (1%) and coverage cutoff of 200×. Vertical bars indicate the size of the shared set of variants, while dots and connecting lines show which callers share a given set of reproducible variants. (C) Scatter plot showing frequency of variants across sequencing replicates with frequency in replicate 1 on the x-axis and frequency in replicate 2 on the y-axis. Color represents reproducibility of each variant across variant callers and replicates. Inset highlights variants found at allele frequencies ≤0.10 (10%) in both replicates. The dotted line represents the x = y-axis and indicates perfect agreement between replicates. (D, E) Line graph showing the number of “true-positive” and “false-positive” variants in single replicate data across allele frequency cutoffs for all tools (D) or just iVar and timo (E). A true positive (TP) variant is defined as an SNV found by the selected callers in both replicates [80 variants shown in (B)], and a false positive (FP) is defined as any other variant found in an individual replicate by the selected callers. Color represents sequencing replicate.

Update of

References

    1. Arnold JJ, Cameron CE. 2004. Poliovirus RNA-dependent RNA polymerase (3Dpol): pre-steady-state kinetic analysis of ribonucleotide incorporation in the presence of Mg2+. Biochemistry 43:5126–5137. doi:10.1021/bi035212y - DOI - PMC - PubMed
    1. Sanjuán R. 2012. From molecular genetics to phylodynamics: evolutionary relevance of mutation rates across viruses. PLoS Pathog 8:e1002685. doi:10.1371/journal.ppat.1002685 - DOI - PMC - PubMed
    1. Duffy S, Shackelton LA, Holmes EC. 2008. Rates of evolutionary change in viruses: patterns and determinants. Nat Rev Genet 9:267–276. doi:10.1038/nrg2323 - DOI - PubMed
    1. Peck KM, Lauring AS. 2018. Complexities of viral mutation rates. J Virol 92:e01031-17. doi:10.1128/JVI.01031-17 - DOI - PMC - PubMed
    1. Domingo E. 2002. Quasispecies theory in virology. J Virol 76:463–465. doi:10.1128/JVI.76.1.463-465.2002 - DOI - PMC - PubMed

Publication types