The cross-correlation-based analysis to digest the conformational dynamics of the mitoBK channels in terms of their modulation by flavonoids
- PMID: 37389670
- PMCID: PMC10618312
- DOI: 10.1007/s00249-023-01666-9
The cross-correlation-based analysis to digest the conformational dynamics of the mitoBK channels in terms of their modulation by flavonoids
Abstract
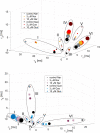
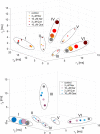
The activity of mitochondrial large-conductance voltage- and [Formula: see text]-activated [Formula: see text] channels (mitoBK) is regulated by a number of biochemical factors, including flavonoids. In particular, naringenin (Nar) and quercetin (Que) reached reasonable scientific attention due to their well-pronounced channel-activating effects. The open-reinforcing outcomes of Nar and Que on the mitoBK channel gating have been already reported. Nevertheless, the molecular picture of the corresponding channel-ligand interactions remains still to be revealed. In this work, we investigate the effects of the Nar and Que on the conformational dynamics of the mitoBK channel. In this aim, the cross-correlation-based analysis of the single-channel signals recorded by the patch-clamp method is performed. The obtained results in the form of phase space diagrams enable us to visually monitor the effects exerted by the considered flavonoids at the level of temporal characteristics of repetitive sequences of channel conformations. It turns out that the mitoBK channel activation by naringenin and quercetin does not lead to the change in the number of clusters within the phase space diagrams, which can be related to the constant number of available channel macroconformations regardless of the flavonoid administration. The localization and occupancy of the clusters of cross-correlated sequences suggest that mitoBK channel stimulation by flavonoids affects the relative stability of channel conformations and the kinetics of switching between them. For most clusters, greater net effects are observed in terms of quercetin administration in comparison with naringenin. It indicates stronger channel interaction with Que than Nar.
Keywords: Channel gating dynamics; Conformational dynamics; Cross-correlations; Dwell-time series; Flavonoids; MitoBK channels.
© 2023. The Author(s).
Conflict of interest statement
All the authors declare no conflicts of interests.
Figures


Similar articles
-
To what extent naringenin binding and membrane depolarization shape mitoBK channel gating-A machine learning approach.PLoS Comput Biol. 2022 Jul 20;18(7):e1010315. doi: 10.1371/journal.pcbi.1010315. eCollection 2022 Jul. PLoS Comput Biol. 2022. PMID: 35857767 Free PMC article.
-
Dynamical diversity of mitochondrial BK channels located in different cell types.Biosystems. 2021 Jan;199:104310. doi: 10.1016/j.biosystems.2020.104310. Epub 2020 Nov 25. Biosystems. 2021. PMID: 33248202
-
Application of Machine-Learning Methods to Recognize mitoBK Channels from Different Cell Types Based on the Experimental Patch-Clamp Results.Int J Mol Sci. 2021 Jan 15;22(2):840. doi: 10.3390/ijms22020840. Int J Mol Sci. 2021. PMID: 33467711 Free PMC article.
-
Potassium channels in brain mitochondria.Acta Biochim Pol. 2009;56(3):385-92. Epub 2009 Sep 17. Acta Biochim Pol. 2009. PMID: 19759922 Review.
-
BK in Double-Membrane Organelles: A Biophysical, Pharmacological, and Functional Survey.Front Physiol. 2021 Oct 26;12:761474. doi: 10.3389/fphys.2021.761474. eCollection 2021. Front Physiol. 2021. PMID: 34764886 Free PMC article. Review.
Cited by
-
Special Issue: 18th Congress of the Polish Biophysical Society.Eur Biophys J. 2023 Oct;52(6-7):483-486. doi: 10.1007/s00249-023-01688-3. Eur Biophys J. 2023. PMID: 37882816
References
-
- Bednarczyk P, Koziel A, Jarmuszkiewicz W, et al (2013) Large-conductance ca2+-activated potassium channel in mitochondria of endothelial ea. hy926 cells. Am J Physiol Heart Circ 304(11). 10.1152/ajpheart.00976.2012 - PubMed
MeSH terms
Substances
Grants and funding
LinkOut - more resources
Full Text Sources

