. 2023 Jun 30;19(6):e1010823.
doi: 10.1371/journal.pgen.1010823. eCollection 2023 Jun.

Relaxing parametric assumptions for non-linear Mendelian randomization using a doubly-ranked stratification method

Affiliations

Relaxing parametric assumptions for non-linear Mendelian randomization using a doubly-ranked stratification method

Haodong Tian et al. PLoS Genet. .

Abstract

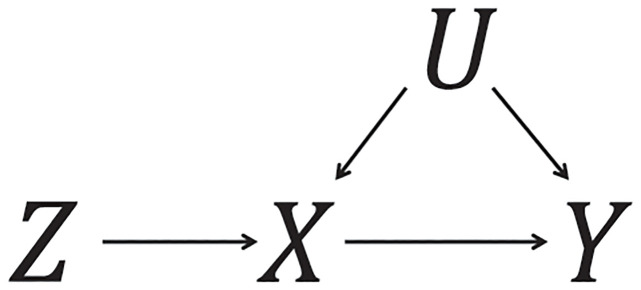
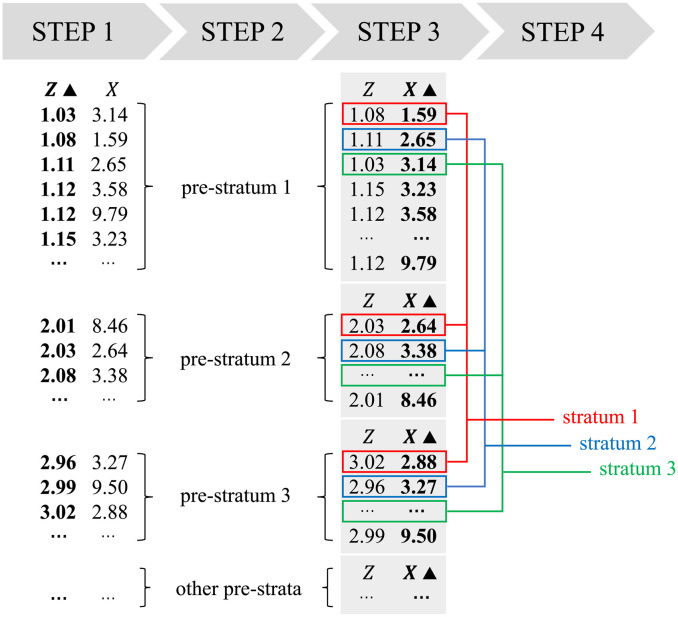
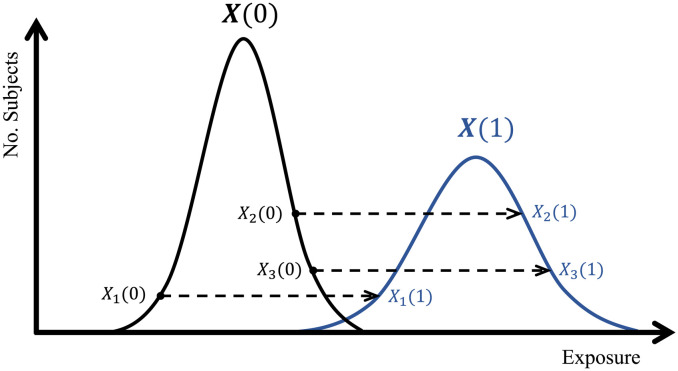
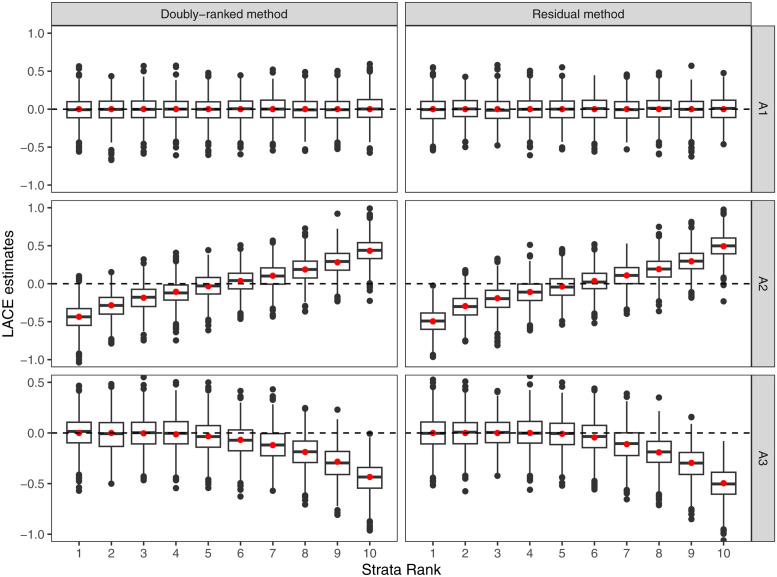
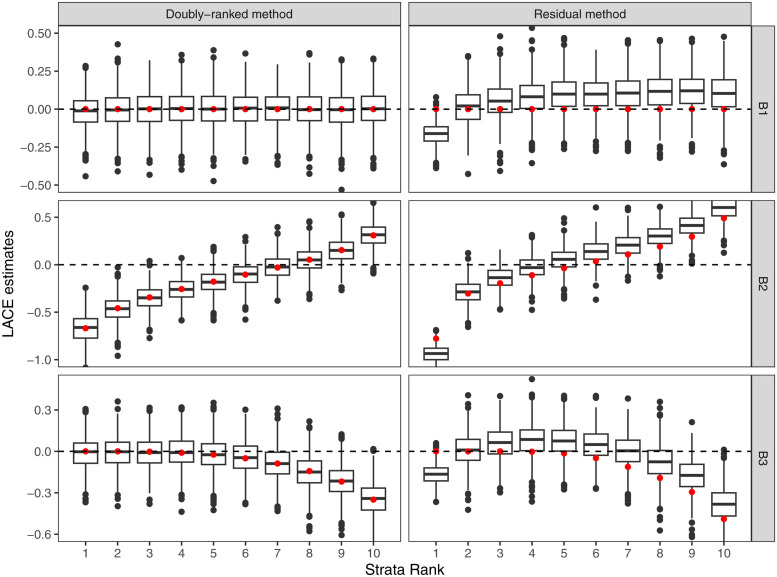
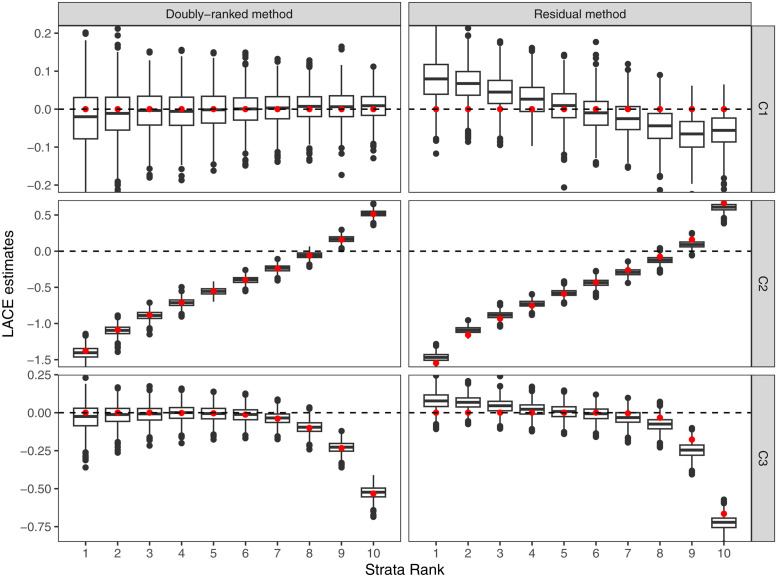
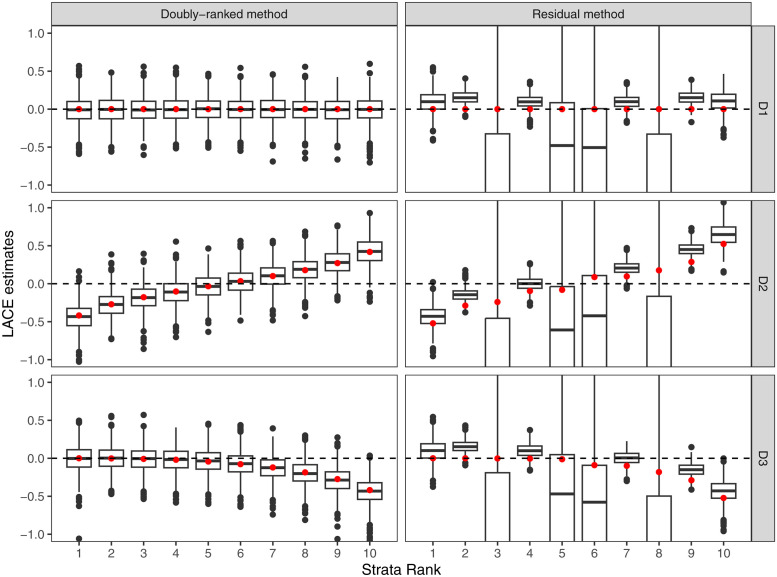
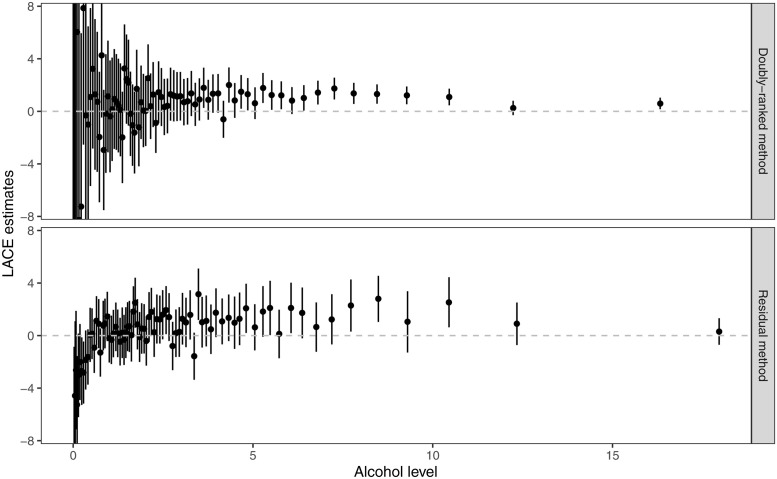
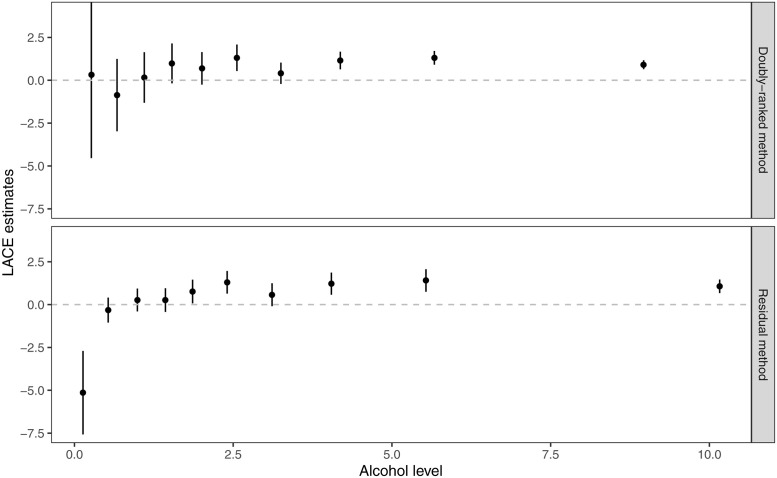
Non-linear Mendelian randomization is an extension to standard Mendelian randomization to explore the shape of the causal relationship between an exposure and outcome using an instrumental variable. A stratification approach to non-linear Mendelian randomization divides the population into strata and calculates separate instrumental variable estimates in each stratum. However, the standard implementation of stratification, referred to as the residual method, relies on strong parametric assumptions of linearity and homogeneity between the instrument and the exposure to form the strata. If these stratification assumptions are violated, the instrumental variable assumptions may be violated in the strata even if they are satisfied in the population, resulting in misleading estimates. We propose a new stratification method, referred to as the doubly-ranked method, that does not require strict parametric assumptions to create strata with different average levels of the exposure such that the instrumental variable assumptions are satisfied within the strata. Our simulation study indicates that the doubly-ranked method can obtain unbiased stratum-specific estimates and appropriate coverage rates even when the effect of the instrument on the exposure is non-linear or heterogeneous. Moreover, it can also provide unbiased estimates when the exposure is coarsened (that is, rounded, binned into categories, or truncated), a scenario that is common in applied practice and leads to substantial bias in the residual method. We applied the proposed doubly-ranked method to investigate the effect of alcohol intake on systolic blood pressure, and found evidence of a positive effect of alcohol intake, particularly at higher levels of alcohol consumption.


Conflict of interest statement

The authors declare no potential conflict of interests.

Figures

Fig 1
Fig 1. Directed acyclic graph (DAG) illustrating the instrumental variable assumptions.
The exposure is denoted as X, the genetic instrument as Z, the outcome as Y, and exposure–outcome confounders as U. The exposure X is a collider in this DAG, as it is a common effect of the instrument and confounders.
Fig 2
Fig 2. Schematic diagram illustrating the doubly-ranked stratification method.
The stratification can be achieved in four steps accordingly. Step 1: sort the population according to the instrument Z; Step 2: build pre-strata according to the sorted Z values; Step 3: sort within each pre-stratum according to the exposure X; Step 4: select the first individuals from each pre-stratum into stratum 1, the second individuals in each pre-stratum into stratum 2, and so on.
Fig 3
Fig 3. Diagram illustrating the rank preserving assumption for a dichotomous instrumental variable Z ∈ {0, 1} with counterfactual exposure distributions X(0) (the black group) and X(1) (the blue group).
The dashed arrow represents the one-to-one mapping from the counterfactual exposure value with Z = 0 to the counterfactual covariate value with Z = 1.
Fig 4
Fig 4. Results of the doubly-ranked method and residual method for model A (linearity and homogeneity) with three different causal relationship between the exposure and the outcome (denoted by A1, A2, A3).
Boxplot results represent the LACE estimates within the 10 strata. Red points represent the target causal effects within strata. Box indicates lower quartile, median, and upper quartile; error bars represent the minimal and maximal data point falling in the 1.5 interquartile range distance from the lower/upper quartile; estimates outside this range are plotted separately.
Fig 5
Fig 5. Results of the doubly-ranked method and residual method for model B (nonlinearity and homogeneity) with three different causal relationship between the exposure and the outcome (denoted by B1, B2, B3).
Boxplot results represent the LACE estimates within the 10 strata. Red points represent the target causal effects within strata. Box indicates lower quartile, median, and upper quartile; error bars represent the minimal and maximal data point falling in the 1.5 interquartile range distance from the lower/upper quartile; estimates outside this range are plotted separately.
Fig 6
Fig 6. Results of the doubly-ranked method and residual method for model C (linearity and heterogeneity) with three different causal relationship between the exposure and the outcome (denoted by C1, C2, C3).
Boxplot results represent the LACE estimates within the 10 strata. Red points represent the target causal effects within strata. Box indicates lower quartile, median, and upper quartile; error bars represent the minimal and maximal data point falling in the 1.5 interquartile range distance from the lower/upper quartile; estimates outside this range are plotted separately.
Fig 7
Fig 7. Results of the doubly-ranked method and residual method for model D (coarsened exposures) with three different causal relationship between the exposure and the outcome (denoted by D1, D2, D3).
Boxplot results represent the LACE estimates within the 10 strata. Red points represent the target causal effects within strata. Box indicates lower quartile, median, and upper quartile; error bars represent the minimal and maximal data point falling in the 1.5 interquartile range distance from the lower/upper quartile; estimates outside this range are plotted separately.
Fig 8
Fig 8. LACE estimates of alcohol intake on SBP from the two stratification methods (residual method and doubly-ranked method) against average levels of alcohol intake in the 77 strata.
The error bars represent the 95% confidence interval for each stratum-specific estimate.
Fig 9
Fig 9. LACE estimates of alcohol intake on SBP from the two stratification methods (residual method and doubly-ranked method) against average levels of alcohol intake in the 10 strata.
The error bars represent the 95% confidence interval for each stratum-specific estimate.

References

    1. Davey Smith G, Ebrahim S. ‘Mendelian randomization’: can genetic epidemiology contribute to understanding environmental determinants of disease?. Int J Epidemiol. 2003;32(1):1–22. doi: 10.1093/ije/dym289 - DOI - PubMed
    1. Burgess S, Thompson SG. Mendelian randomization: methods for causal inference using genetic variants. 2rd ed. Chapman &Hall, Boca Raton, FL. 2021.
    1. Burgess S, Davies NM, Thompson SG, EPIC-InterAct Consortium. Instrumental variable analysis with a nonlinear exposure–outcome relationship. Epidemiology 2014;25(6):877–885. doi: 10.1097/EDE.0000000000000161 - DOI - PMC - PubMed
    1. Staley JR, Burgess S. Semiparametric methods for estimation of a nonlinear exposure-outcome relationship using instrumental variables with application to Mendelian randomization. Genet Epidemiol 2017;41(4):341–352. doi: 10.1002/gepi.22041 - DOI - PMC - PubMed
    1. Amemiya T. The nonlinear two-stage least-squares estimator. J Econom 1974;2(2):105–110. doi: 10.1016/0304-4076(74)90033-5 - DOI

Publication types