. 2023 Jun 30;9(26):eade6308.
doi: 10.1126/sciadv.ade6308. Epub 2023 Jun 30.

N-acetylneuraminate pyruvate lyase controls sialylation of muscle glycoproteins essential for muscle regeneration and function

Affiliations

N-acetylneuraminate pyruvate lyase controls sialylation of muscle glycoproteins essential for muscle regeneration and function

Afitz Da Silva et al. Sci Adv. .

Abstract

Deleterious variants in N-acetylneuraminate pyruvate lyase (NPL) cause skeletal myopathy and cardiac edema in humans and zebrafish, but its physiological role remains unknown. We report generation of mouse models of the disease: NplR63C, carrying the human p.Arg63Cys variant, and Npldel116 with a 116-bp exonic deletion. In both strains, NPL deficiency causes drastic increase in free sialic acid levels, reduction of skeletal muscle force and endurance, slower healing and smaller size of newly formed myofibers after cardiotoxin-induced muscle injury, increased glycolysis, partially impaired mitochondrial function, and aberrant sialylation of dystroglycan and mitochondrial LRP130 protein. NPL-catalyzed degradation of sialic acid in the muscle increases after fasting and injury and in human patient and mouse models with genetic muscle dystrophy, demonstrating that NPL is essential for muscle function and regeneration and serves as a general marker of muscle damage. Oral administration of N-acetylmannosamine rescues skeletal myopathy, as well as mitochondrial and structural abnormalities in NplR63C mice, suggesting a potential treatment for human patients.


Figures

Fig. 1.
Fig. 1.. Homozygous NplR63C and Npldel116 mice show NPL deficiency in tissues and massive urinary excretion of free Sia.
(A) NPL activity in homogenates of skeletal muscles, visceral organs, and brain of NplR63C, Npldel116, and WT mice. (B) Relative Npl mRNA levels in kidney of NplR63C, Npldel116, and WT mice. Four mice (two males/two females) were analyzed for each group. Statistical analyses were performed using a one-way analysis of variance (ANOVA) with Tukey post hoc test. (C) Western blot of mouse kidney tissues showing an absence of 36-kDa NPL cross-reacting protein band in both NplR63C and Npldel116 mice. A lysate of HEK cells transfected with a plasmid expressing WT human FLAG-(DYKDDDDK)–tagged NPL [molecular weight (MW), 37 kDa] was used as a positive control. Bottom panel shows a loading control, β-actin. (D) Total free Sia concentration in the urine of WT, NPLR63C, and NPLdel116 mice. Four mice (two males/two females) were analyzed for each group. Statistical analyses were performed using a one-way ANOVA with Tukey post hoc test.
Fig. 2.
Fig. 2.. Homozygous NplR63C and Npldel116 mice display a muscle weakness.
(A) Hindlimb suspension test with WT (n = 9, 5 males and 4 females), NplR63C (n = 7, 4 males and 3 females), and Npldel116 (n = 10, 5 males and 5 females) 10-day-old mice. (B) Front limb suspension test with WT (n = 13, 8 males/5 females), NplR63C (n = 13, 7 males/6 females), and Npldel116 (n = 10, 5 males and 5 females) 6-week-old mice. (C) Grip strength test with WT (n = 7, 4 males and 3 females), NplR63C (n = 7, 4 males and 3 females), and Npldel116 (n = 7, 3 males/4 females) 10-week-old mice. All statistical analyses were performed using a one-way ANOVA test with Tukey post hoc test. Isometric contractile properties of EDL muscles shown as specific force (D) and maximum force (E) in 2-month-old WT, Npldel116, and NplR63C mice. Data are presented as means ± SEM of n = 6 (3 males and 3 females) mice for each group. Statistical analysis was performed using a two-way ANOVA test with a Bonferroni post hoc test, ***P < 0.001, ****P < 0.0001. ns, not significant. (F) Ex vivo isometric fatigue characteristics of EDL muscle from WT, Npldel116, and NplR63C mice. Bar graph shows percent of initial force produced after 60 contractions. (G) Mass of quadriceps, triceps, gastrocnemius, and tibialis anterior muscles is normal in 2-month-old WT, NplR63C, and Npldel116 mice (n = 6, 3 males and 3 females for each genotype). (H) Npldel116 and NplR63C mice show normal body mass gain (n = 4 per sex per genotype). (I) Distribution of myofiber diameters in 2-month-old WT, NplR63C, and Npldel116 mice. Diameters of myofibers were quantified by morphometric analysis of quadriceps sections, labeled for laminin (red), from WT, Npldel116, and NplR63C mice using ImageJ; n = 3 per sex per genotype. Scale bar, 150 μm. Statistical analyses were performed using two-way ANOVA test with a Bonferroni post hoc test, ****P < 0.0001.
Fig. 3.
Fig. 3.. NplR63C mice show slower healing and produce myofibers with smaller diameter after cardiotoxin-induced muscle injury.
(A) Histological changes in tibialis anterior muscle on the 14th and 21st days of regeneration after intramuscular cardiotoxin injection. Panels show representative mouse muscle cross sections after hematoxylin and eosin (H&E) staining. Scale bar, 150 μm. Three WT and three NplR63C mice (two males, one female) were analyzed. (B) Representative tibialis anterior sections from injured WT and NplR63C mice 21 days after injury, labeled with 4′,6-diamidino-2-phenylindole (DAPI, blue) and anti-laminin antibody (green). Scale bar, 150 μm. (C) Distribution of myofiber diameters in injured WT and NplR63C mice 21 days after injury. Diameters of myofibers were quantified by morphometric analysis of tibialis anterior sections from three WT and three NplR63C mice (two males/one female) using ImageJ software. Statistical analyses were performed using two-way ANOVA test; **P < 0.01, ***P < 0.001, and ****P < 0.0001. (D) Representative tibialis anterior sections from three WT and three NplR63C mice (two males/one female) 14 days after injury labeled with DAPI (blue) and anti-myogenin antibody (green). Scale bar, 50 μm. (E) Density of myogenin+ cells/mm2 in three WT and three NplR63C mice (two males/one female). Quantifications were performed using three sections per mouse. Statistical analysis was performed using Student’s t test, P < 0.0001.
Fig. 4.
Fig. 4.. ManNAc treatment rescues muscle weakness and accelerates muscle injury healing in NPL-deficient Npldel116 mice.
(A) Latency to fall in hindlimb suspension test performed on 10-day-old untreated NplR63C mice (n = 10, 5 males/5 females) and those receiving ManNAc (n = 11, 6 males/5 females). Statistical analysis was performed using ANOVA test with a Tukey post hoc test. (B) Latency to fall in front limb suspension test performed on 6-week-old untreated (n = 10, 5 males/5 females) and ManNAc-treated (n = 11, 6 males/5 females) NplR63C mice during the treatment and 24 hours after discontinuation of the treatment. Statistical analysis was performed using ANOVA test with a Tukey post hoc test. (C) Grip strength in 10-week-old WT (n = 10, 5 males/5 females), untreated NplR63C (n = 11, 5 males/6 females), and ManNAc-treated NplR63C mice (n = 8, 4 males/4 females). Data are presented as the mean force normalized to body mass. Statistical analysis was performed using ANOVA test with a Tukey post hoc test. Isometric contractile properties of EDL muscles shown as maximum force (D) and specific force (E) in 2-month-old WT, NplR63C, and NplR63C mice treated with ManNAc. Data are presented as means ± SEM (n = 5, 3 males/2 females per group). Statistical analyses were performed using a two-way ANOVA test with a Bonferroni post hoc test; ***P < 0.001 and ****P < 0.0001. Transmission electronic images with magnification ×4800 (F), ×9300 (G), and ×13,000 (H) of tibialis anterior muscle longitudinal sections from WT, NplR63C, Npldel116, and ManNAc-treated NplR63C mice. Red arrowheads show irregularly shaped myotubes and yellow arrowheads show dysmorphic mitochondria in muscles of NPL-deficient mice. Panels show representative results from four mice (two males/two females) per group.
Fig. 5.
Fig. 5.. ManNAc rescues deficits in muscle regeneration in NplR63C mice.
(A) Histological changes in tibialis anterior muscle on the 14th and 21st days of regeneration after intramuscular cardiotoxin injection. Panels show representative muscle cross sections after H&E staining. Scale bar, 150 μm. Three WT, three NplR63C, and three ManNAc-treated NplR63C mice (two males/one female) were analyzed for each group. (B) Representative tibialis anterior sections from mice on the 21st day after injury stained with DAPI (blue) and anti-laminin antibody (green). Scale bar, 150 μm. (C) Distribution of myofiber diameters in mice 21 days after injury. Diameters of myofibers were quantified by morphometric analysis of tibialis anterior sections using ImageJ software. Three mice (two males/one female) were studied for each group. Statistical analyses were performed using two-way ANOVA with a Bonferroni post hoc test; *P < 0.05, **P < 0.01, ***P < 0.001, and ****P < 0.0001. (D) Delayed fusion of myoblasts and maturation of myotubes from NplR63C and NplR63C mice are rescued by ManNAc. Panels show representative micrographs of myogenic cells from WT, NplR63C, and Npldel116 mice, cultured in the absence or presence of 800 μM ManNAc, on the 5th day of differentiation into myotubes. Cells were labeled with DAPI (blue) and MF20 antibody (myosin heavy chain, green). Graphs show the number of nuclei per myotube and the diameter of myosin-positive myotubes quantified with ImageJ software. Scale bars, 20 μm. Data are presented as means ± SEM (three independent cultures were established per condition; 20 to 30 cells were analyzed for each culture). Statistical analyses were performed using a one-way ANOVA test with a Tukey post hoc test.
Fig. 6.
Fig. 6.. Metabolites of Sia synthesis pathway are elevated in NPL-deficient mice.
Levels of Neu5Ac (A), Neu5Gc (B), and Sia-nucleotides, CMP-Neu5Ac (C) and CMP-Neu5Gc (D), were measured in muscle tissues of WT, Npldel116, NplR63C, and ManNAc-treated NplR63C mice. Levels of total Sia (E), Neu5Ac (F), and Neu5Gc (G) were measured in urine of WT, Npldel116, NplR63C, and ManNAc-treated NplR63C mice. Graphs show individual values, means, and SD for the experiments performed with five to seven mice per group. Statistical analyses were performed using a one-way ANOVA test with a Tukey post hoc test.
Fig. 7.
Fig. 7.. Abnormal protein glycosylation in NplR63C mice.
(A) MALDI-TOF profiles (mass-range between m/z 1100 and 4100) of permethylated N-glycans from muscle tissue glycoproteins representative for WT, NplR63C, and ManNAc-treated NplR63C mice samples. Species were detected as [M+Na]+ molecular ions (monoisotopic masses). (B) Comparison of the relative peak areas (shown as means ± SEM and normalized to the total areas of the 42 individual species reported in table S1) of different N-glycan populations from mouse muscle tissue glycoproteins in WT and NPL-mutant mice. Statistical analyses were performed using a one-way ANOVA test with a Tukey post hoc test; *P < 0.05, **P < 0.01, and ***P < 0.001. (C) MALDI-TOF/TOF analysis of the hypersialylated biantennary species at m/z 3243.59 that significantly accumulate in NplR63C samples and decrease after ManNAc treatment. The overall fragmentation pattern denotes the occurrence of two distinct isomers differing in the position of the extra Neu5Gc at the disialo-antenna. In all panels, graphical representation of glycans is based on the third edition of Essentials of Glycobiology (59): GlcNAc, blue square; Man, green circle; Gal, yellow circle; Neu5Ac, purple diamond; Neu5Gc, light blue diamond; Fuc, red triangle; % I, percentage of intensity
Fig. 8.
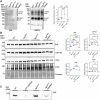
Fig. 8.. Increased sialylation of α-DG and mitochondrial LRP130 in the muscle tissues of NplR63C mice is restored by ManNAc treatment.
(A) α-DG from muscle extracts of WT, Npldel116, NplR63C, and ManNAc-treated NplR63C mice was purified by immunoprecipitation and analyzed by blotting with anti–α-DG antibody, clone IIH6C4 (right) and SNL (left). Graph shows combined intensities (individual values, means, and SD) of α-DG bands, labeled with SNL, and normalized by combined intensities of α-DG bands, labeled with IIH6C4 antibodies. Equal protein loading was verified by Ponceau staining. Four mice per group were analyzed. (B) Proteins in the mitochondria homogenates, purified from muscles of WT, NplR63C, NplR63C, and ManNAc-treated Npldel116 mice, were analyzed by blotting with SNL lectin, anti-LRP130 antibodies, PNA lectin, and ConA lectin. Graphs show intensities (individual values, means, and SD) of protein bands, labeled with lectins or antibodies, and normalized by total protein abundance measured by Ponceau staining. Three mice per group were analyzed. (C) Mitochondrial protein homogenates from WT and Npldel116 mice, treated or not, by bacterial pan-specific sialidase were analyzed by SNL lectin. Treatment drastically reduced the affinity of LRP130 protein band to SNL. All statistical analyses were performed using a one-way ANOVA test with a Tukey post hoc test.
Fig. 9.
Fig. 9.. Mitochondrial abnormalities in the muscles and myoblasts of NPL-deficient mice.
Increased lactate (A) and pyruvate (B) in quadriceps of WT, NplR63C, and Npldel116 but not of ManNAc-treated NplR63C mice. N = 4 (2 males/2 females per group). (C) Immunoblot (left) shows increased COX4 protein in quadriceps muscles of WT, NplR63C, and Npldel116 but not of ManNAc-treated NplR63C mice. Quantification of COX4 band intensities (right) normalized by total protein. Individual values, means, and SD of experiments with three mice per group are shown. Statistical analyses were performed using a one-way ANOVA test with a Tukey post hoc test. (D) Immunoblot (left) shows similar levels of COX4 in purified mitochondria from muscles of WT, NplR63C, and Npldel116 mice. Quantification of COX4 band intensities (right) normalized by total protein abundance. Individual values, means, and SD of experiments with three mice per group are shown. (E) Increased abundance of mitochondria in myotubes of NPL-deficient mice. Fluorescent microscopy images (left) of primary myoblast-derived myotubes of WT, NplR63C-, Npldel116-, and NplR63C-treated mice on day 3 of differentiation, labeled with DAPI and MitoTracker. Scale bars, 20 μm. Quantification of MitoTracker fluorescence (right) performed with ImageJ. Individual data, means, and SD of the experiments with cells from six cultures per group. Reduced oxygen consumption rate (F) and ATP-linked respiration (G) in cultured primary myoblasts of NplR63C and Npldel116 mice are detected using the XFe-24 Extracellular Flux Analyzer. Graphs show means and SD of three experiments performed with individual cell cultures from three mice per group. Statistical analyses were performed using ANOVA test with a Tukey post hoc test (A) to (E) and two-way ANOVA test with Bonferroni post hoc test (F), ***P < 0.0001 (WT versus NPL-deficient mice).
Fig. 10.
Fig. 10.. Starvation, muscle injury, and muscle dystrophy induce NPL-catalyzed Sia cleavage.
(A) Fasting reduces latency to fall for NplR63C but not for WT mice in accelerated rotarod test. N = 16 (8 males/8 females) mice per group. (B) Neu5Ac and (C) Neu5Gc are increased in the urine of fasted NplR63C but not fasted WT mice. N = 7 (4 males/3 females) per group. (D and E) Neu5Gc in the quadriceps muscle of NplR63C mice, but not of WT mice, is increased by fasting. (F and G) Fasting increases levels of CMP-Neu5Gc, but not of CMP-Neu5Ac, in the quadriceps muscle of NplR63C mice. N = 7 (4 males/3 females) mice per group. (H and I) Fasting increases NPL and NEU2 activities in quadriceps muscles from WT. N = 6 (3 males/3 females) mice per group. (J and K) NPL and NEU2 activities are increased in homogenates of tibialis anterior muscle 10 days after injection of cardiotoxin. N = 4 (2 males/2 females) mice per group. (L and M) NPL and NEU2 activities are increased in homogenates of tibialis anterior muscle tissues from Duchenne’s muscular dystrophy, mdx, and a myotonic dystrophy type 1, DMXL, mouse models compared with their respective WT controls. N = 5 (2 males/3 females) mice per group for mdx mice and their controls, and 3 males for DMXL mice and their controls. (N) NPL activity shows a trend toward an increase, and NEU2 activity is increased in homogenates of quadriceps muscle biopsies of a patient affected with BMD compared with age-/sex-matched nonmyopathic control. Individual results, means, and SD of technical replicas are shown. Statistical analysis was performed using a two-way ANOVA with a Bonferonni post hoc test (A), one-way ANOVA with a Tukey post hoc test (B) to (H) and (K), and t test (H) to (J) and (L) to (N).

References

    1. A. Varki, Sialic acids in human health and disease. Trends Mol. Med. 14, 351–360 (2008). - PMC - PubMed
    1. S. J. Moons, G. J. Adema, M. T. Derks, T. J. Boltje, C. Büll, Sialic acid glycoengineering using N-acetylmannosamine and sialic acid analogs. Glycobiology 29, 433–445 (2019). - PubMed
    1. H. H. Freeze, G. W. Hart, R. L. Schnaar, Glycosylation precursors, in Essentials of Glycobiology, A. Varki, R. D. Cummings, J. D. Esko, P. Stanley, G. W. Hart, M. Aebi, A. G. Darvill, T. Kinoshita, N. H. Packer, J. H. Prestegard, R. L. Schnaar, P. H. Seeberger, Eds. (Cold Spring Harbor Laboratory Press, 2015), pp. 51–63.
    1. A. Varki, R. L. Schnaar, R. Schauer, Sialic acids and other nonulosonic acids, in Essentials of Glycobiology, A. Varki, R. D. Cummings, J. D. Esko, P. Stanley, G. W. Hart, M. Aebi, A. G. Darvill, T. Kinoshita, N. H. Packer, J. H. Prestegard, R. L. Schnaar, P. H. Seeberger, Eds. (Cold Spring Harbor Laboratory Press, 2015), pp. 179–195. - PubMed
    1. O. Pogoryelova, J. A. González Coraspe, N. Nikolenko, H. Lochmüller, A. Roos, GNE myopathy: From clinics and genetics to pathology and research strategies. Orphanet J. Rare Dis. 13, 70 (2018). - PMC - PubMed