. 2023 Nov 9;142(19):1633-1646.
doi: 10.1182/blood.2023019758.

Resolving therapy resistance mechanisms in multiple myeloma by multiomics subclone analysis

Affiliations

Resolving therapy resistance mechanisms in multiple myeloma by multiomics subclone analysis

Alexandra M Poos et al. Blood. .

Abstract

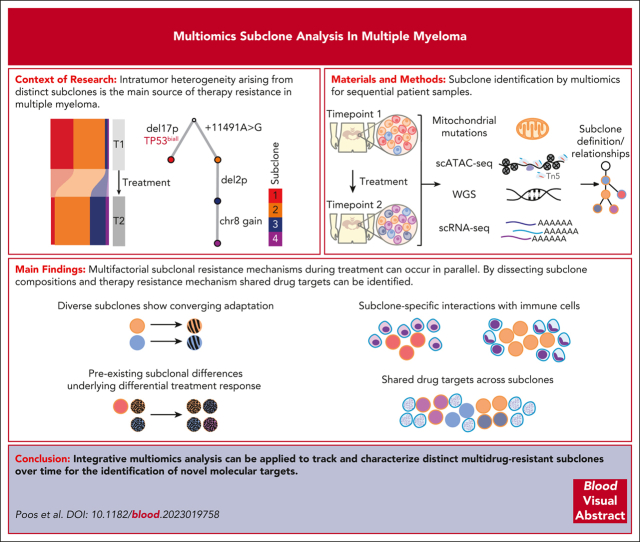
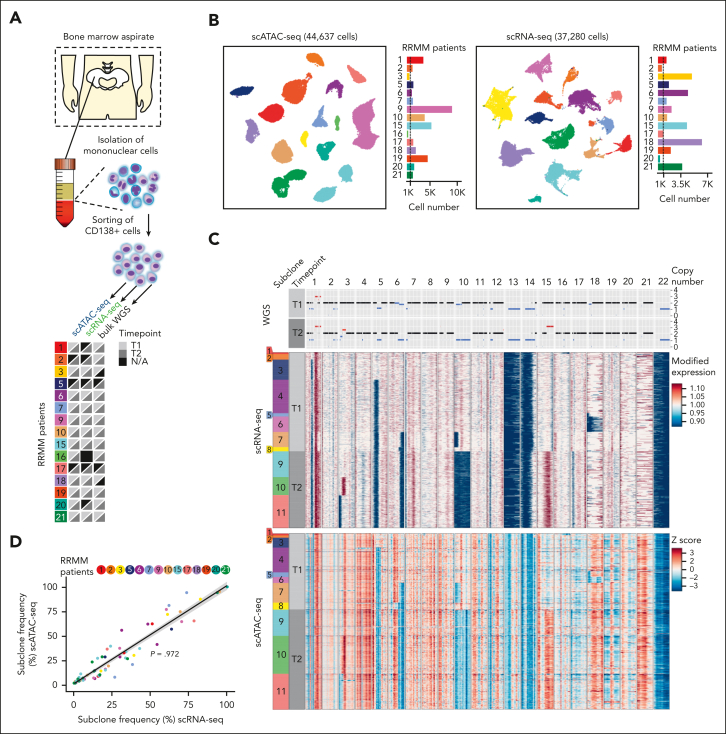
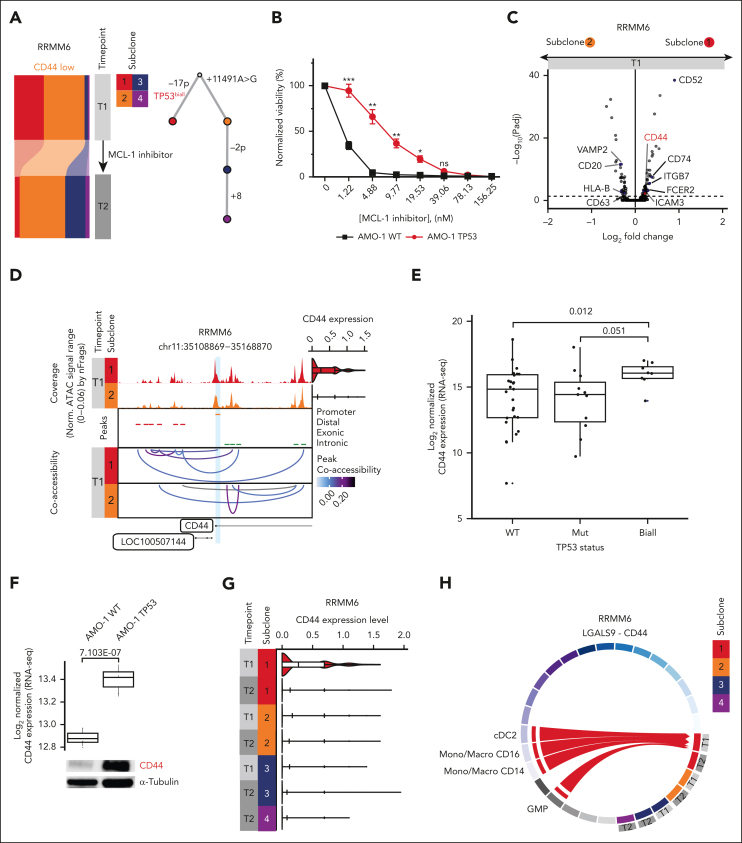
Intratumor heterogeneity as a clinical challenge becomes most evident after several treatment lines, when multidrug-resistant subclones accumulate. To address this challenge, the characterization of resistance mechanisms at the subclonal level is key to identify common vulnerabilities. In this study, we integrate whole-genome sequencing, single-cell (sc) transcriptomics (scRNA sequencing), and chromatin accessibility (scATAC sequencing) together with mitochondrial DNA mutations to define subclonal architecture and evolution for longitudinal samples from 15 patients with relapsed or refractory multiple myeloma. We assess transcriptomic and epigenomic changes to resolve the multifactorial nature of therapy resistance and relate it to the parallel occurrence of different mechanisms: (1) preexisting epigenetic profiles of subclones associated with survival advantages, (2) converging phenotypic adaptation of genetically distinct subclones, and (3) subclone-specific interactions of myeloma and bone marrow microenvironment cells. Our study showcases how an integrative multiomics analysis can be applied to track and characterize distinct multidrug-resistant subclones over time for the identification of molecular targets against them.


Conflict of interest statement

Conflict-of-interest disclosure: The authors declare no competing financial interests.

Figures

None
Graphical abstract
Figure 1.
Figure 1.
A WGS-guided sc multiomic analysis integrates transcriptome and epigenome profiles of subclones. (A) Experimental overview of the patient cohort and available sequencing data. N/A indicates sample not available or sequencing yield <200 cells after quality control (QC). (B) UMAP embedding showing (left) scATAC- and (right) scRNA-seq data after QC, based on latent sematic indexing. Individual malignant PCs are colored according to patient identity. The bar plot on the right shows the number of cells per patient after QC. (C) Representative copy number profiles for the 22 autosomal chromosomes from (top) WGS, (middle) scRNA-, and (bottom) scATAC-seq of patient RRMM15. The color bar on the left indicates the respective subclonal population and sampling time point before relapse treatment (T1) and at subsequent relapse (T2). (Top) Copy number profile highlighting copy number gains (red), loss of heterozygosity (gray), and copy number losses (blue). Black represents a diploid copy number status. (Middle) Heatmap showing modified gene expression values generated using inferCNV. Gains (red) and losses (blue) are highlighted. The scales were limited to 0.9 and 1.1. (Bottom) Heatmap for z-scores from scATAC-seq, using the identical color code as shown for WGS and scRNA-seq. Z-scores were limited to 3 and –3. (D) Pearson correlation between the subclone frequency identified via scRNA- (x-axis) and scATAC-seq (y-axis) for all analyzed patients with both modalities. Each time point was plotted separately, with each subclone being colored based on the patient. Linear regression line is depicted in black, in which the gray area marks the 95% confidence interval. The deviation between the subclone frequency between scRNA-seq and scATAC-seq was from 0% to 23.9% (mean deviation = 5.08%).
Figure 2.
Figure 2.
Mitochondrial mutations further delineate the subclonal structure. (A) Mitochondrial DNA (mtDNA) mutations detected in scATAC-seq data across patients. Only mtDNA mutations with a mean heteroplasmy >1% in at least one of the paired samples were considered. The color bar at the top indicates the respective patient and sampling time point before treatment (T1) and at relapse (T2). (B) Inferred phylogenetic clonal tree for patient RRMM15. Top node denotes the common ancestor, from which subclones are derived according to their respective CNA and mtDNA mutation changes detected via WGS, scRNA-seq, and scATAC-seq. (Bottom) scATAC-seq heatmap of 1912 differential accessibility peaks and 3034 differential gene scores across subclones for patient RRMM15. Color indicates the column Z score of normalized peak accessibility and gene scores, respectively. (C) Heatmap of mtDNA mutations inferred from scATAC-seq data across subclones for patient RRMM15. Only mtDNA mutations with a mean heteroplasmy >1% in at least one of the 2 samples are shown. The proportion of cells per mtDNA mutation, subclone, and time point is shown. Clonal relationships are indicated by framing branches. Color legend indicates the heteroplasmy of mtDNA mutations. (D-E) UMAP plots of single RRMM cells clustered according to chromatin accessibility profiles for patient RRMM15. Examples for (D) subclone enriched and (E) branch enriched mtDNA mutations are shown. Each individual cell is colored according to (top) the respective subclone or (bottom) the heteroplasmy of the indicated mtDNA mutations, with red representing >10% and gray, 0%. (F) Heatmap of the most highly variable 72 TF motifs across all subclones of T1 and T2. Color indicates pseudobulk TF motif deviation score per subclone. (G) UMAP plots of single RRMM cells. Each cell is colored according to the TF motif deviation score of POU5F1B, TCF3, and IRF4. (H) Stability of mtDNA mutations from diagnosis to relapsed/refractory disease. Line plots showing the variant allele frequency of each mtDNA mutation in longitudinal samples of the indicated patients. Only mtDNA mutations with a mean heteroplasmy >1% in at least 1 of the paired samples (T1/T2) were considered. mtDNA mutations enriched in relapsed/refractory samples are colored in red.
Figure 2.
Figure 2.
Mitochondrial mutations further delineate the subclonal structure. (A) Mitochondrial DNA (mtDNA) mutations detected in scATAC-seq data across patients. Only mtDNA mutations with a mean heteroplasmy >1% in at least one of the paired samples were considered. The color bar at the top indicates the respective patient and sampling time point before treatment (T1) and at relapse (T2). (B) Inferred phylogenetic clonal tree for patient RRMM15. Top node denotes the common ancestor, from which subclones are derived according to their respective CNA and mtDNA mutation changes detected via WGS, scRNA-seq, and scATAC-seq. (Bottom) scATAC-seq heatmap of 1912 differential accessibility peaks and 3034 differential gene scores across subclones for patient RRMM15. Color indicates the column Z score of normalized peak accessibility and gene scores, respectively. (C) Heatmap of mtDNA mutations inferred from scATAC-seq data across subclones for patient RRMM15. Only mtDNA mutations with a mean heteroplasmy >1% in at least one of the 2 samples are shown. The proportion of cells per mtDNA mutation, subclone, and time point is shown. Clonal relationships are indicated by framing branches. Color legend indicates the heteroplasmy of mtDNA mutations. (D-E) UMAP plots of single RRMM cells clustered according to chromatin accessibility profiles for patient RRMM15. Examples for (D) subclone enriched and (E) branch enriched mtDNA mutations are shown. Each individual cell is colored according to (top) the respective subclone or (bottom) the heteroplasmy of the indicated mtDNA mutations, with red representing >10% and gray, 0%. (F) Heatmap of the most highly variable 72 TF motifs across all subclones of T1 and T2. Color indicates pseudobulk TF motif deviation score per subclone. (G) UMAP plots of single RRMM cells. Each cell is colored according to the TF motif deviation score of POU5F1B, TCF3, and IRF4. (H) Stability of mtDNA mutations from diagnosis to relapsed/refractory disease. Line plots showing the variant allele frequency of each mtDNA mutation in longitudinal samples of the indicated patients. Only mtDNA mutations with a mean heteroplasmy >1% in at least 1 of the paired samples (T1/T2) were considered. mtDNA mutations enriched in relapsed/refractory samples are colored in red.
Figure 3.
Figure 3.
Subclone-specific adaptation mechanisms to treatment reflect the clonal evolution pattern. (A) (Left) Percentage of differentially expressed genes between T1 and T2 that are shared across subclones of the same patient (Padj ≤ .05; 1.5-fold enrichment both ways; Wilcoxon rank sum test). (Right) Percentage of TF motif activity changes between T1 and T2 (Padj ≤ .05) that are shared across subclones of the same patient. Motif deviation scores were calculated based on all differential peaks, with Padj ≤ .05 and 1.5-fold enrichment (Wilcoxon rank sum test). (B,E,H) Bar plot depicting the subclone frequency of patients (B) RRMM7, (E) RRMM3, and (H) RRMM9 and time points (T1/T2) based on scATAC-seq data. Individual stacks are colored according to the respective subclone identity. (C,F,I) Gene expression changes for patients (C) RRMM7, (F) RRMM3, and (I) RRMM9 across subclones from T1 to T2. Color indicates pseudobulk gene expression of the differentially expressed genes between T1 and T2 (Padj ≤ .05; RRMM3+7: 1.5-fold enrichment both ways, RRMM9: log2-fold change >0.25 both ways; Wilcoxon rank sum test). (Left) Heatmap of scRNA-seq pseudobulk expression across subclones and timepoints. Significant (C) HSPs or (F,I) genes of the NF-κB pathway commonly upregulated in all subclones that have previously been described in the context of drug resistance are labelled. (Right) Violin plots showing normalized gene expression per time point and subclone for HSPs or genes belonging to the NF-κB pathway. (D,G,J) Epigenetic changes for patients (D) RRMM7, (G) RRMM3, and (J) RRMM9 across subclones from T1 to T2. Color indicates pseudobulk TF motif activity of the top 50 most highly variable TFs (plus NF-κB TFs motifs for RRMM9). (Left) Heatmap of the top 50 of 54 TF motifs, which show a significant higher or lower motif deviation score at relapse (T2) compared with that at T1. (D) TFs putatively binding to the HSPs promoter or (G,J) TFs from the NF-κB family commonly upregulated in both subclones are labelled. (Right) Violin plots showing scATAC-seq TF motif activity per time point and subclone for 2 or 3 exemplary TFs.
Figure 4.
Figure 4.
Differential treatment response is associated with subclone-specific BME interaction. (A) (Left) Bar plot depicting the proportion of subclones per time point for patient RRMM6, detected via scATAC-seq. The individual stacks are colored according to the respective subclone identity. (Right) Phylogenetic tree for patient RRMM6. Top node at baseline denotes the most recent common ancestor with subsequent decedents being shown according to the combined CNA and mtDNA mutation subclone assignment. (B) Viability of the MM cell line AMO-1 based on normalized CellTiter-Glo luminescence reads on exposure to increasing concentrations of MCL-1 inhibitor MIK665 (Novartis) for 24 hours in cells with wt TP53 or biallelic TP53 (TP53 del/mut [R175H]). Data are represented as means ± standard deviation; n = 3. Welch two-sample t test: ∗P < .05; ∗∗P < .01; ∗∗∗P < .001. (C) Volcano plot summarizing the global changes in gene expression levels between subclones 1 and 2 for patient RRMM6. An absolute Padj value of .05 is indicated by a dashed line (Wilcoxon rank sum test). Surface markers are labeled. (D) Chromatin accessibility at the CD44 promoter plus 50 kb upstream and downstream in patient RRMM6. The CD44 promoter peak is highlighted in light blue. (Top) Aggregated pseudobulk scATAC-seq tracks at both timepoints. (Right) Violin plots showing normalized CD44 expression from scRNA-seq data per timepoint with individual cells plotted as dots. (Middle) Peaks are colored based on the location of the peak in either promoter (orange), distal (red), exonic (blue), or intronic (green) regions; (bottom) peak coaccessibility in the CD44 region at both timepoints colored based on the Pearson correlation coefficient. (E) CD44 expression based on bulk RNA-seq data in a set of 46 patients with RRMM with biallelic-inactivated (n = 8), monoallelic-depleted (n = 11) or wt TP53 (n = 27). (F) CD44 expression in genetically engineered biallelic TP53 del/mut (R175H) and wt/wt AMO-1 cell lines. (Top) Publicly available bulk RNA-seq data (GSE13234052,53) were analyzed for CD44 expression. Box plot of normalized expression values for n = 3 replicates. (Bottom) Western blot analysis of CD44 protein levels in the indicated MM cell lines. Tubulin was used as a loading control. This blot is representative of 3 independent experiments. (G) Violin and box-whisker plots showing normalized CD44 expression per timepoint and subclone for patient RRMM6. (H) Circos plot and chord interaction diagram of LGALS9-CD44–mediated interactions between subclones of patient RRMM6 and BME cells. The links start at a sender and end at a receiver. Sender-receiver interactions seen in all subclones as well as between BME cells are not indicated.
Figure 5.
Figure 5.
Shared BME interactions across subclones indicate potentially actionable therapeutic targets. (A) Total number of cellular interactions between myeloma and BME cells in patients with RRMM. Predicted unshared (subclone-specific) and shared (interactions predicted in all subclones per patient) interactions are shown. (B) Total number of cellular interactions between specific subclones and BME cells in RRMM patients. Unshared interactions are colored based on the interaction type: (1) subclonal, interactions predicted to be specific for a subclone; (2) temporal, time point–specific interactions that are shared between ≥ 2 subclones; or (3) subclonal + temporal, interactions of a subclone that differ between time points T1 and T2. Sender-receiver interactions seen in all subclones as well as between BME cells are not indicated. (C) Circos plot and chord interaction diagram of ICAM1-(ITGAX + ITGB2) mediated interactions between subclones of patient RRMM15 and BME cells. The links start at a sender and end at a receiver. (D) Pathways based on CellChatDB ranked based on the number of subclone-specific interactions across our patient cohort. (E) Bulk RNA-seq differential expression (log2-fold change) of ICAM1 between time point T1 (before treatment initiation) and T2 (at relapse) of CD138+-enriched PCs isolated from serial samples of 16 patients with RRMM. (F) Chromatin accessibility at the ICAM1 promoter plus 50 kb upstream and downstream in patient RRMM15. The ICAM1 promoter peak is highlighted in light blue. (Top) Aggregated pseudobulk scATAC-seq tracks at both time points. (Right) Violin plots showing normalized ICAM1 expression per time point, with individual cells plotted as dots. (Middle) Peaks are colored based on the location of the peak in either promoter (orange), distal (red), exonic (blue), or intronic (green) regions. IRF4 ChIP-seq peaks from the MM cell line KMS12BM are shown in purple. (Bottom) Peak coaccessibility in the ICAM1 region at both time points colored based on the Pearson correlation coefficient. (G) The top TF motifs for patient RRMM15, which show a significantly higher motif deviation score at relapse (T2) compared with that at T1. TFs putatively binding to the ICAM1 promoter are labeled in blue.

Comment in

References

    1. Marusyk A, Janiszewska M, Polyak K. Intratumor heterogeneity: the rosetta stone of therapy resistance. Cancer Cell. 2020;37(4):471–484. - PMC - PubMed
    1. Morgan GJ, Walker BA, Davies FE. The genetic architecture of multiple myeloma. Nat Rev Cancer. 2012;12(5):335–348. - PubMed
    1. Bolli N, Avet-Loiseau H, Wedge DC, et al. Heterogeneity of genomic evolution and mutational profiles in multiple myeloma. Nat Commun. 2014;5:2997. - PMC - PubMed
    1. Ziccheddu B, Biancon G, Bagnoli F, et al. Integrative analysis of the genomic and transcriptomic landscape of double-refractory multiple myeloma. Blood Adv. 2020;4(5):830–844. - PMC - PubMed
    1. Manier S, Salem KZ, Park J, Landau DA, Getz G, Ghobrial IM. Genomic complexity of multiple myeloma and its clinical implications. Nat Rev Clin Oncol. 2017;14(2):100–113. - PubMed

Publication types