. 2023 Jun:7:e2300021.
doi: 10.1200/CCI.23.00021.

Synthetic Data Generation by Artificial Intelligence to Accelerate Research and Precision Medicine in Hematology

Affiliations

Synthetic Data Generation by Artificial Intelligence to Accelerate Research and Precision Medicine in Hematology

Saverio D'Amico et al. JCO Clin Cancer Inform. 2023 Jun.

Abstract

Purpose: Synthetic data are artificial data generated without including any real patient information by an algorithm trained to learn the characteristics of a real source data set and became widely used to accelerate research in life sciences. We aimed to (1) apply generative artificial intelligence to build synthetic data in different hematologic neoplasms; (2) develop a synthetic validation framework to assess data fidelity and privacy preservability; and (3) test the capability of synthetic data to accelerate clinical/translational research in hematology.

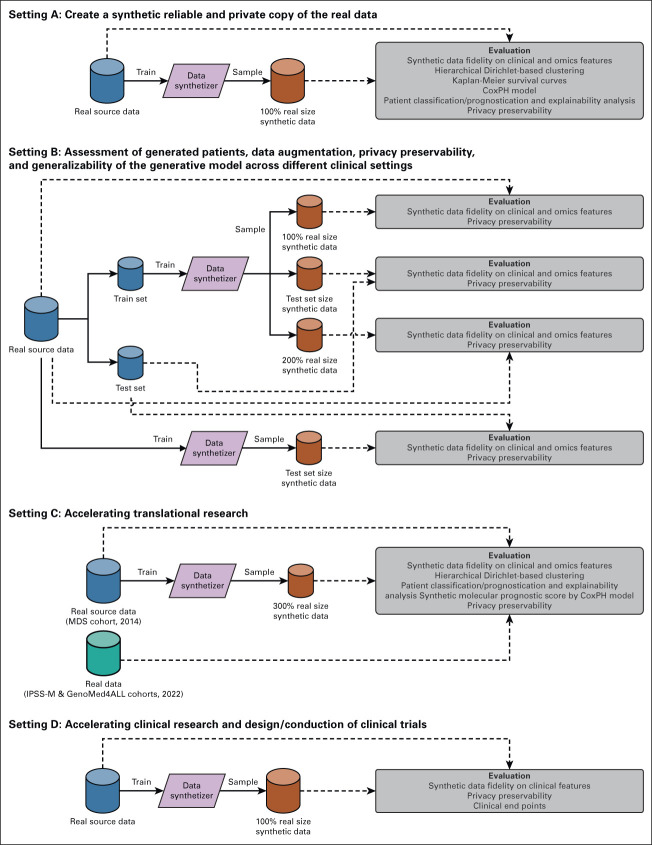
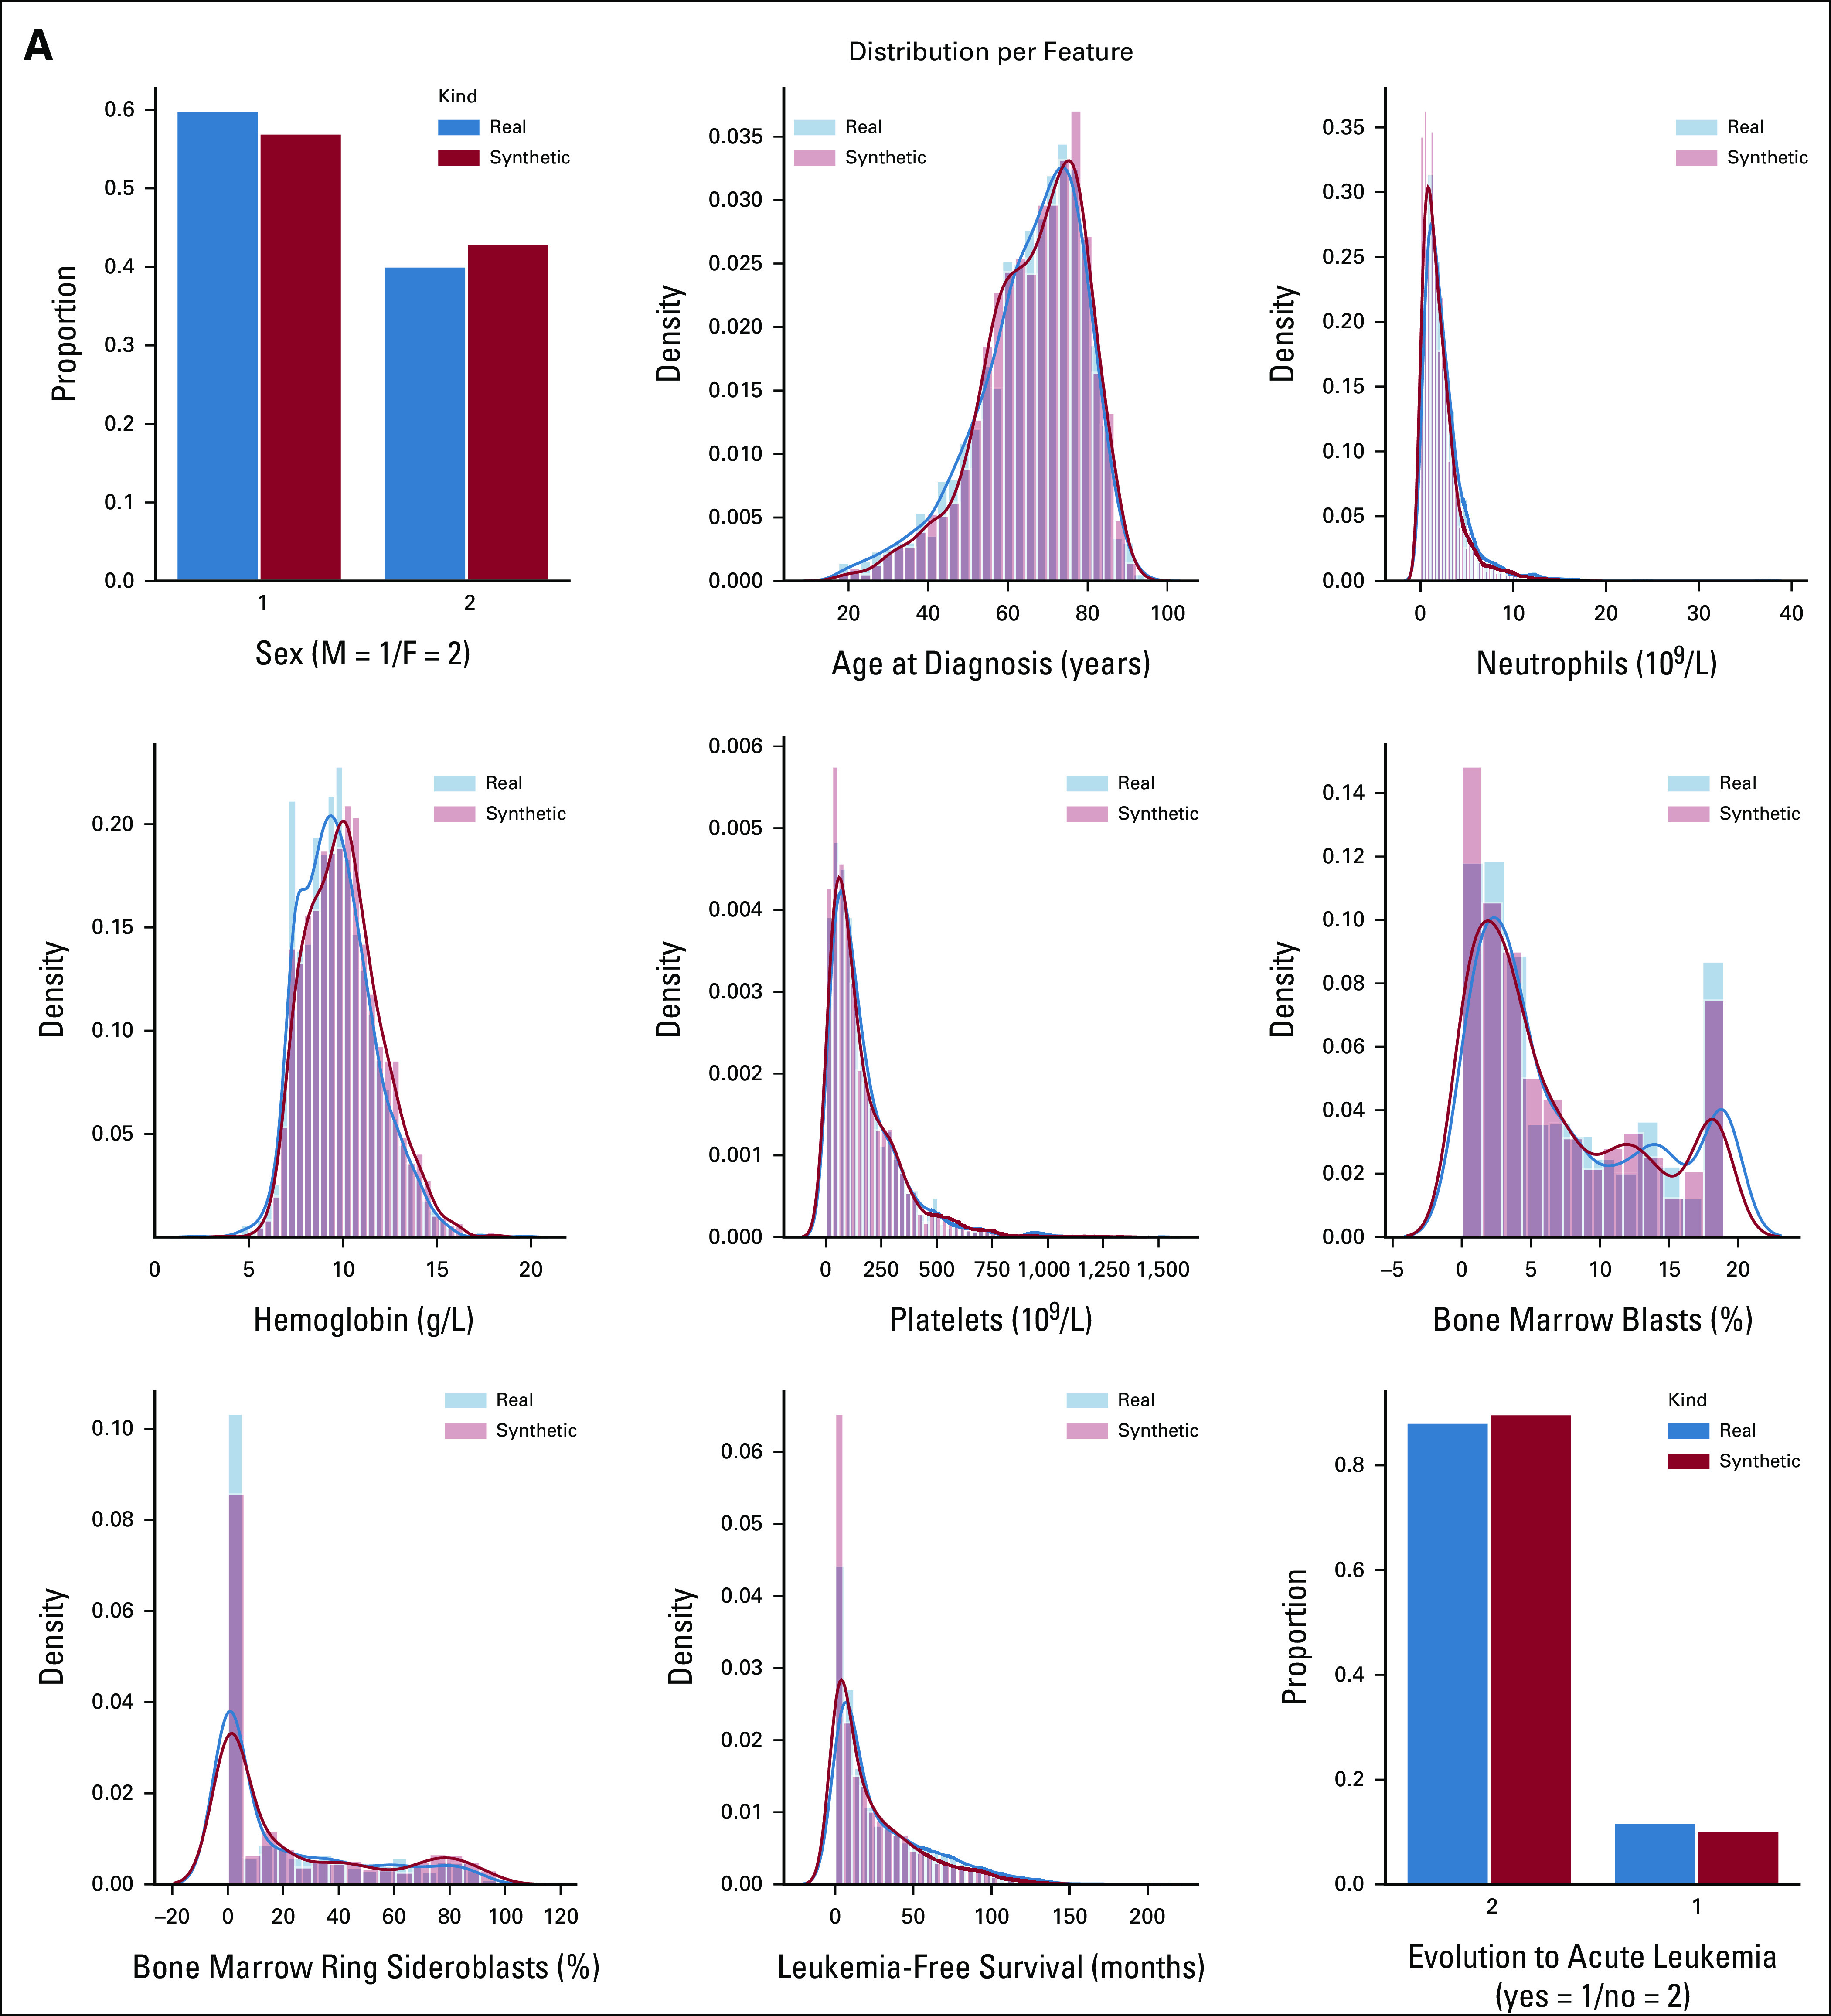
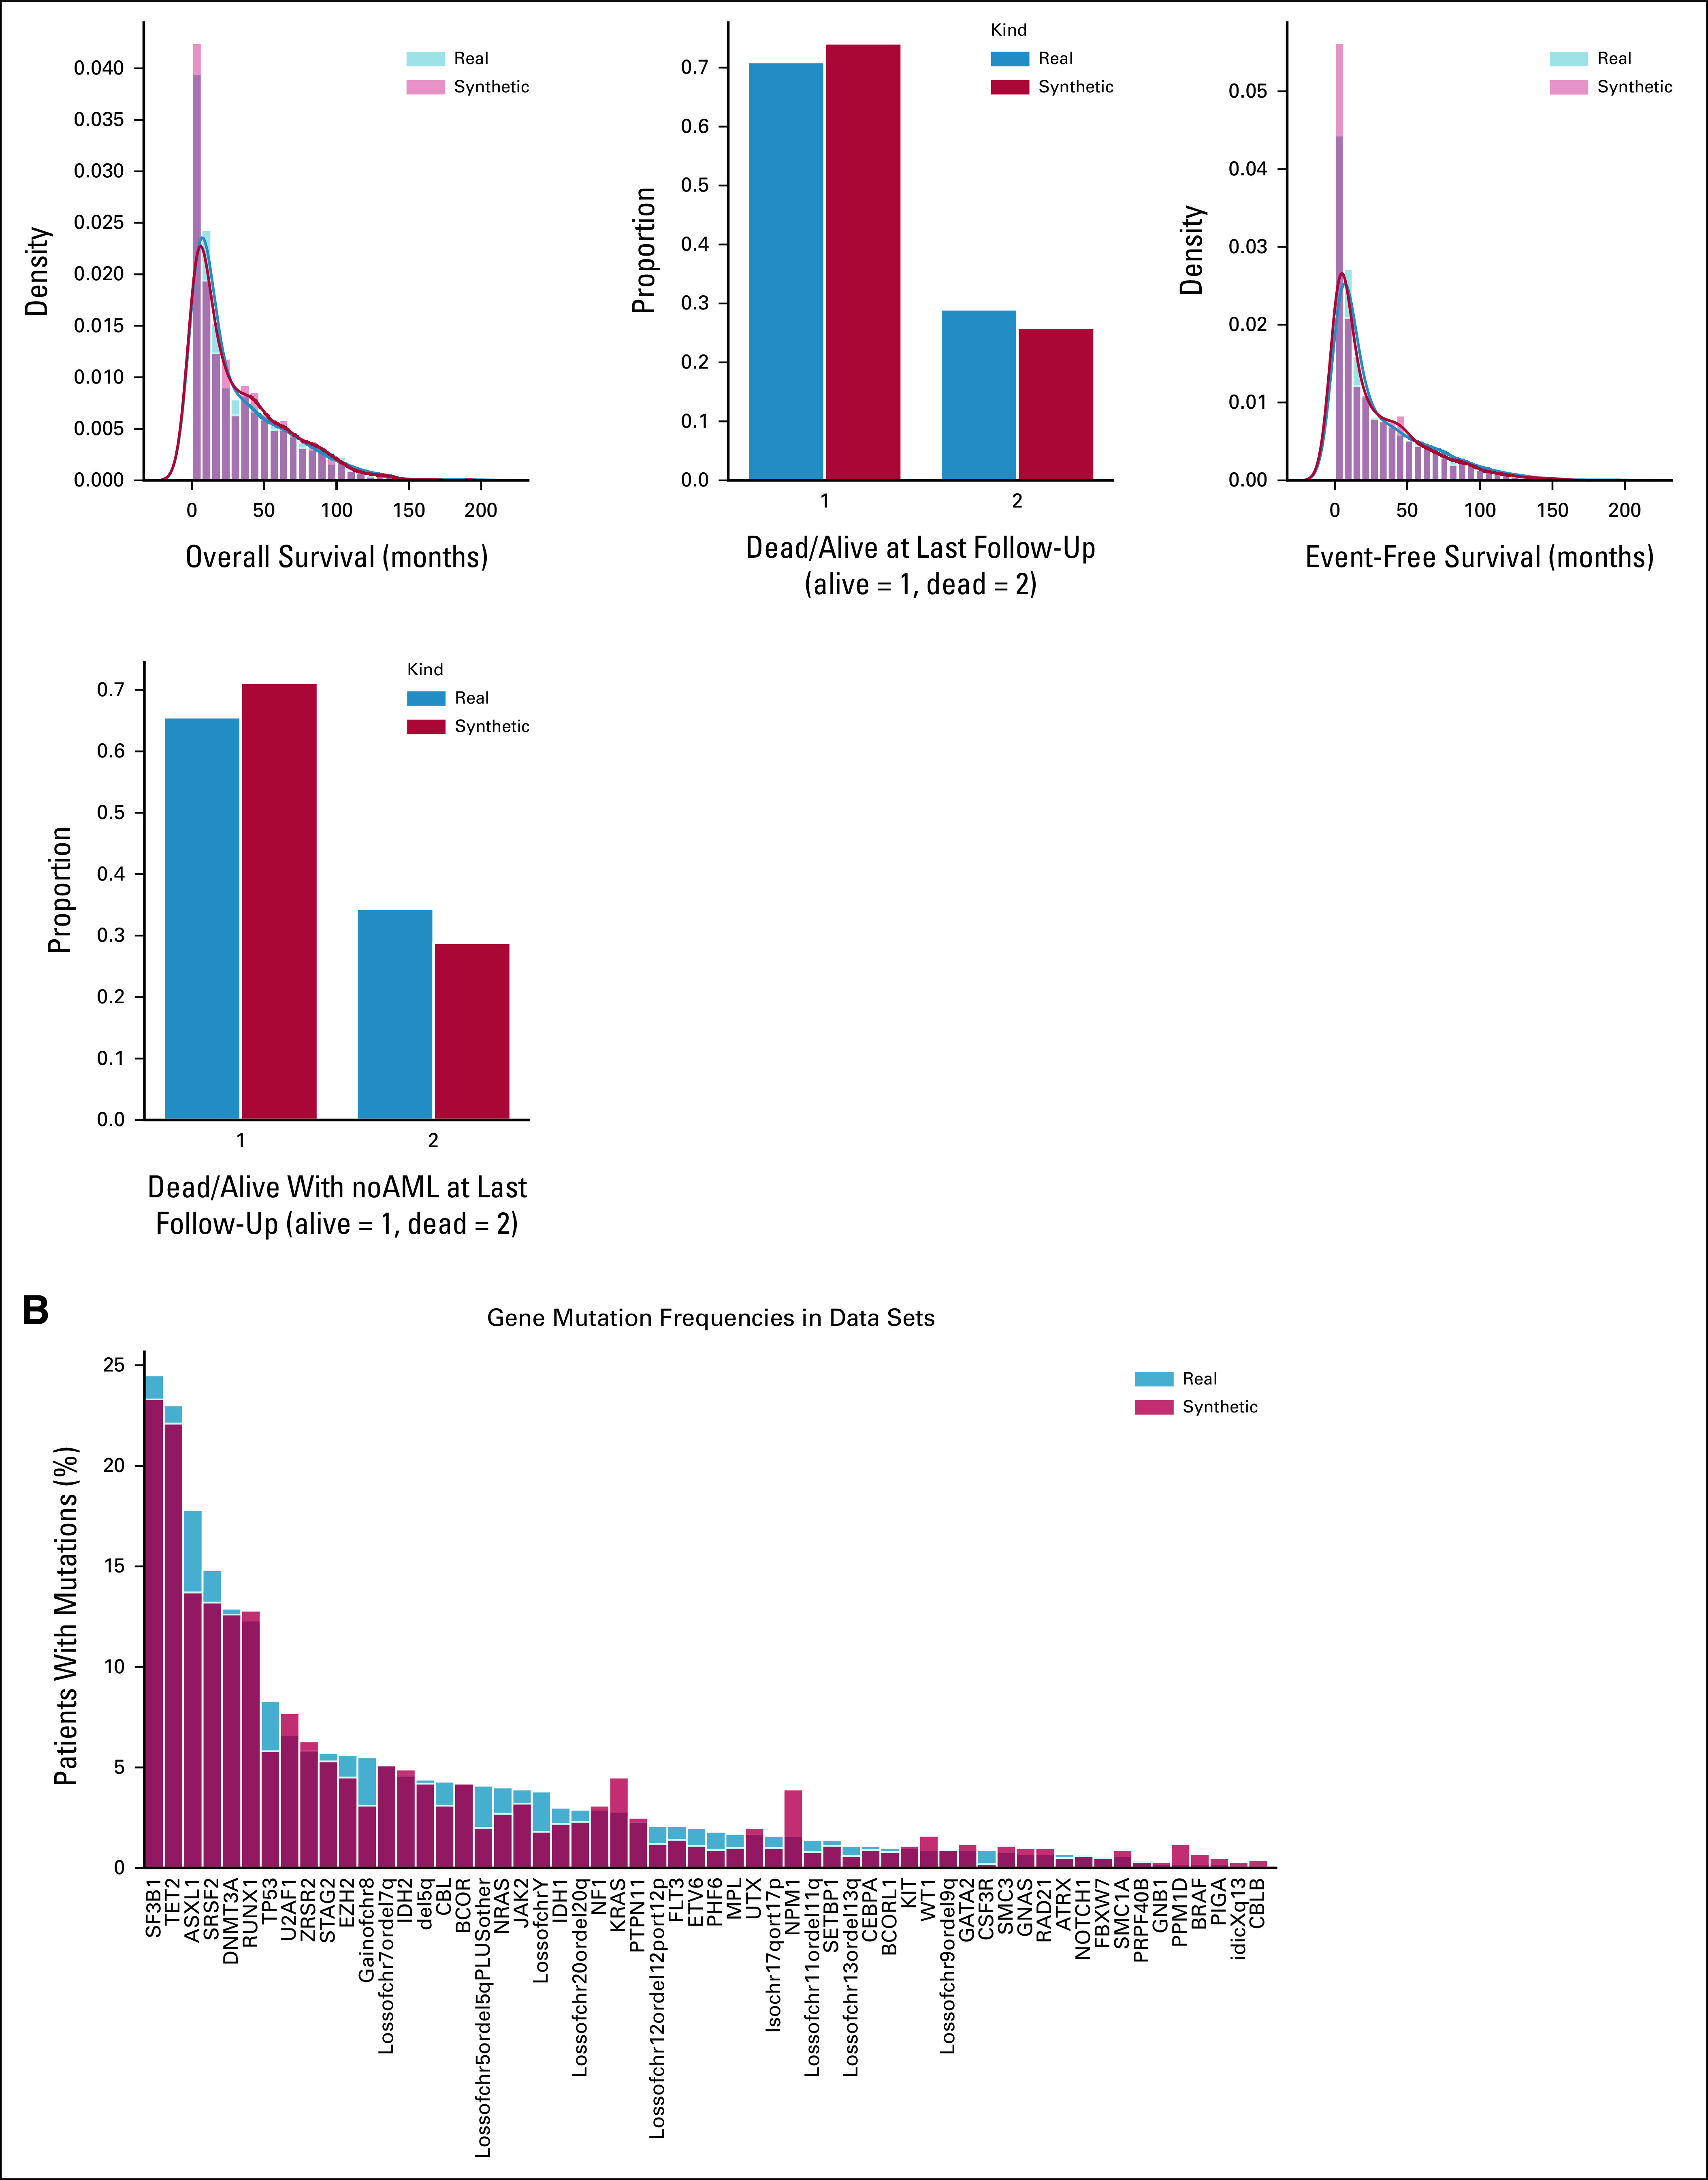
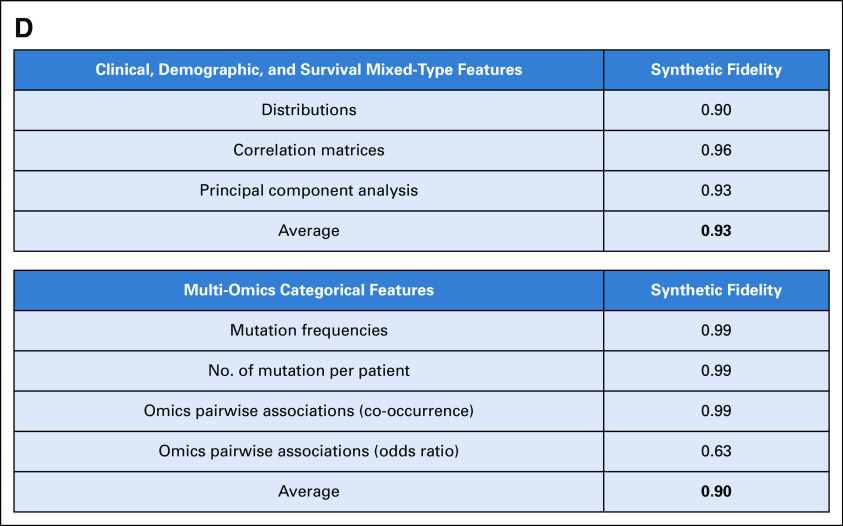
Methods: A conditional generative adversarial network architecture was implemented to generate synthetic data. Use cases were myelodysplastic syndromes (MDS) and AML: 7,133 patients were included. A fully explainable validation framework was created to assess fidelity and privacy preservability of synthetic data.

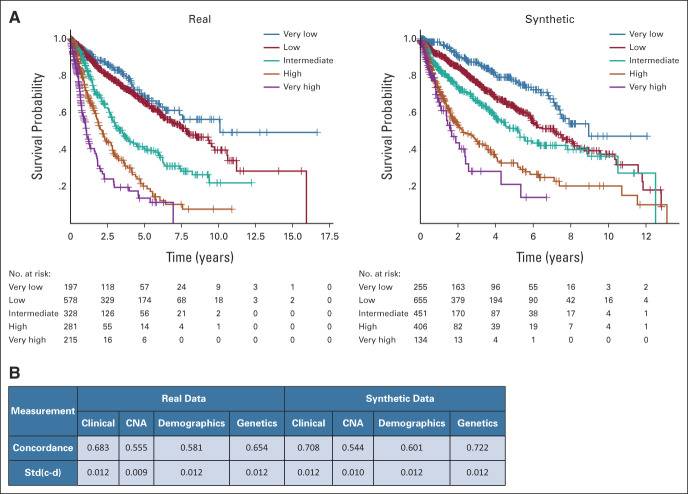
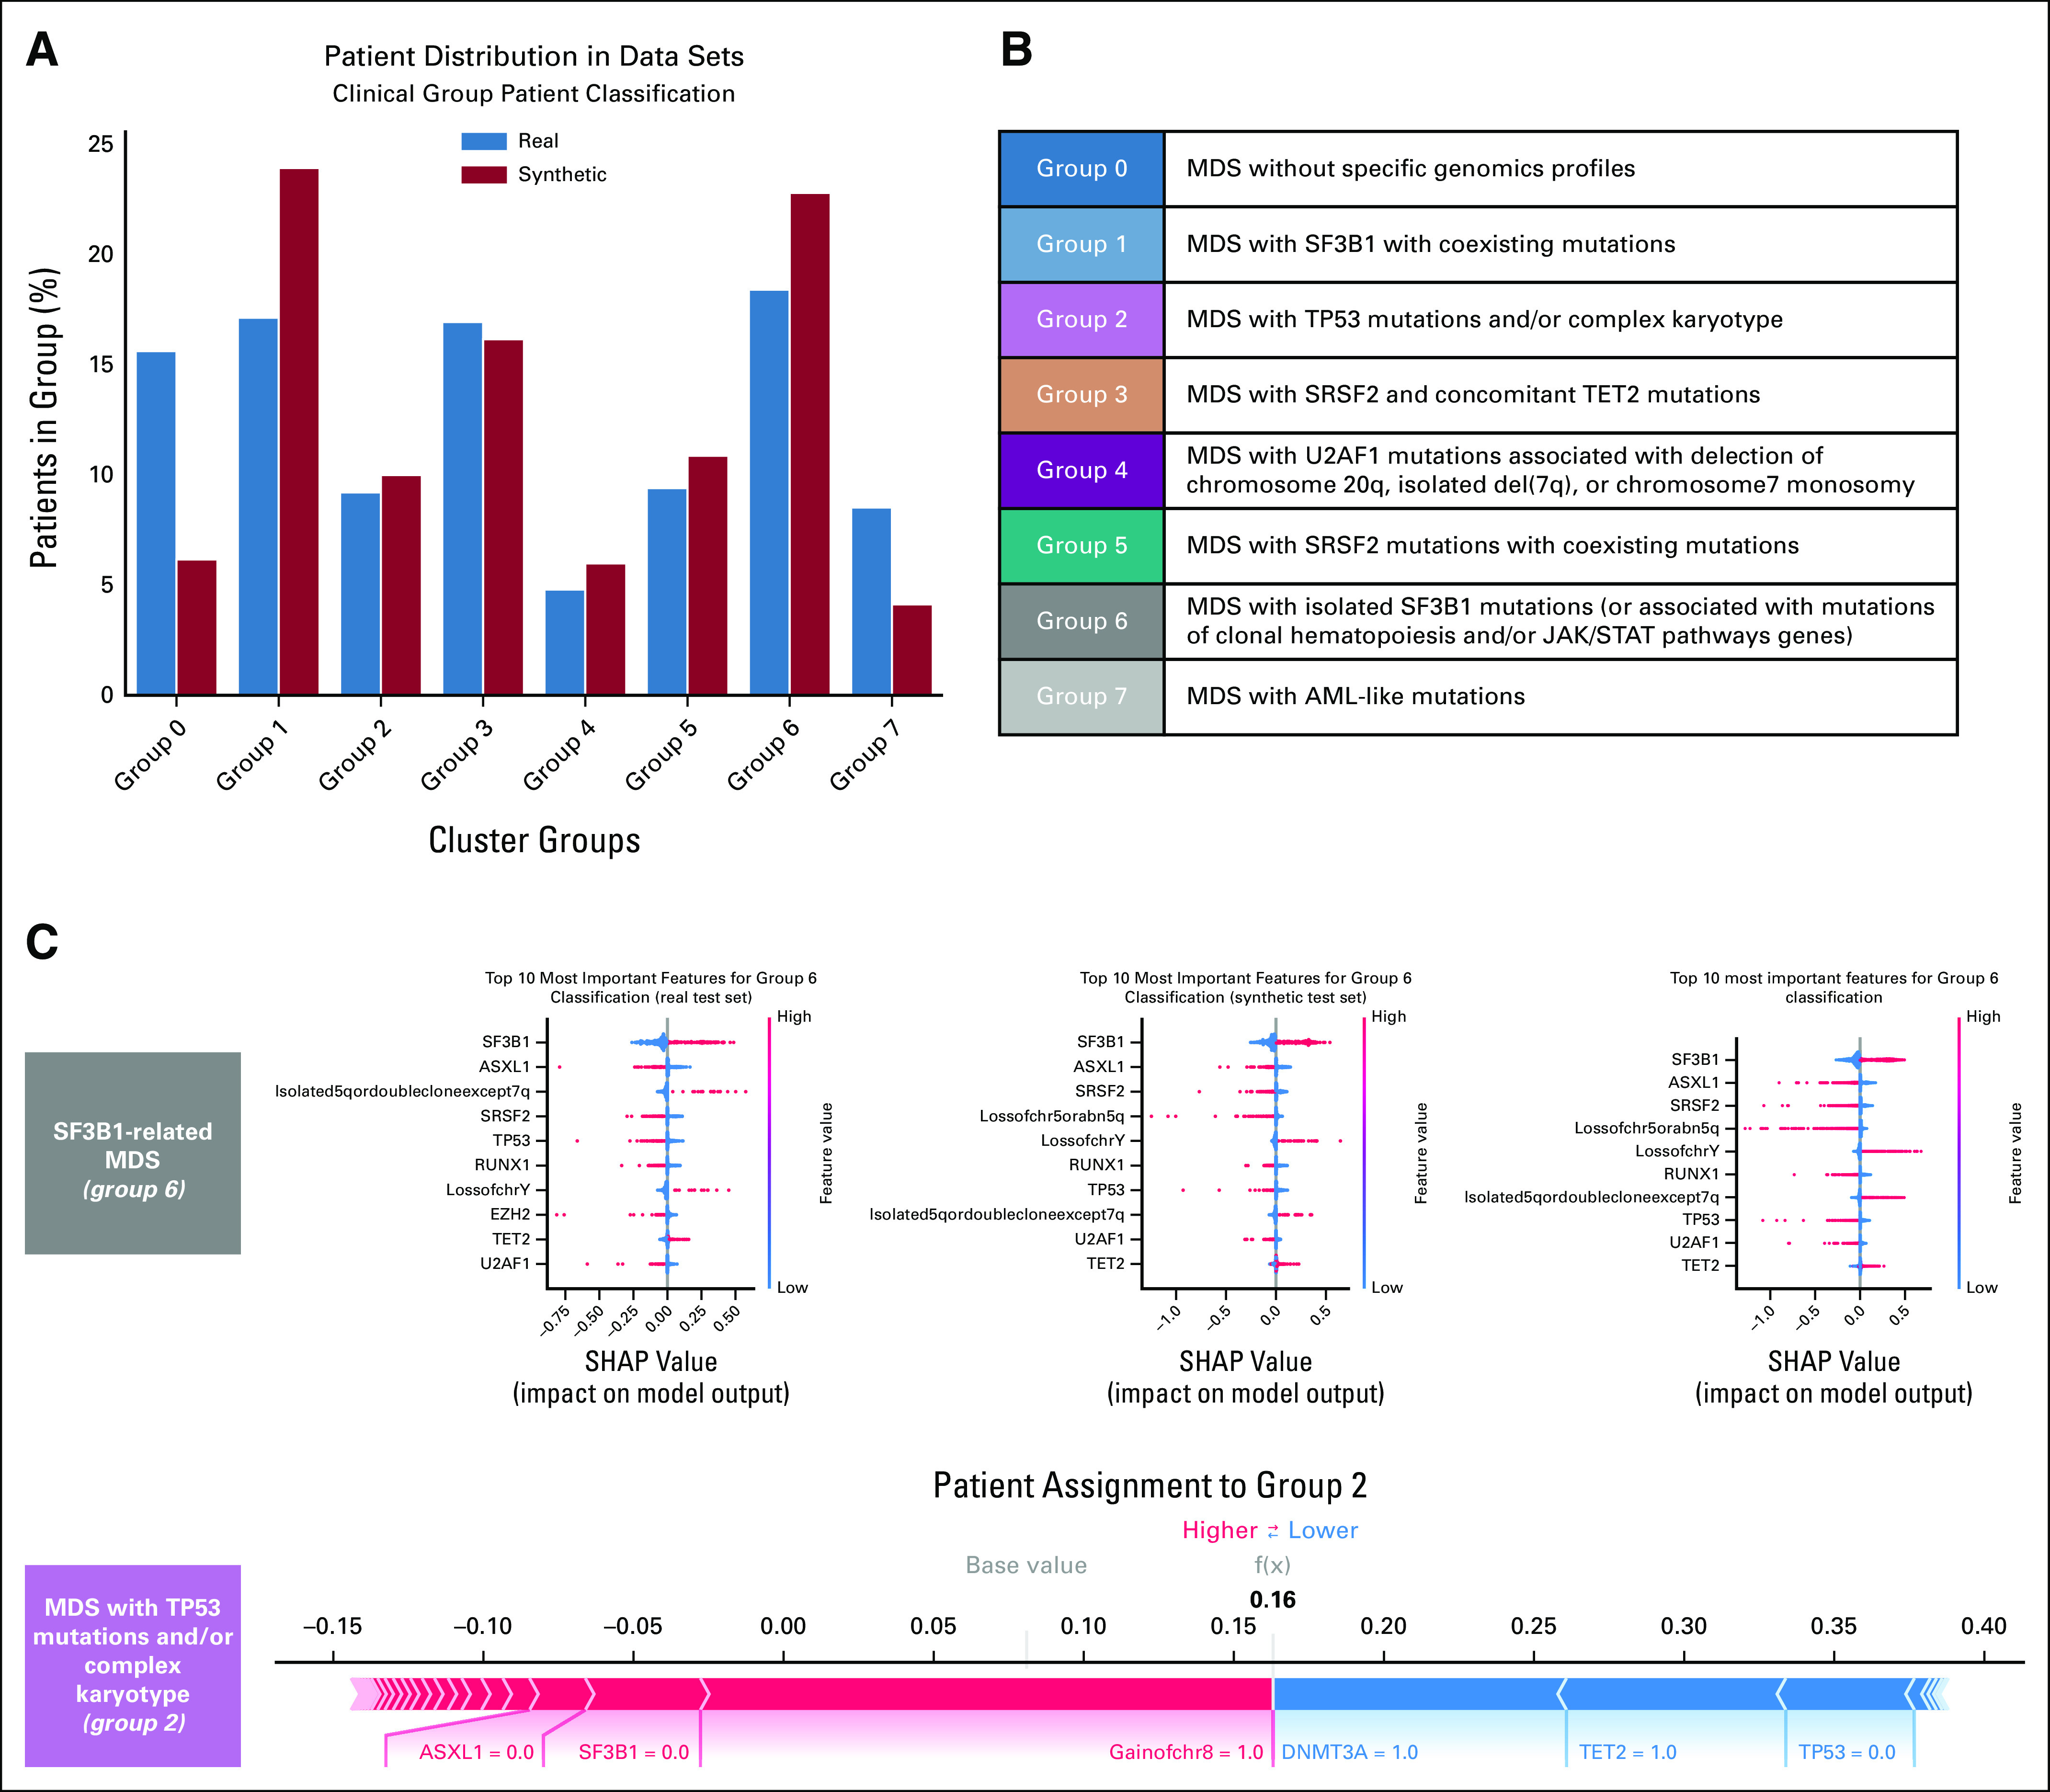
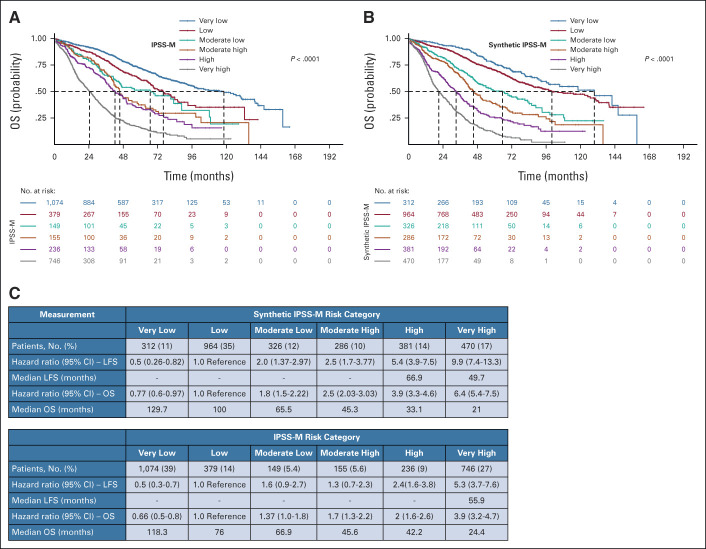
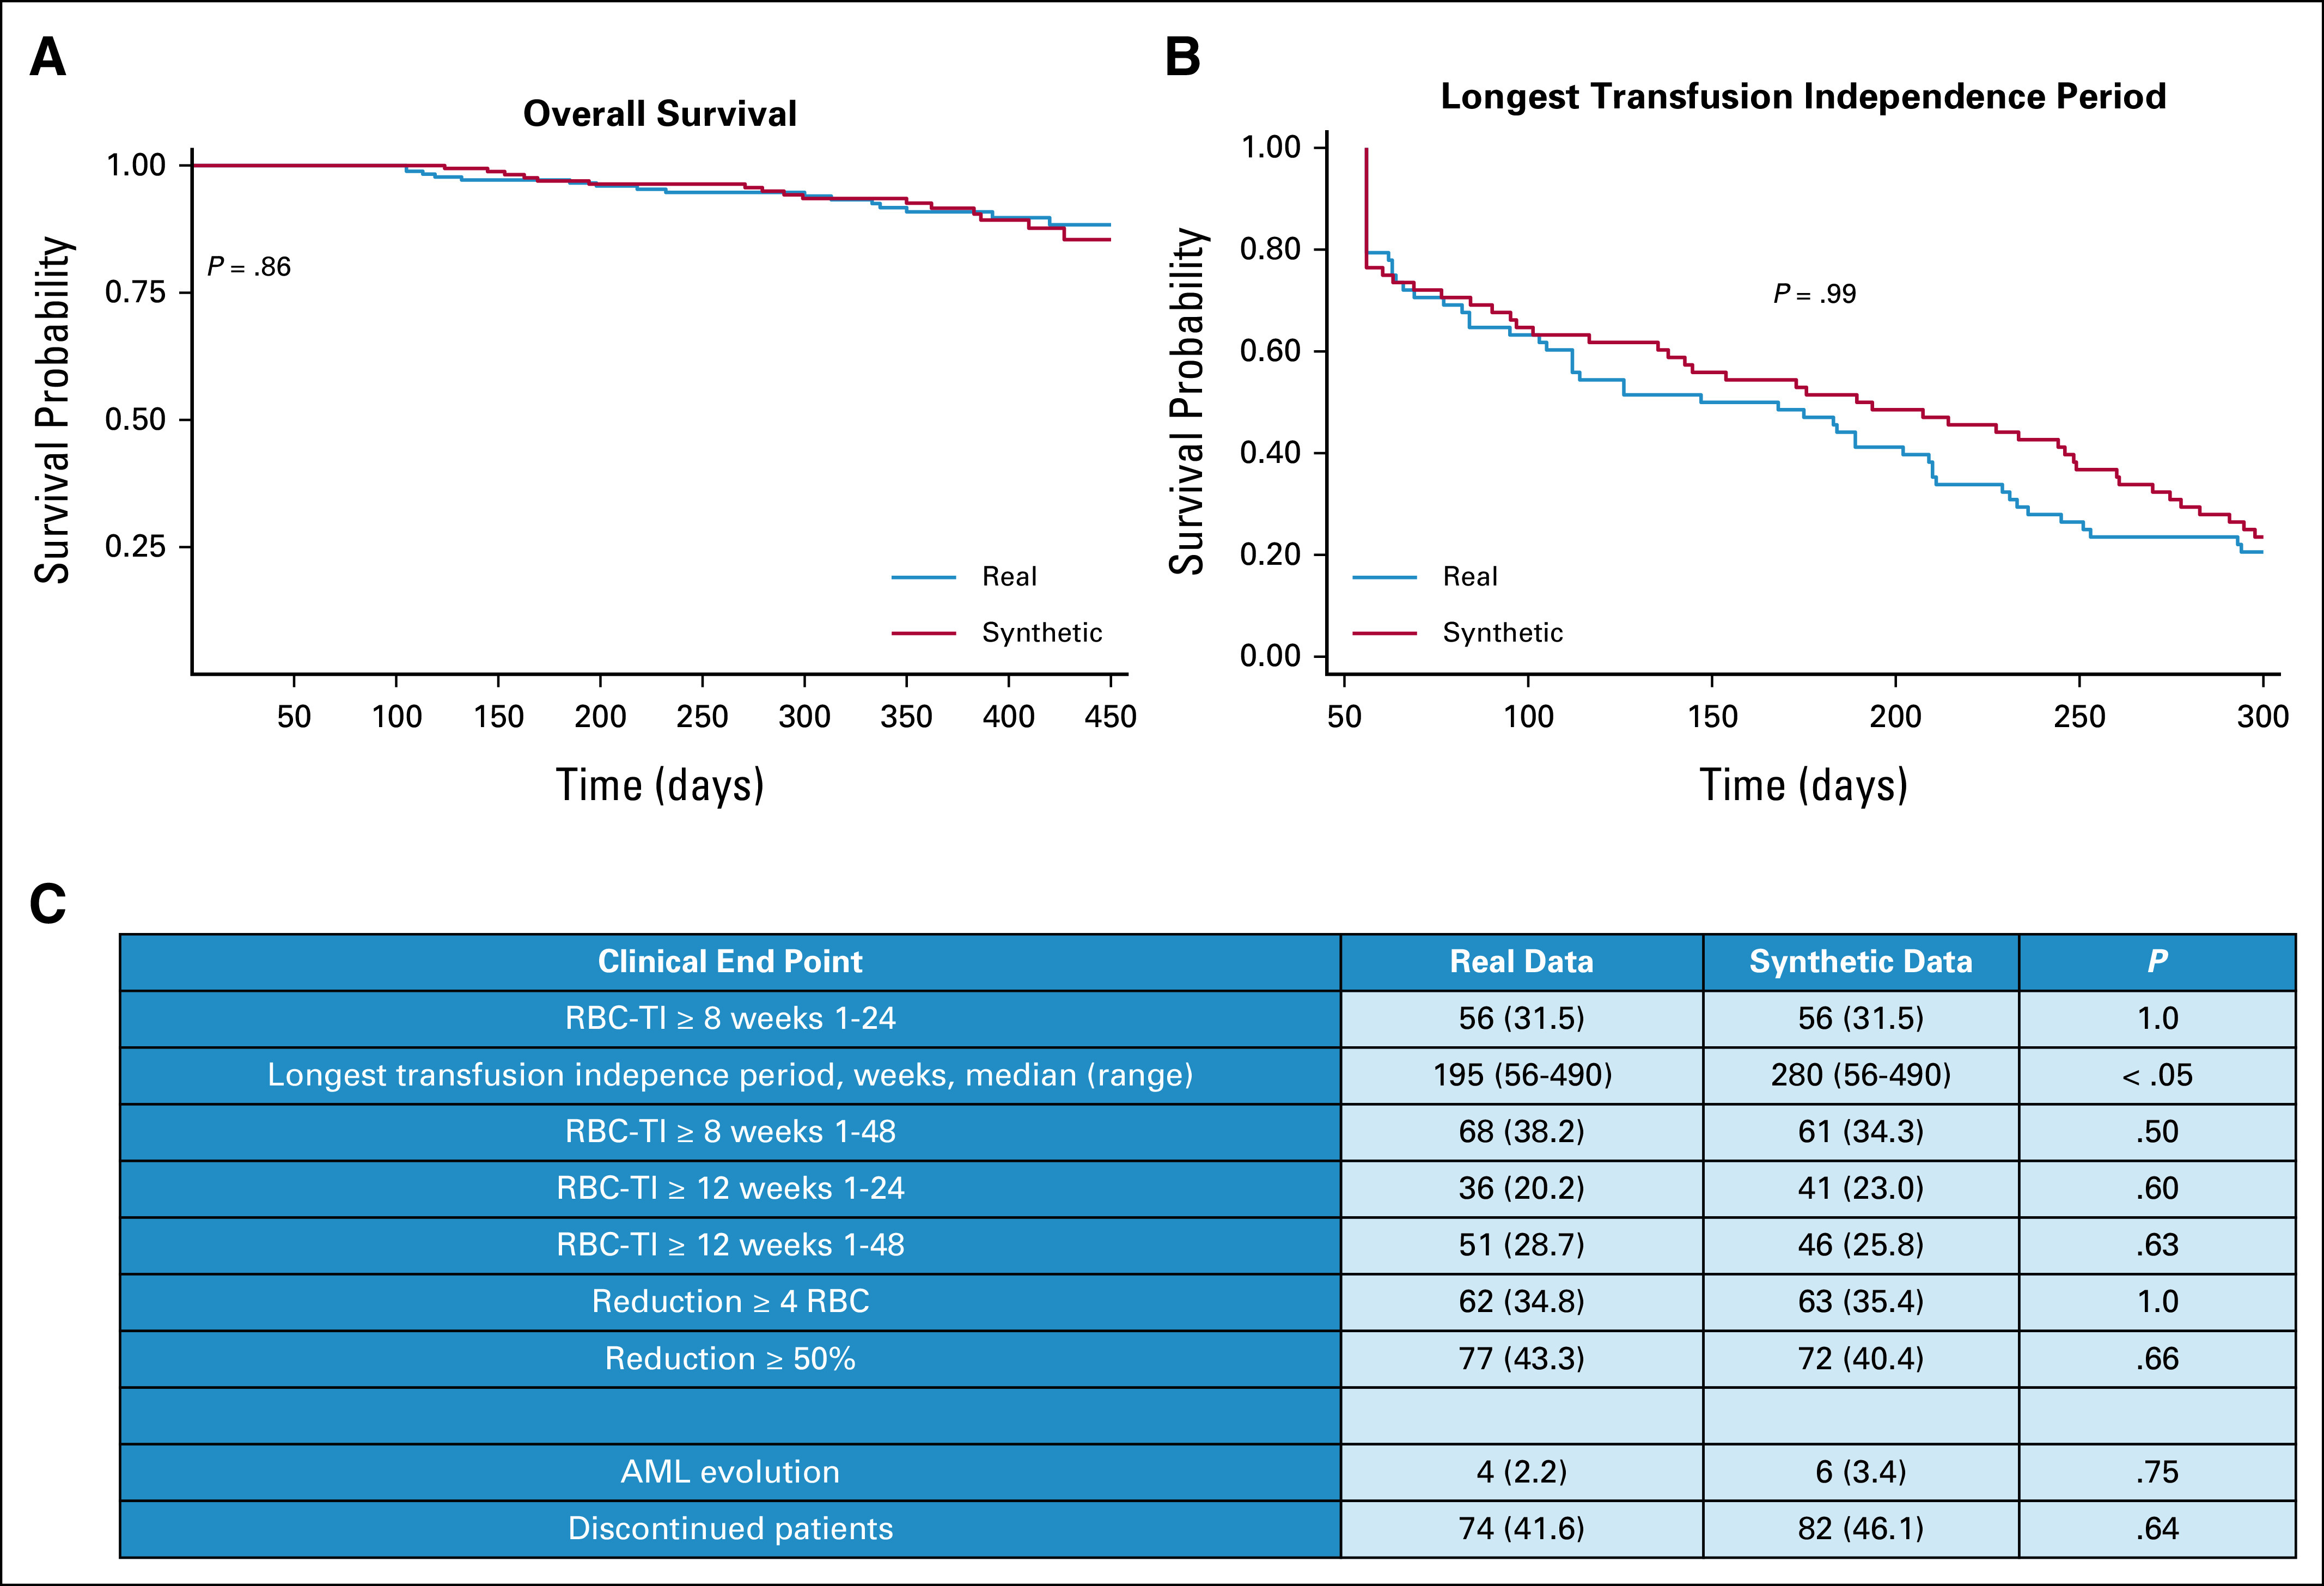
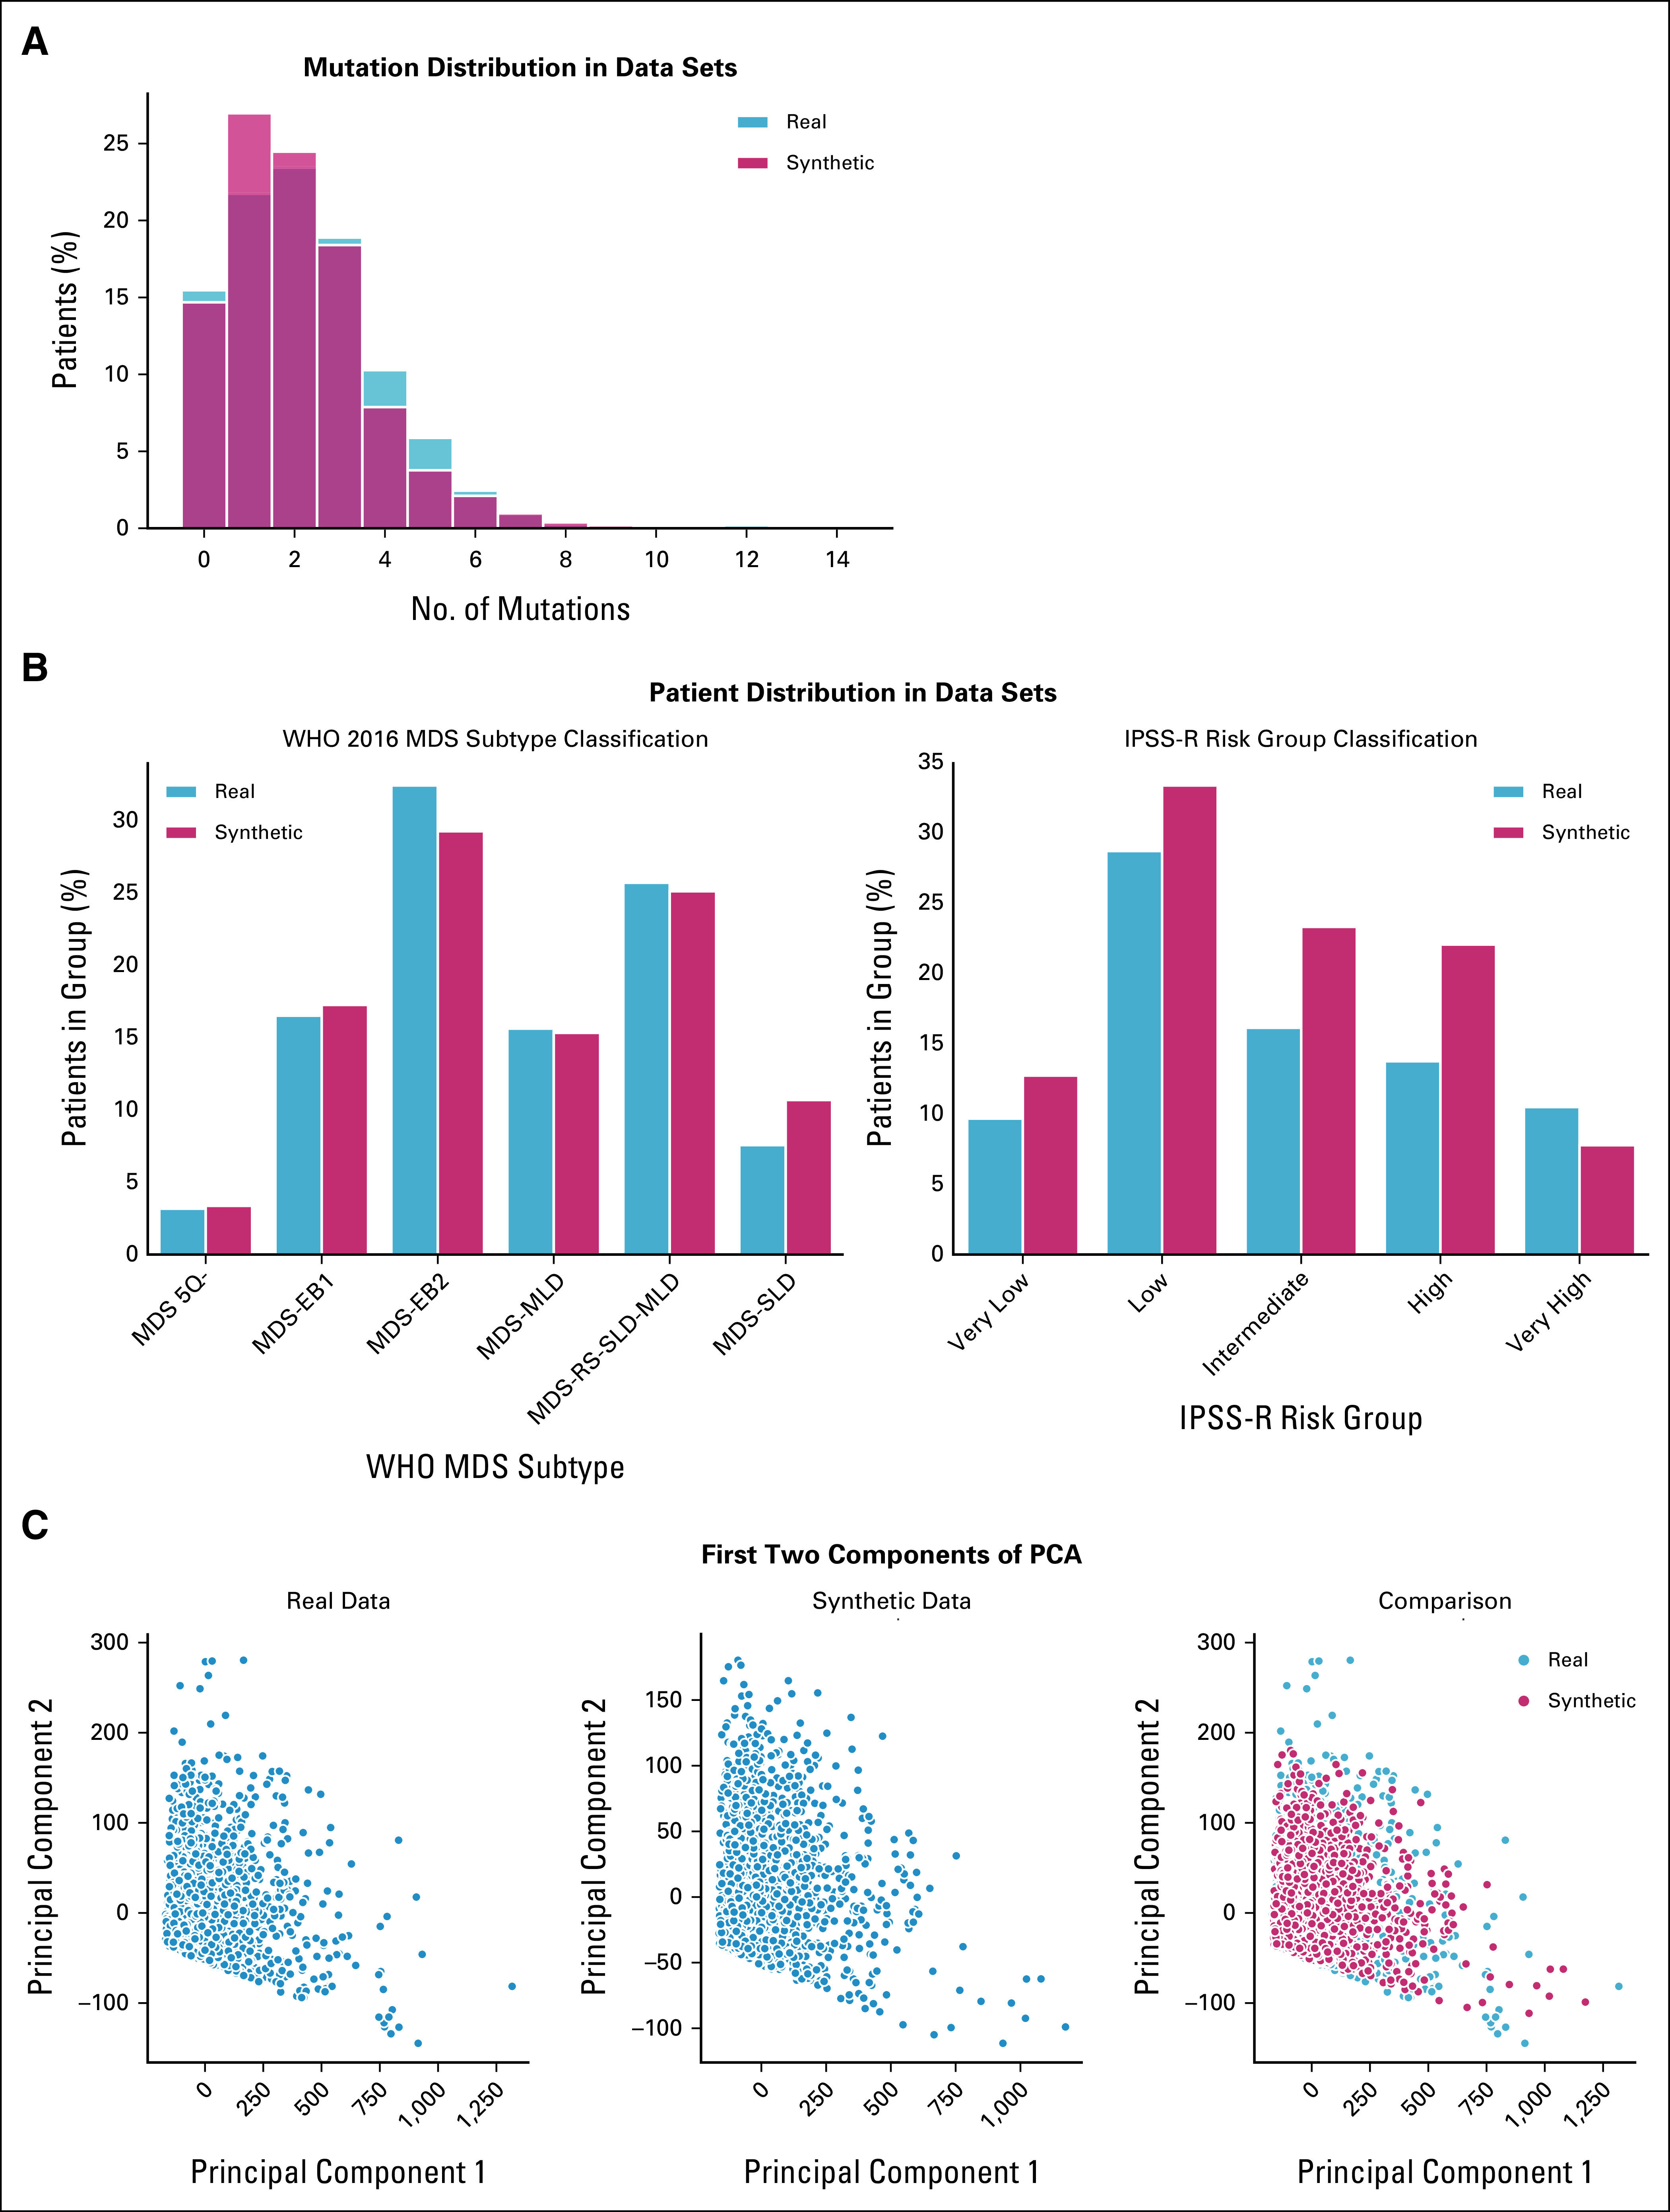
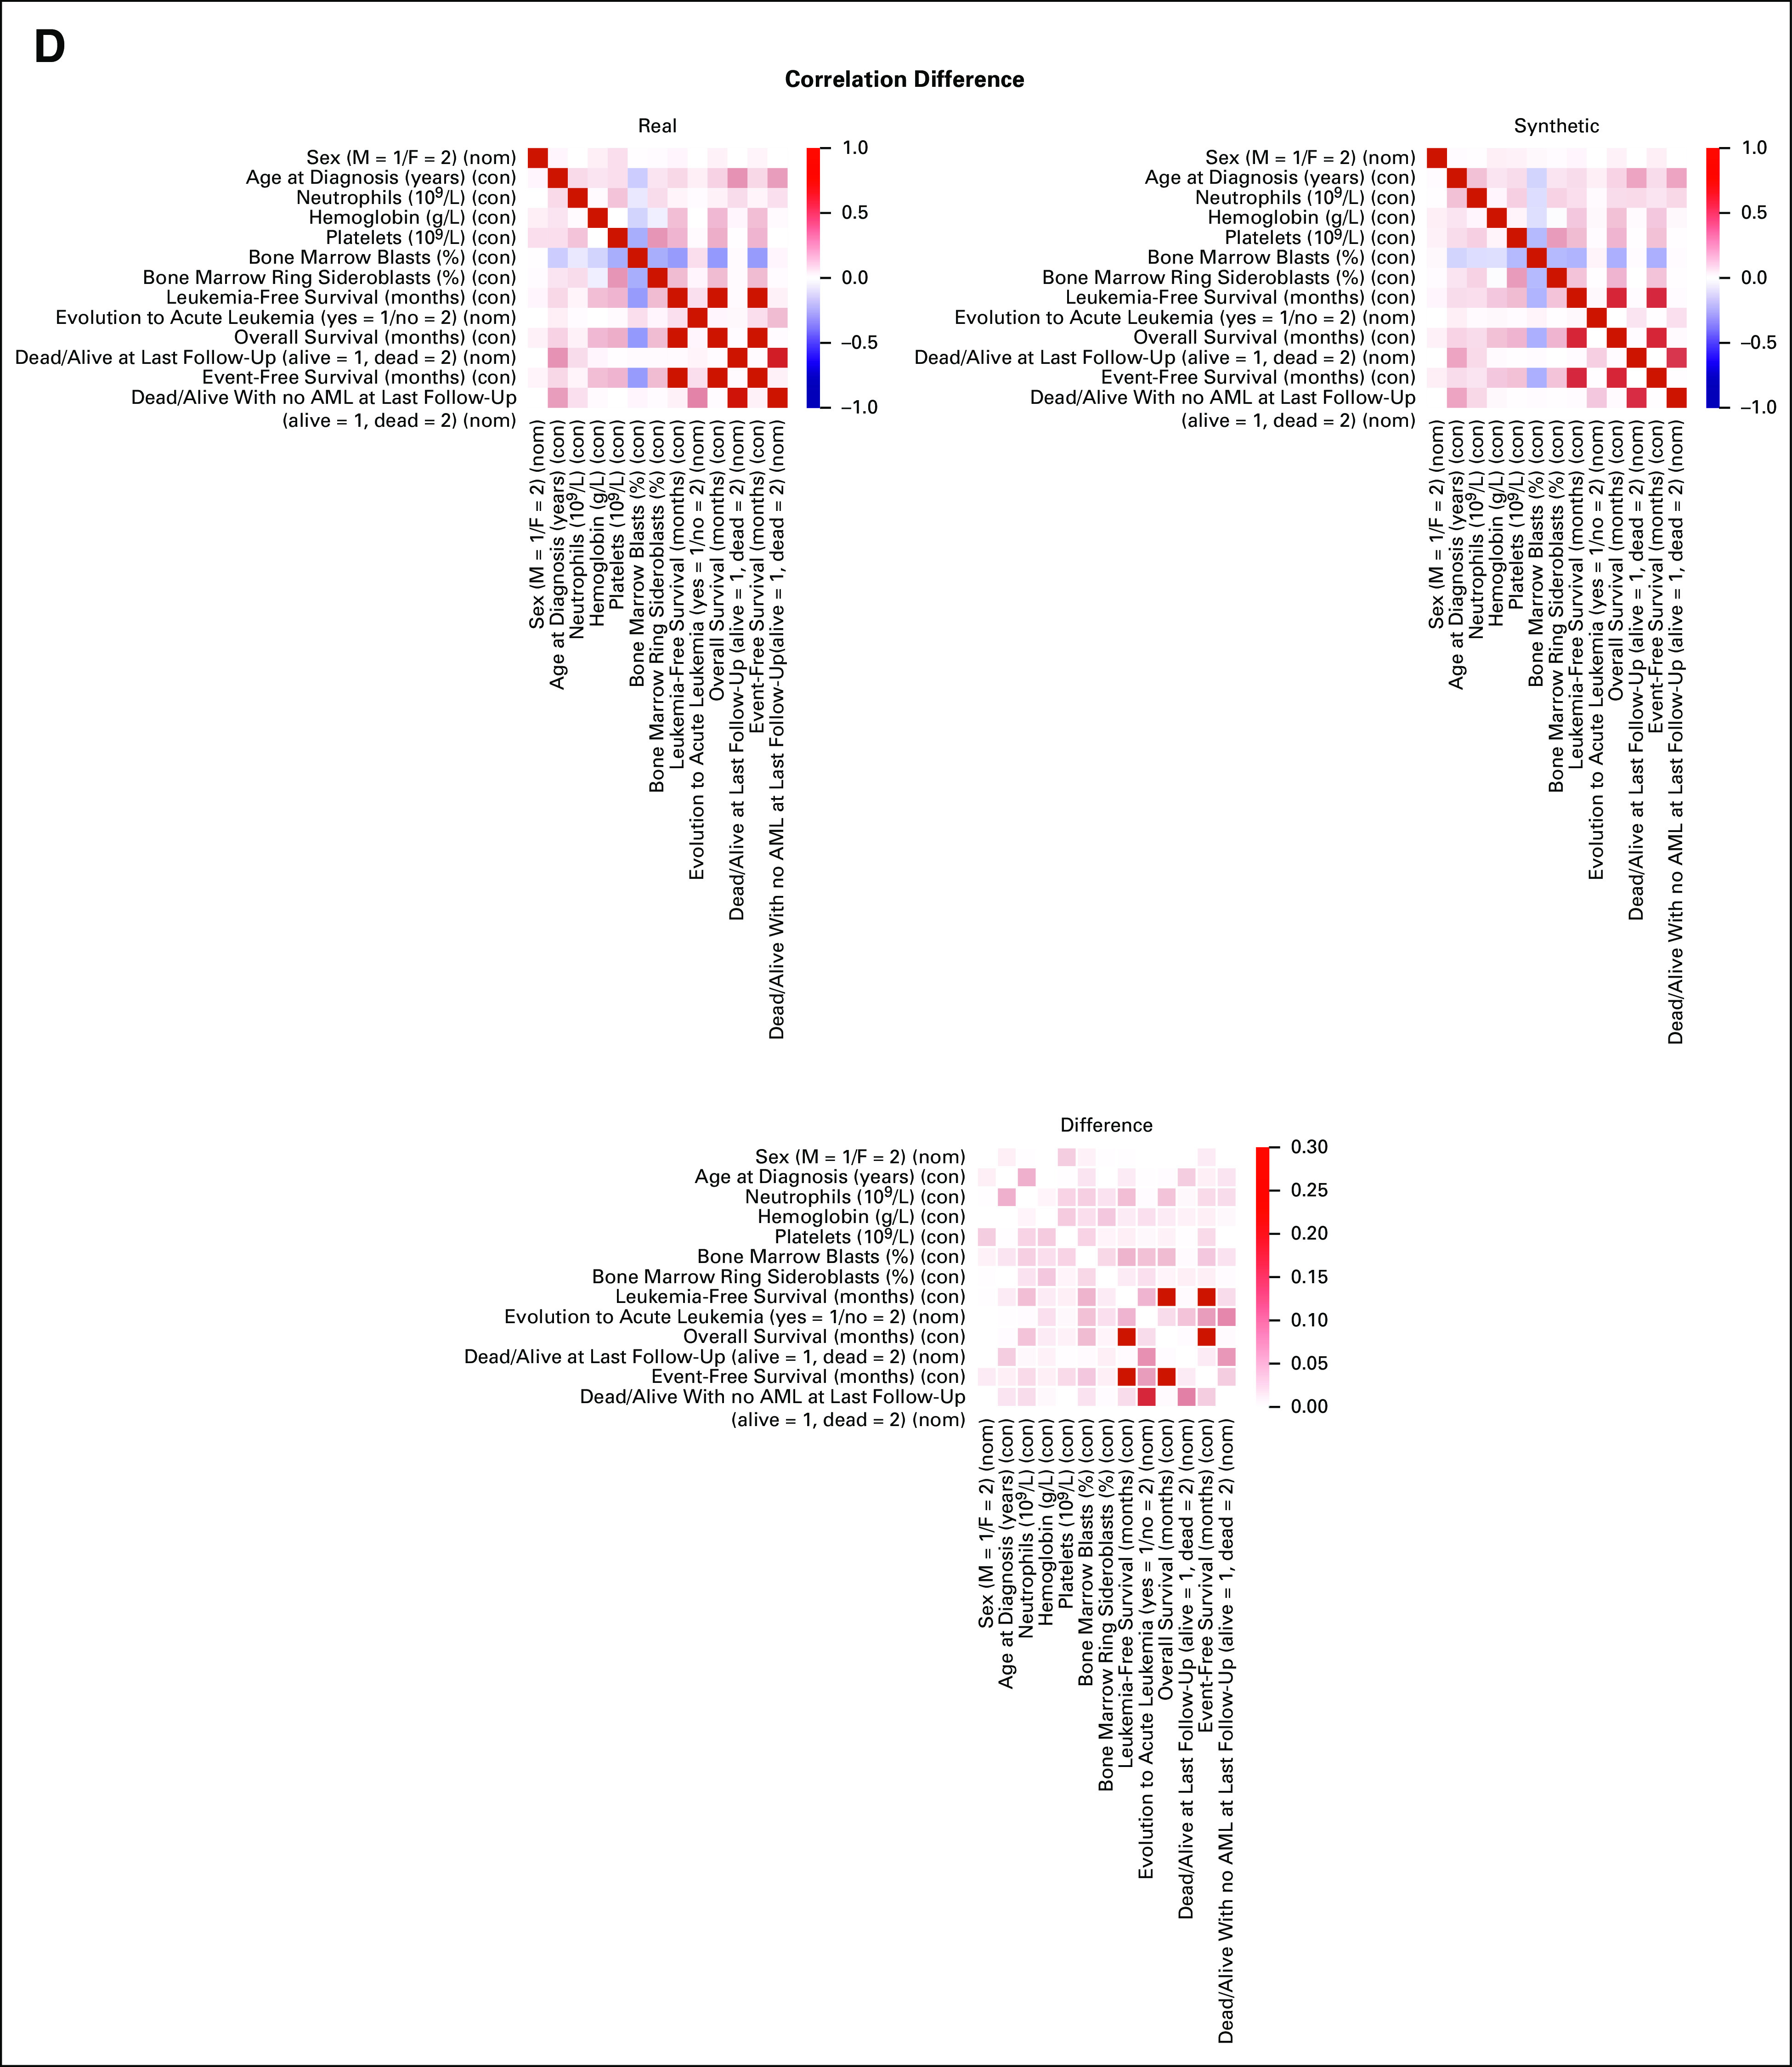
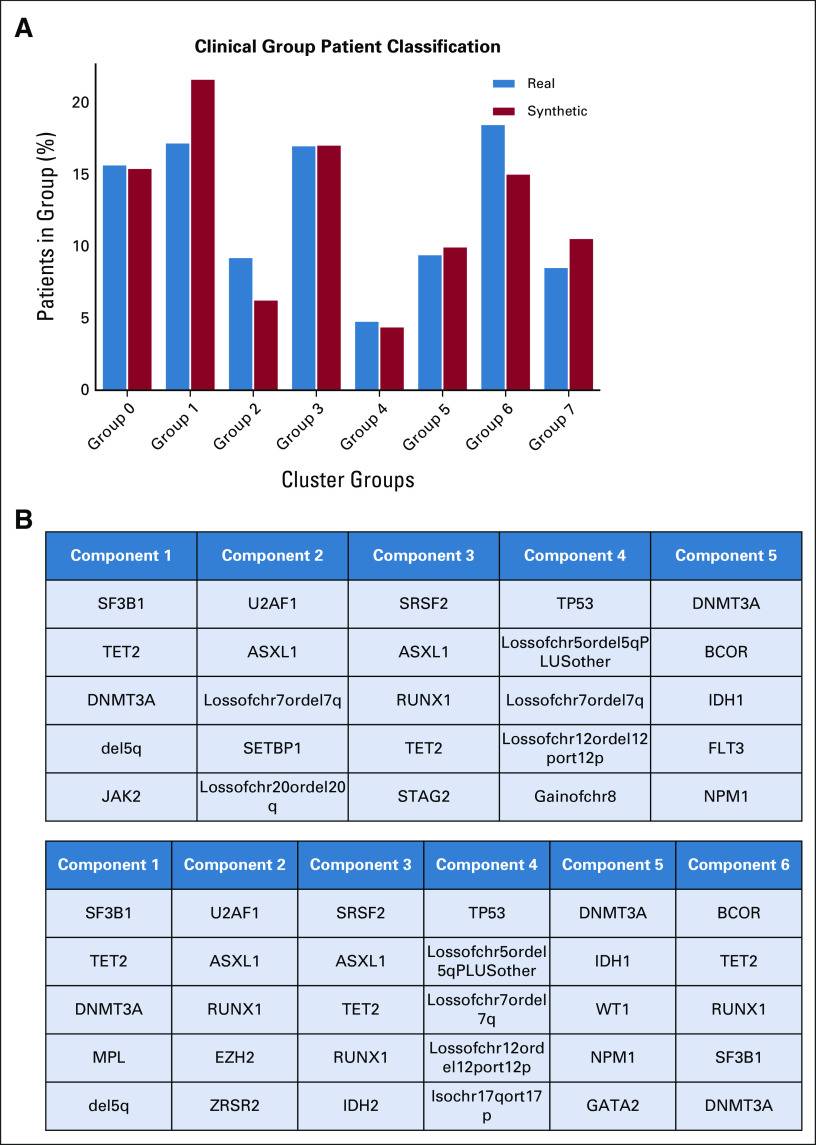
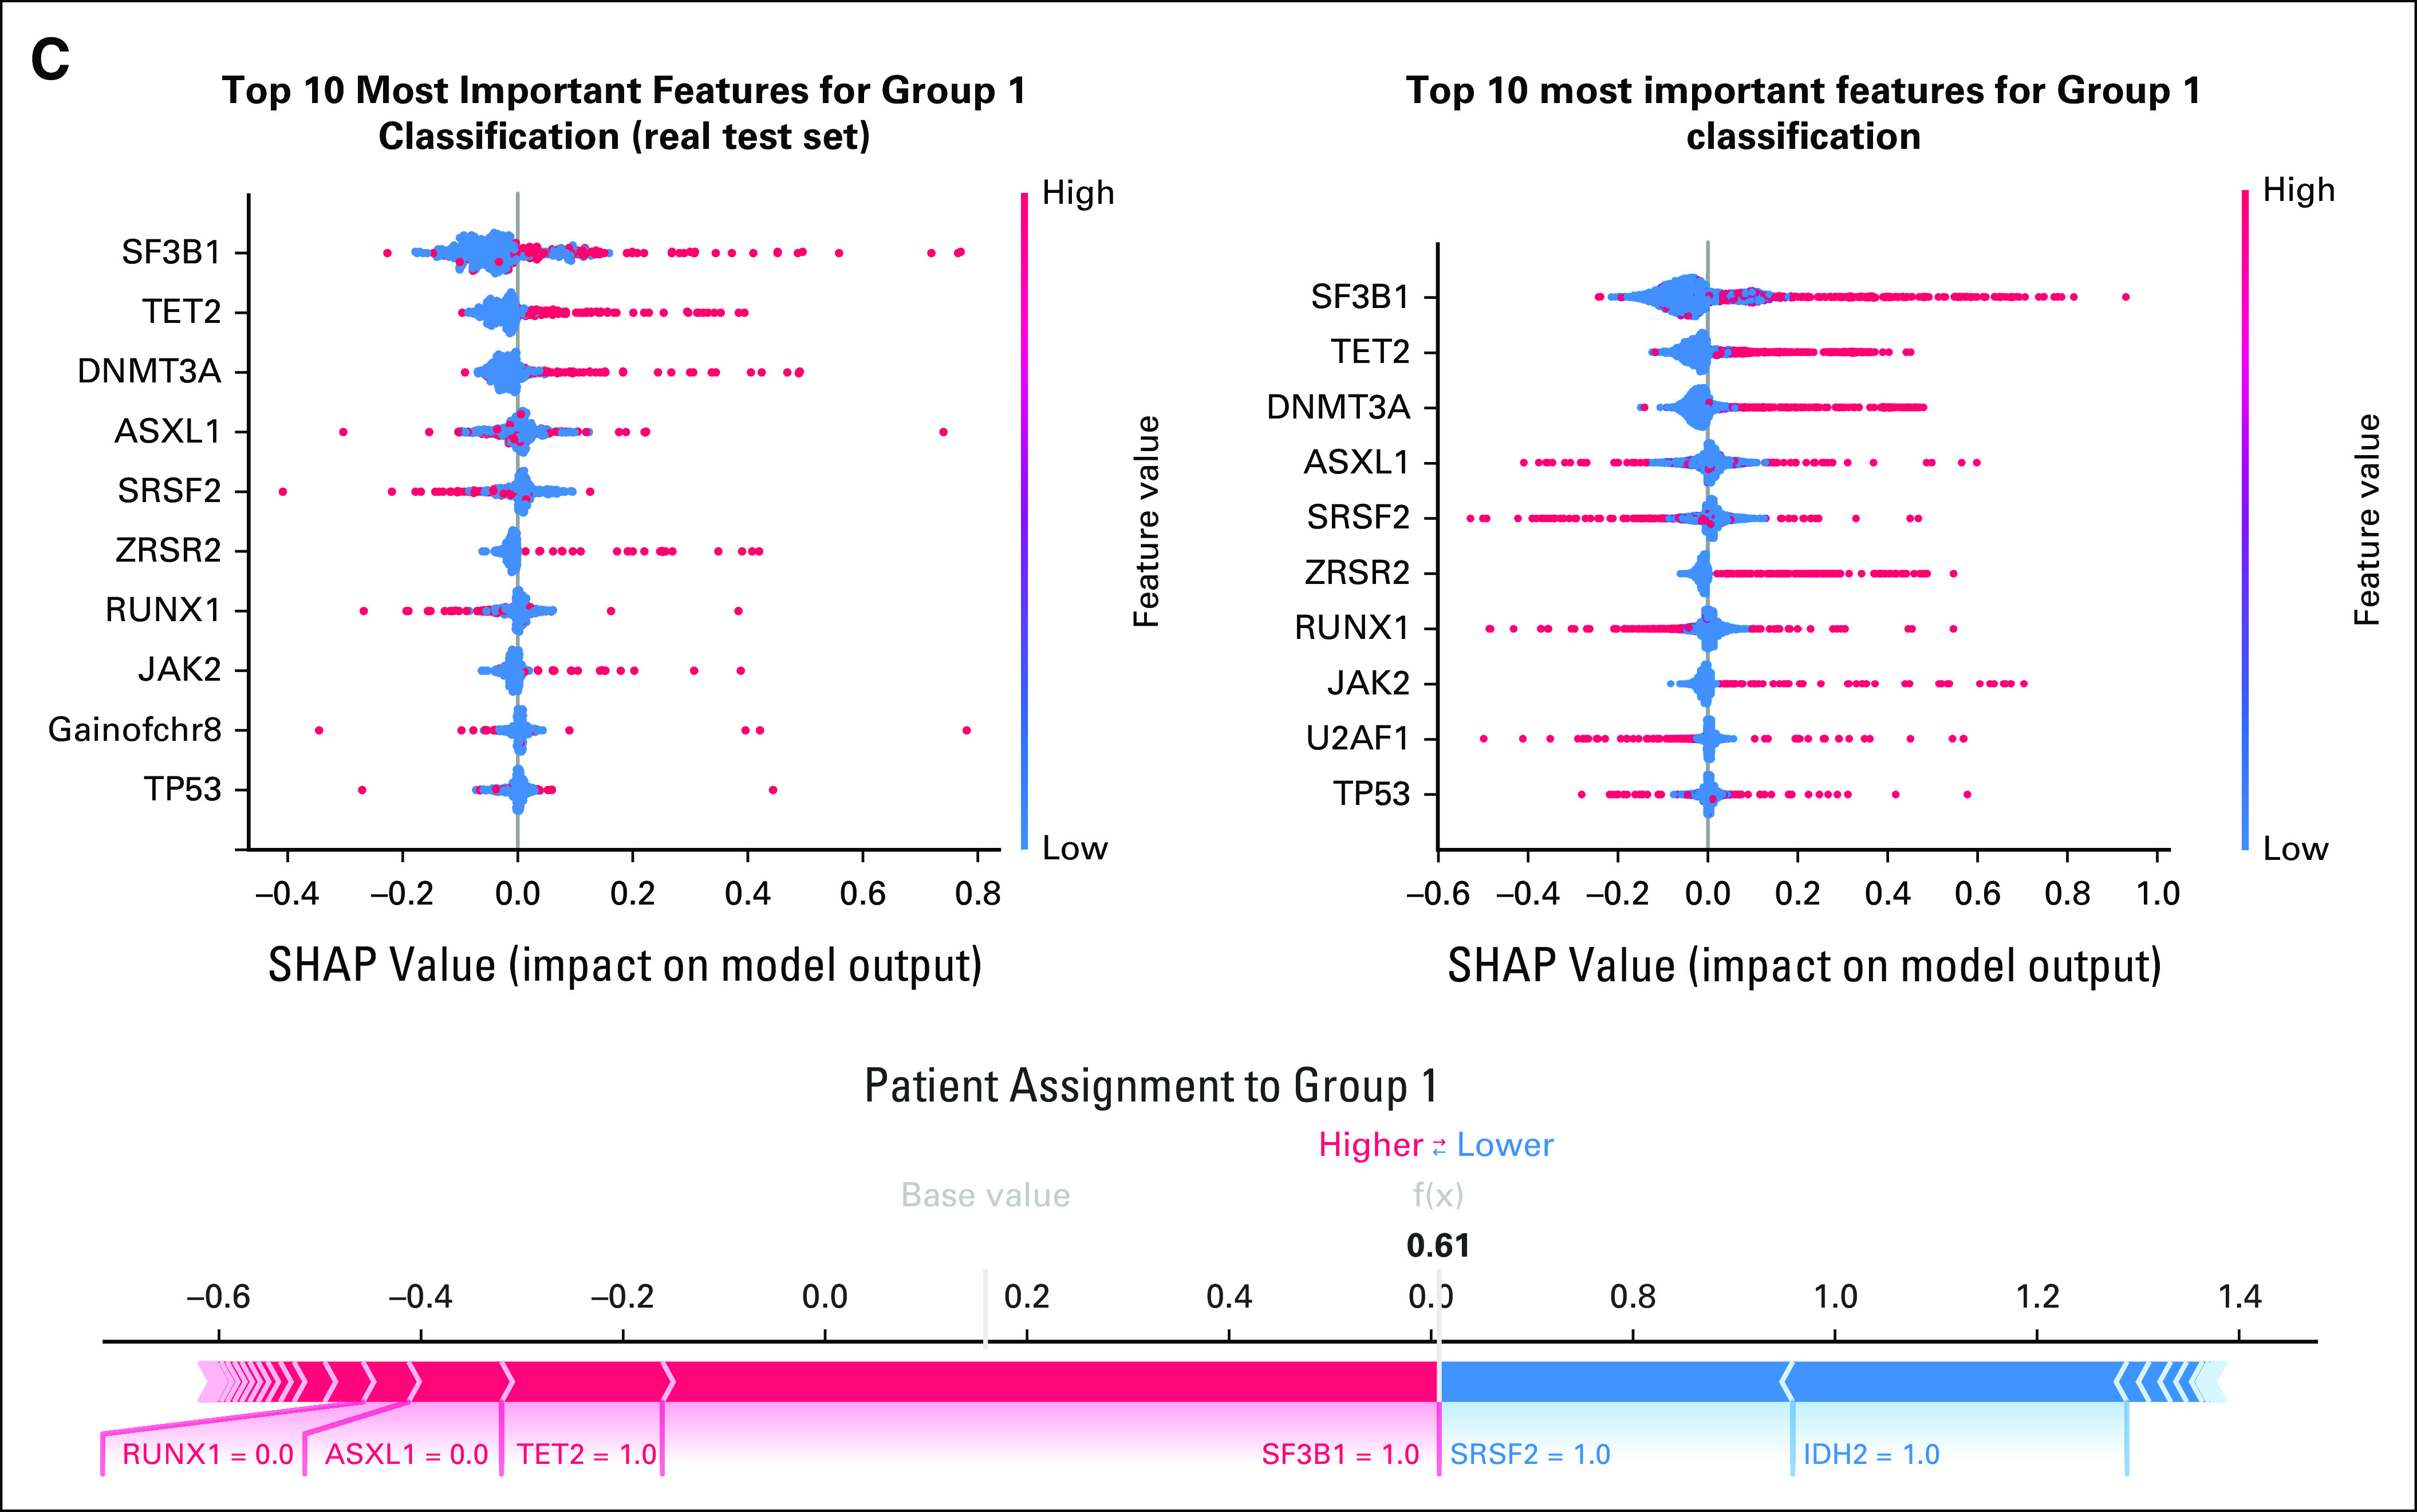
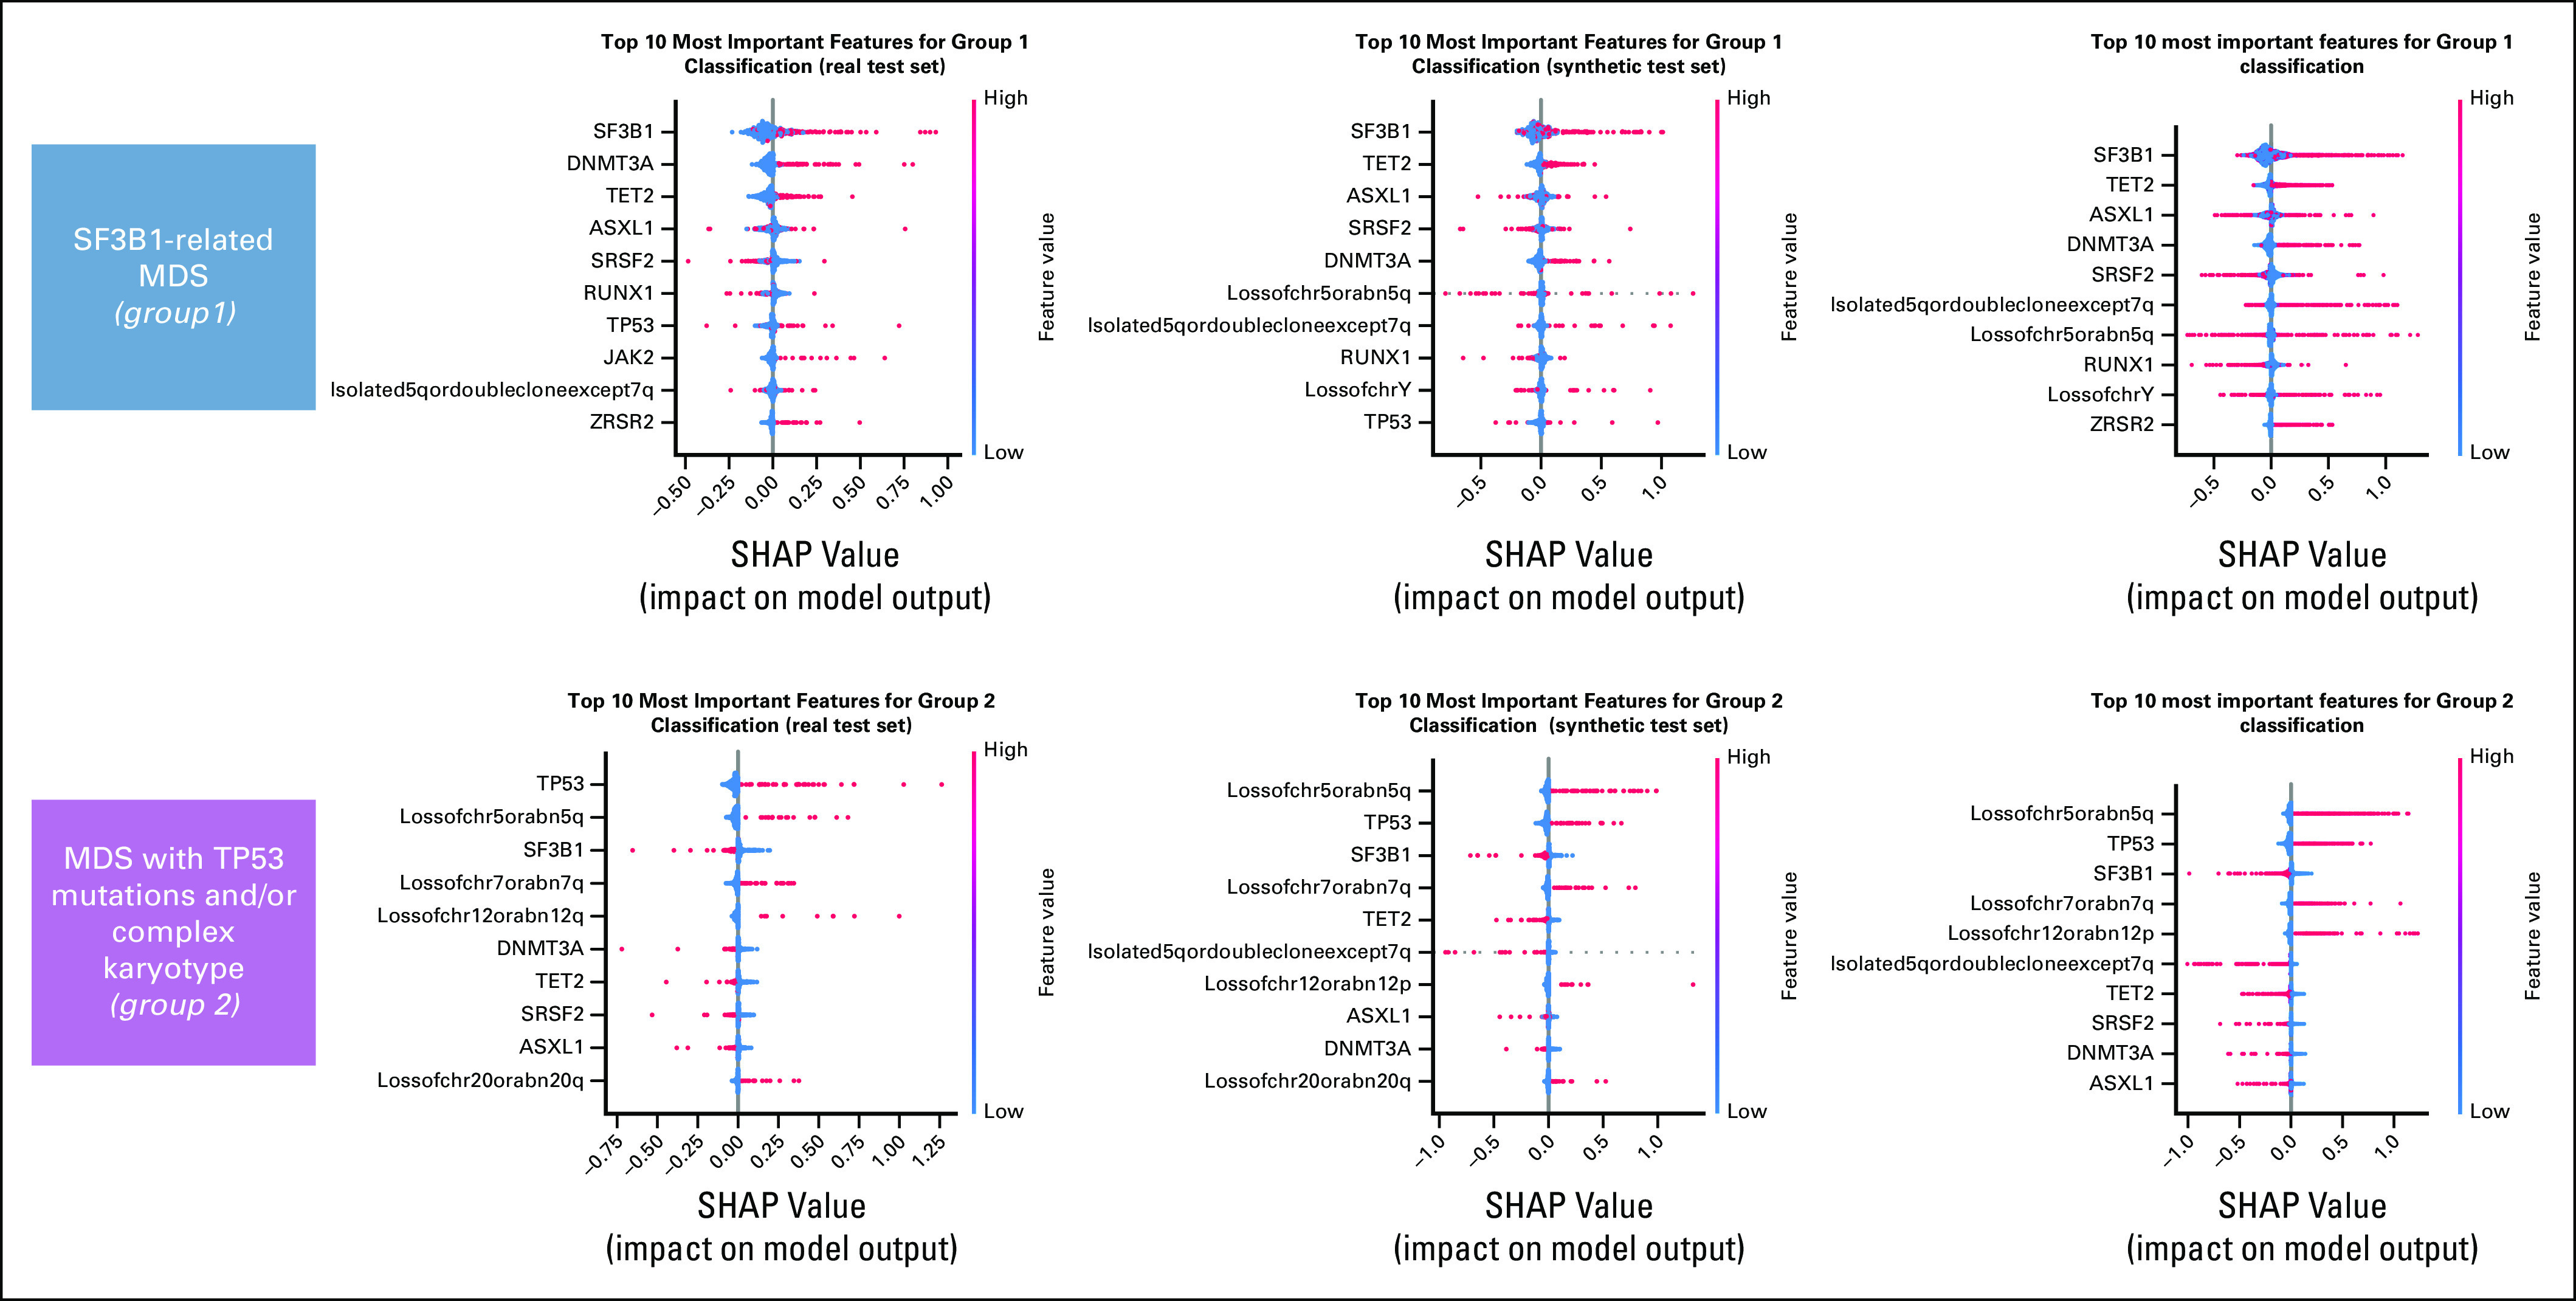
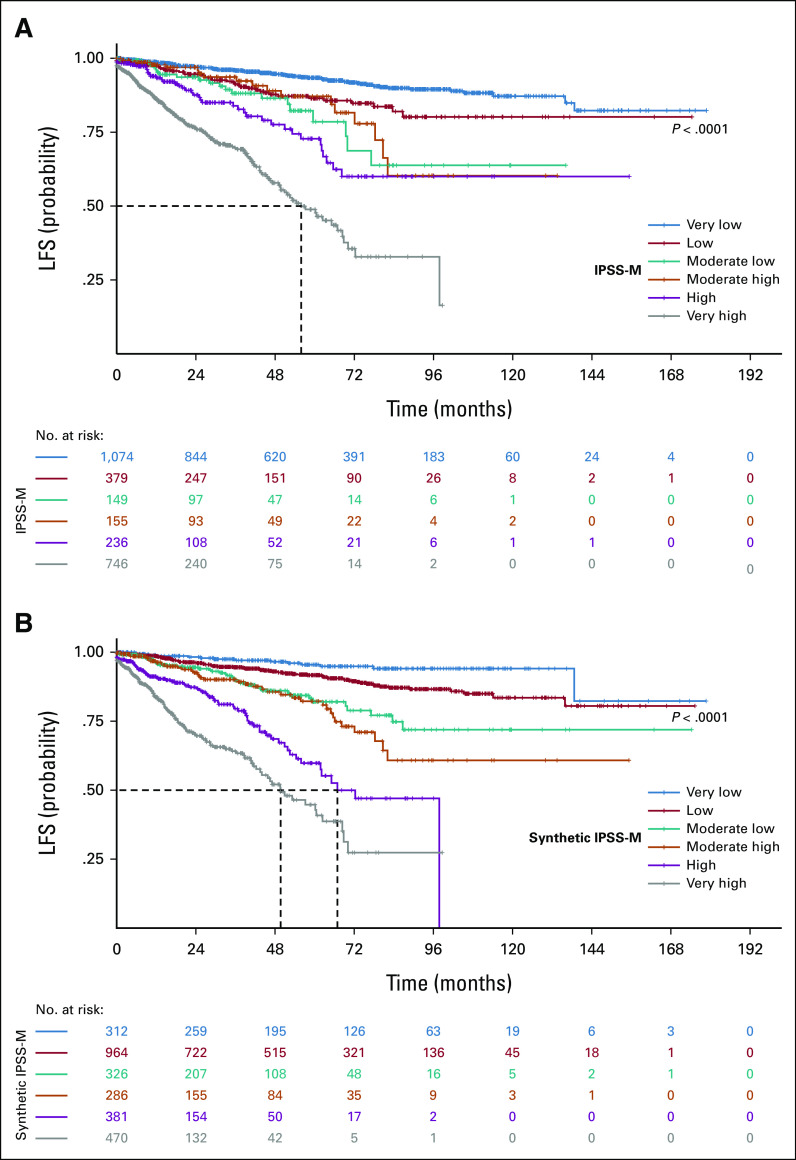
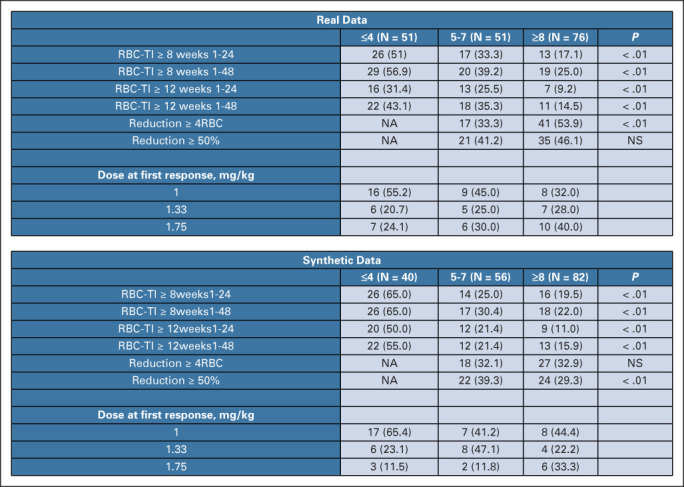
Results: We generated MDS/AML synthetic cohorts (including information on clinical features, genomics, treatment, and outcomes) with high fidelity and privacy performances. This technology allowed resolution of lack/incomplete information and data augmentation. We then assessed the potential value of synthetic data on accelerating research in hematology. Starting from 944 patients with MDS available since 2014, we generated a 300% augmented synthetic cohort and anticipated the development of molecular classification and molecular scoring system obtained many years later from 2,043 to 2,957 real patients, respectively. Moreover, starting from 187 MDS treated with luspatercept into a clinical trial, we generated a synthetic cohort that recapitulated all the clinical end points of the study. Finally, we developed a website to enable clinicians generating high-quality synthetic data from an existing biobank of real patients.

Conclusion: Synthetic data mimic real clinical-genomic features and outcomes, and anonymize patient information. The implementation of this technology allows to increase the scientific use and value of real data, thus accelerating precision medicine in hematology and the conduction of clinical trials.


Conflict of interest statement

The following represents disclosure information provided by authors of this manuscript. All relationships are considered compensated unless otherwise noted. Relationships are self-held unless noted. I = Immediate Family Member, Inst = My Institution. Relationships may not relate to the subject matter of this manuscript. For more information about ASCO's conflict of interest policy, please refer to www.asco.org/rwc or ascopubs.org/cci/author-center.

Open Payments is a public database containing information reported by companies about payments made to US-licensed physicians (Open Payments).

Antonio Russo

Travel, Accommodations, Expenses: Pfizer, Novartis

Armando Santoro

Consulting or Advisory Role: Bristol Myers Squibb, Servier, Gilead Sciences, Pfizer, Eisai, Bayer, MSD, Sanofi, Incyte

Speakers' Bureau: Takeda, Roche, AbbVie, Amgen, Celgene, AstraZeneca, Lilly, Sandoz, Novartis, BMS, Servier, Gilead Sciences, Pfizer, Eisai, Bayer, MSD

Iñigo Prada-Luengo

Stock and Other Ownership Interests: Novo Nordisk, BioNano Genomics, Lundbeck

Anders Krogh

Employment: AJ Vaccines

Valeria Santini

Honoraria: Celgene/Bristol Myers Squibb, Novartis

Consulting or Advisory Role: Celgene/Bristol Myers Squibb, Novartis, Menarini, Gilead Sciences, AbbVie, Syros Pharmaceuticals, Servier, Geron

Research Funding: Celgene (Inst)

Travel, Accommodations, Expenses: Janssen-Cilag, Celgene

Shahram Kordasti

Honoraria: Beckman Coulter, GWT-TUD, Alexion Pharmaceuticals

Consulting or Advisory Role: Syneos Health, Novartis, Pfizer

Speakers' Bureau: Pfizer

Research Funding: Celgene, Novartis, MorphoSys

Uwe Platzbecker

Honoraria: Celgene/Jazz, AbbVie, Curis, Geron, Janssen

Consulting or Advisory Role: Celgene/Jazz, Novartis, BMS GmbH & Co. KG

Research Funding: Amgen (Inst), Janssen (Inst), Novartis (Inst), BerGenBio (Inst), Celgene (Inst), Curis (Inst)

Patents, Royalties, Other Intellectual Property: Part of a patent for a TFR-2 antibody (Rauner et al Nature Metabolics 2019)

Travel, Accommodations, Expenses: Celgene

Maria Diez-Campelo

Honoraria: Celgene, Novartis

Consulting or Advisory Role: Celgene, Novartis, GlaxoSmithKline, Blueprint Medicines

Travel, Accommodations, Expenses: Gilead Sciences

Pierre Fenaux

Honoraria: Bristol Myers Squibb

Consulting or Advisory Role: Bristol Myers Squibb

Research Funding: Bristol Myers Squibb

Torsten Haferlach

Employment: MLL Munich Leukemia Laboratory

Leadership: MLL Munich Leukemia Laboratory

Consulting or Advisory Role: Illumina

No other potential conflicts of interest were reported.

Figures

FIG 1.
FIG 1.
Overview of experimental settings to validate synthetic data. Setting A: Create a synthetic reliable and private copy of the real data. Setting B: Assessment of generated patients, data augmentation, privacy preservability, and generalizability of the generative model across different clinical settings. Setting C: Accelerating translational research. Setting D: Accelerating clinical research and design/conduction of clinical trials. IPSS-M, Molecular International Prognostic Scoring System; MDS, myelodysplastic syndromes.
FIG 2.
FIG 2.
SVF on synthetic MDS cohort (N = 2,043), as performed in setting A. (A) Distributions for clinical, demographic, and survival features. Blue illustrates the real data, while red illustrates the synthetic data. (B) Frequency of recurrently mutated genes and chromosomal abnormalities. (C) Pairwise association among genes and/or cytogenetics abnormalities. In the upper triangle, for each couple of genomic abnormalities, the numbers of patients showing mutation co-occurrences are illustrated using a blue and white color scale. In the lower triangle, the gene-gene co-occurrence and mutual exclusivity is assessed using odds ratio, illustrated using a green and yellow color scale according to odds ratio values. All results in (A), (B), and (C) are referring to one MDS synthetic data set of 2,043 patients generated. Detailed results are reported in the Data Supplement. (D) Synthetic data fidelity calculated by SVF on clinical, demographic, and genomic features and patient survival. Average over three training and sampling replications on MDS cohort of 2,043 patients. MDS, myelodysplastic syndromes; SVF, synthetic validation framework.
FIG 2.
FIG 2.
SVF on synthetic MDS cohort (N = 2,043), as performed in setting A. (A) Distributions for clinical, demographic, and survival features. Blue illustrates the real data, while red illustrates the synthetic data. (B) Frequency of recurrently mutated genes and chromosomal abnormalities. (C) Pairwise association among genes and/or cytogenetics abnormalities. In the upper triangle, for each couple of genomic abnormalities, the numbers of patients showing mutation co-occurrences are illustrated using a blue and white color scale. In the lower triangle, the gene-gene co-occurrence and mutual exclusivity is assessed using odds ratio, illustrated using a green and yellow color scale according to odds ratio values. All results in (A), (B), and (C) are referring to one MDS synthetic data set of 2,043 patients generated. Detailed results are reported in the Data Supplement. (D) Synthetic data fidelity calculated by SVF on clinical, demographic, and genomic features and patient survival. Average over three training and sampling replications on MDS cohort of 2,043 patients. MDS, myelodysplastic syndromes; SVF, synthetic validation framework.
FIG 3.
FIG 3.
Patient classification and survival analysis on the synthetic MDS cohort (N = 2,043), as performed in setting A. (A) Kaplan-Meier survival probability curves obtained from the real (left) and synthetic (right) populations, stratified according to IPSS-R risk categories. The P values of the log-rank test are calculated, confirming the hypothesis of no difference in survival probabilities between real and synthetic patients for every IPSS-R risk group. (B) Partial concordance and standard error for each category of variables obtained from the mixed-effect CoxPH models fitted on the real and synthetic cohorts. CNA, copy number alteration; IPSS-R, Revised International Prognostic Scoring System; MDS, myelodysplastic syndromes.
FIG 4.
FIG 4.
Definition of a molecular classification on augmented synthetic MDS cohort starting from 944 patients available in 2014, as performed in setting C. (A) Evaluation of the real (blue) and synthetic (red) patients' distribution considering genomic groups classification. (B) Genomic group definition according to Bersanelli et al. (C) SHAP summary plot analysis on the top 10 most important features for a real test set, a synthetic test set, and a complete augmented synthetic data set for the genomic group 6. Below is the force plot showing the importance of the most relevant features in assigning a synthetic patient to genomic group 2. MDS, myelodysplastic syndromes; SHAP, Shapley Additive Explanations.
FIG 5.
FIG 5.
Survival analysis on synthetic molecular prognostic score generated (synthetic IPSS-M) performed in setting C. (A) Kaplan-Meier probability estimates of OS for synthetic patients with MDS are represented and stratified by IPSS-M risk categories as defined by Bernard et al. P value is from log-rank test. (B) Kaplan-Meier probability estimates of OS for synthetic patients with MDS are represented and stratified by synthetic IPSS-M risk categories. P value is from log-rank test. (C) Percentage of patients in each IPSS-M risk category (both synthetic and original) with the HRs for each outcome, and the median survival for each patient class, where values could be calculated. HR, hazard ratio; IPSS-M, Molecular International Prognostic Scoring System; LFS, leukemia-free survival; MDS, myelodysplastic syndromes; OS, overall survival.
FIG 6.
FIG 6.
Comparison of clinical trial end points between real and synthetic patients, as performed in setting D. (A) Kaplan-Meier survival probability curves compared for real and synthetic patients' overall survival. (B) Kaplan-Meier curves of longest transfusion independence period for real and synthetic patients. The P values of the log-rank test are calculated, confirming the hypothesis of no difference in survival probabilities between real and synthetic cohorts. (C) Study end point comparison between real and synthetic cohorts. RBC-TI, rate of red blood cell transfusion independence.
FIG A1.
FIG A1.
SVF on synthetic MDS cohort (N = 2,043), as performed in setting A. (A) Distributions of the patients according to the number of recurrently mutated genes and chromosomal abnormalities. (B) Evaluation of the real (blue) and synthetic (red) patients' distribution considering WHO 2016 classification and IPSS-R risk value. (C) PCA for clinical, demographic, and survival features. (D) Correlation matrices for clinical, demographic, and survival features, indicating the interdependencies per column on real and synthetic data sets. All results are referring to one MDS synthetic data set of 2,043 patients generated. Detailed results are reported in the Data Supplement. IPSS-R, Revised International Prognostic Scoring System; MDS, myelodysplastic syndromes; PCA, principal component analysis; SVF, synthetic validation framework.
FIG A1.
FIG A1.
SVF on synthetic MDS cohort (N = 2,043), as performed in setting A. (A) Distributions of the patients according to the number of recurrently mutated genes and chromosomal abnormalities. (B) Evaluation of the real (blue) and synthetic (red) patients' distribution considering WHO 2016 classification and IPSS-R risk value. (C) PCA for clinical, demographic, and survival features. (D) Correlation matrices for clinical, demographic, and survival features, indicating the interdependencies per column on real and synthetic data sets. All results are referring to one MDS synthetic data set of 2,043 patients generated. Detailed results are reported in the Data Supplement. IPSS-R, Revised International Prognostic Scoring System; MDS, myelodysplastic syndromes; PCA, principal component analysis; SVF, synthetic validation framework.
FIG A2.
FIG A2.
Patient classification and survival analysis on synthetic MDS cohort (N = 2,043), as performed in setting A. (A) Evaluation of the real (blue) and synthetic (red) patients' distribution considering clinical groups. Patient assignment was made by using a multiclass classifier (MLP) trained on the clinical groups identified in the EuroMDS cohort. (B) Components from the Dirichlet process on real data (above) and for the synthetic ones (below). Only the top five anomalies have been reported per cluster, decreasingly sorted by importance. (C) SHAP summary plot analysis on the top 10 most important features for real (left) and synthetic (right) for the genomic group defined as MDS with SF3B1 mutation. Below is the force plot showing the features importance in assigning a synthetic patient to this genomic group. MDS, myelodysplastic syndromes; MLP, multilayer perceptron; SHAP, Shapley Additive Explanations.
FIG A2.
FIG A2.
Patient classification and survival analysis on synthetic MDS cohort (N = 2,043), as performed in setting A. (A) Evaluation of the real (blue) and synthetic (red) patients' distribution considering clinical groups. Patient assignment was made by using a multiclass classifier (MLP) trained on the clinical groups identified in the EuroMDS cohort. (B) Components from the Dirichlet process on real data (above) and for the synthetic ones (below). Only the top five anomalies have been reported per cluster, decreasingly sorted by importance. (C) SHAP summary plot analysis on the top 10 most important features for real (left) and synthetic (right) for the genomic group defined as MDS with SF3B1 mutation. Below is the force plot showing the features importance in assigning a synthetic patient to this genomic group. MDS, myelodysplastic syndromes; MLP, multilayer perceptron; SHAP, Shapley Additive Explanations.
FIG A3.
FIG A3.
Definition of a molecular classification on augmented synthetic MDS cohort starting from 944 patients available in 2014, as performed in setting C. SHAP summary plot analysis on the top 10 most important features for a real test set, a synthetic test set, and a complete augmented synthetic data set for the genomic groups 1 and 2. MDS, myelodysplastic syndromes; SHAP, Shapley Additive Explanations.
FIG A4.
FIG A4.
Survival analysis on synthetic molecular prognostic score generated (synthetic IPSS-M) performed in setting C. (A) Kaplan-Meier probability estimates of LFS for synthetic MDS patients are represented and stratified by IPSS-M risk categories as defined by Bernard et al. P value is from log-rank test. (B) Kaplan-Meier probability estimates of LFS for synthetic MDS patients are represented and stratified by synthetic IPSS-M risk categories. P value is from log-rank test. IPSS-M, Molecular International Prognostic Scoring System; LFS, leukemia-free survival; MDS, myelodysplastic syndromes.
FIG A5.
FIG A5.
Comparison of clinical trial end points between real and synthetic patients, as performed in setting D. Response rate and dose at first response, stratified by baseline transfusion burden, in both real and synthetic cohorts. RBC-TI, rate of red blood cell transfusion independence.

References

    1. Collins FS, Varmus H: A new initiative on precision medicine. N Engl J Med 372:793-795, 2015 - PMC - PubMed
    1. Obermeyer Z, Emanuel EJ: Predicting the future—Big data, machine learning, and clinical medicine. N Engl J Med 375:1216-1219, 2016 - PMC - PubMed
    1. Pencina MJ, Goldstein BA, D'Agostino RB: Prediction models—Development, evaluation, and clinical application. N Engl J Med 382:1583-1586, 2020 - PubMed
    1. Bhinder B, Gilvary C, Madhukar NS, et al. : Artificial intelligence in cancer research and precision medicine. Cancer Discov 11:900-915, 2021 - PMC - PubMed
    1. Finlayson SG, Subbaswamy A, Singh K, et al. : The clinician and dataset shift in artificial intelligence. N Engl J Med 385:283-286, 2021 - PMC - PubMed

Publication types