. 2023 Jul 20;83(14):2540-2558.e12.
doi: 10.1016/j.molcel.2023.06.006. Epub 2023 Jun 29.

Fine-tuning GPCR-mediated neuromodulation by biasing signaling through different G protein subunits

Affiliations

Fine-tuning GPCR-mediated neuromodulation by biasing signaling through different G protein subunits

Jong-Chan Park et al. Mol Cell. .

Abstract

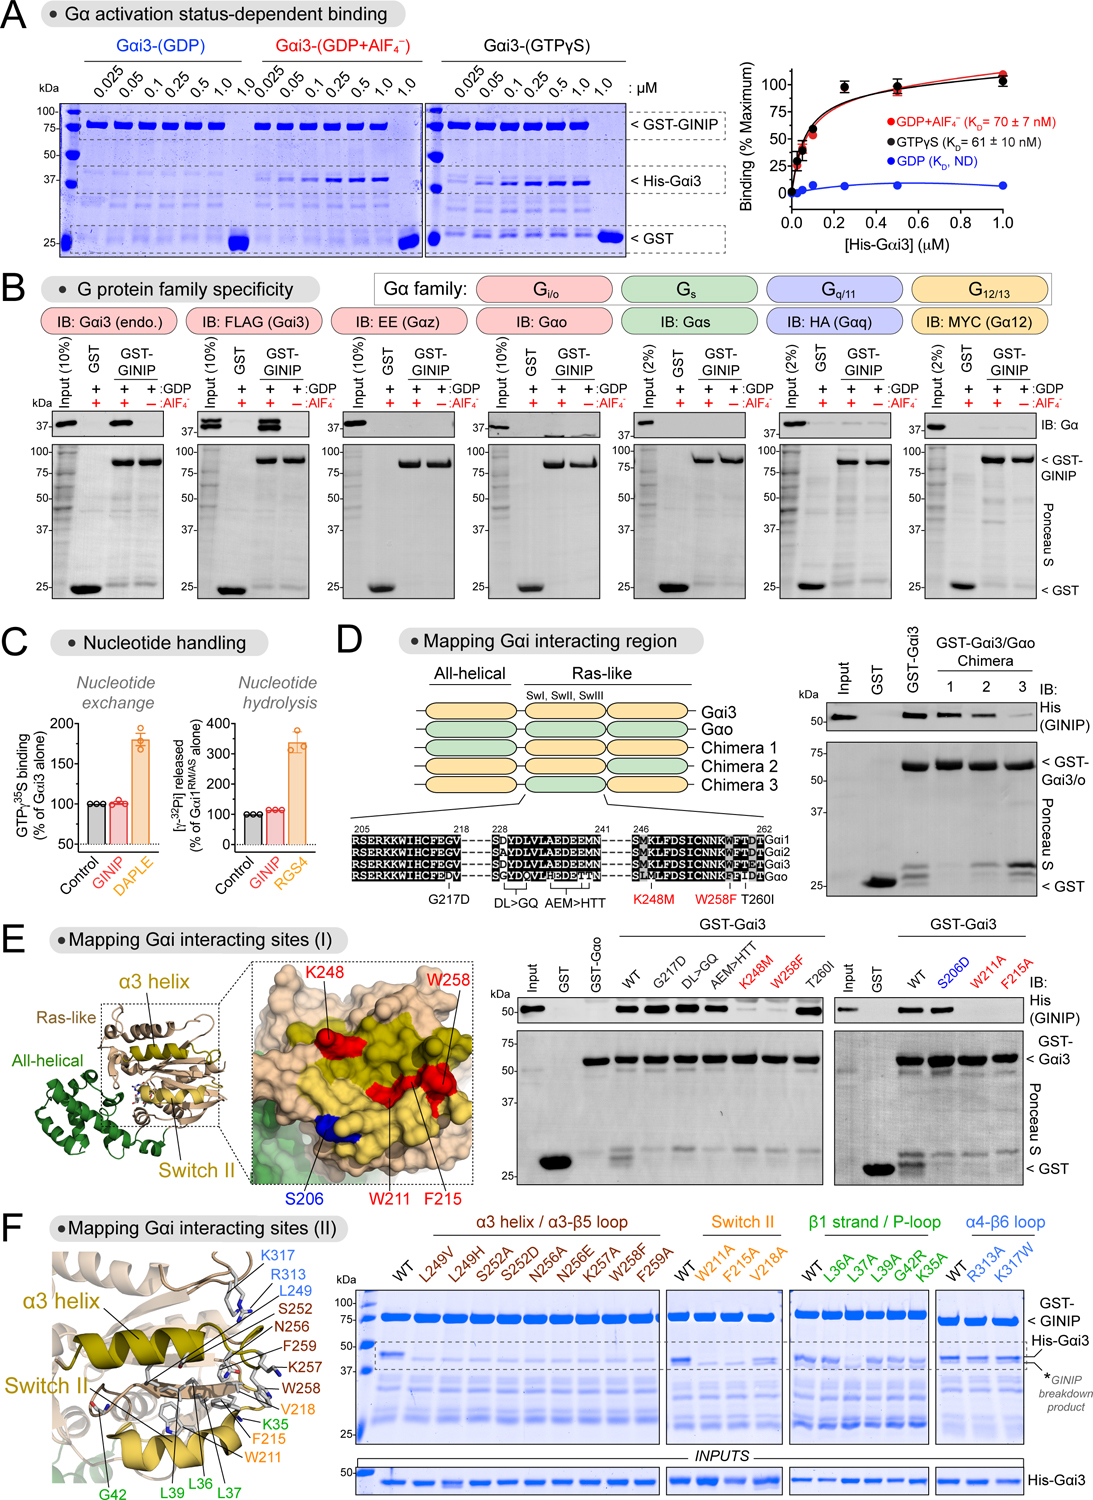
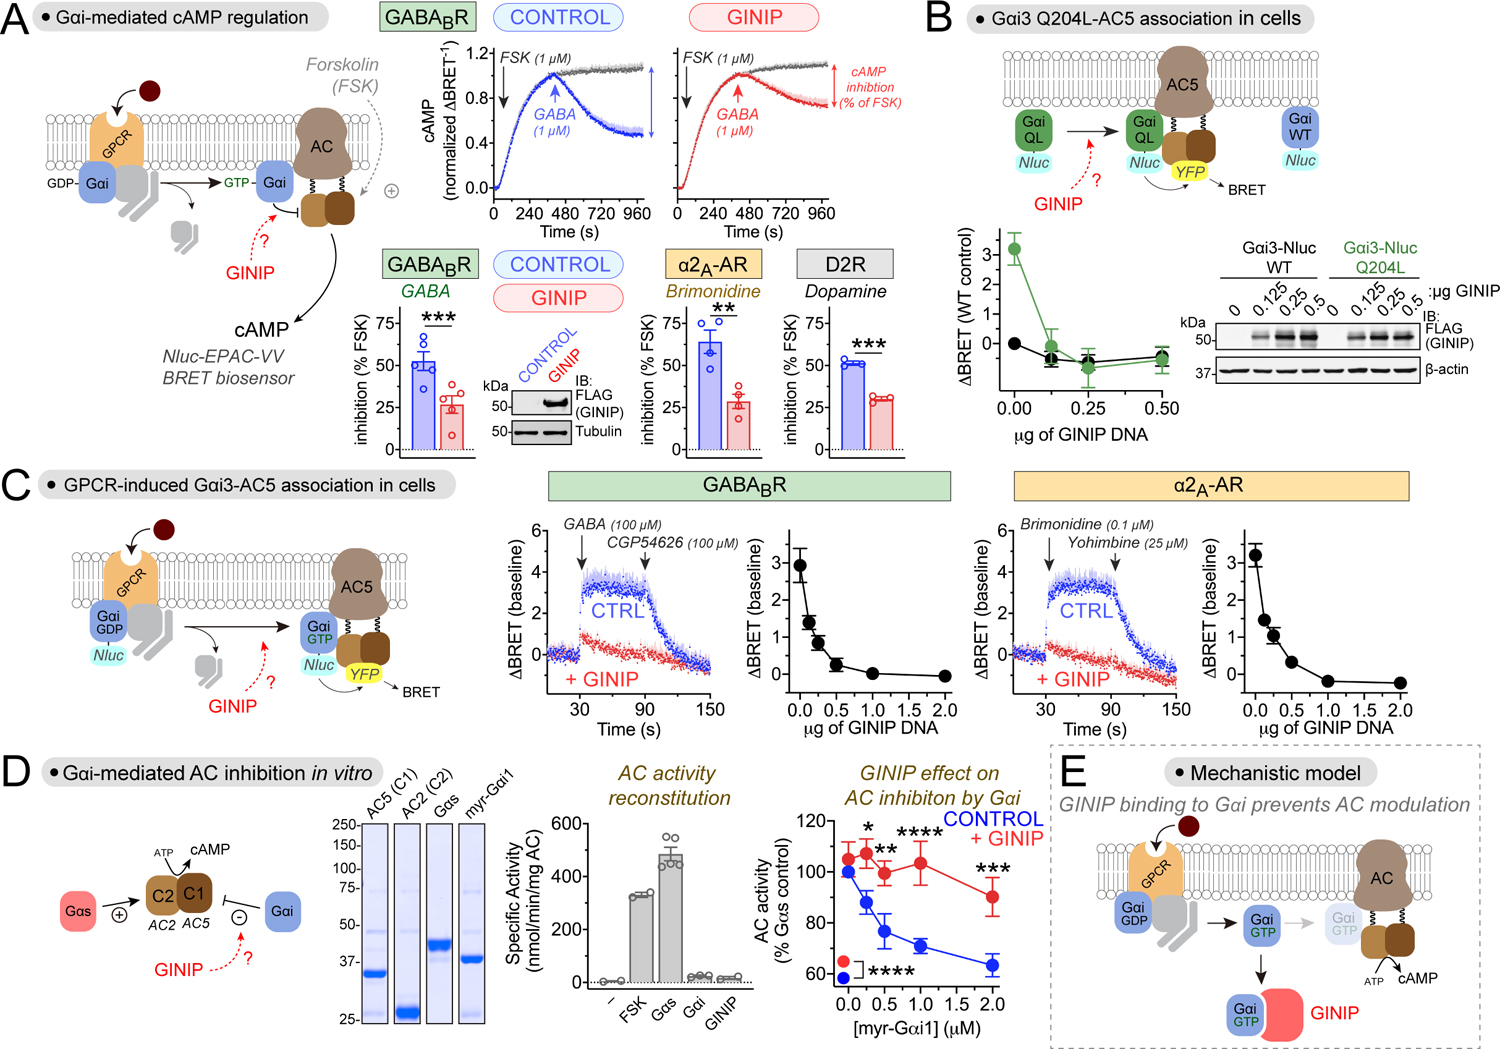
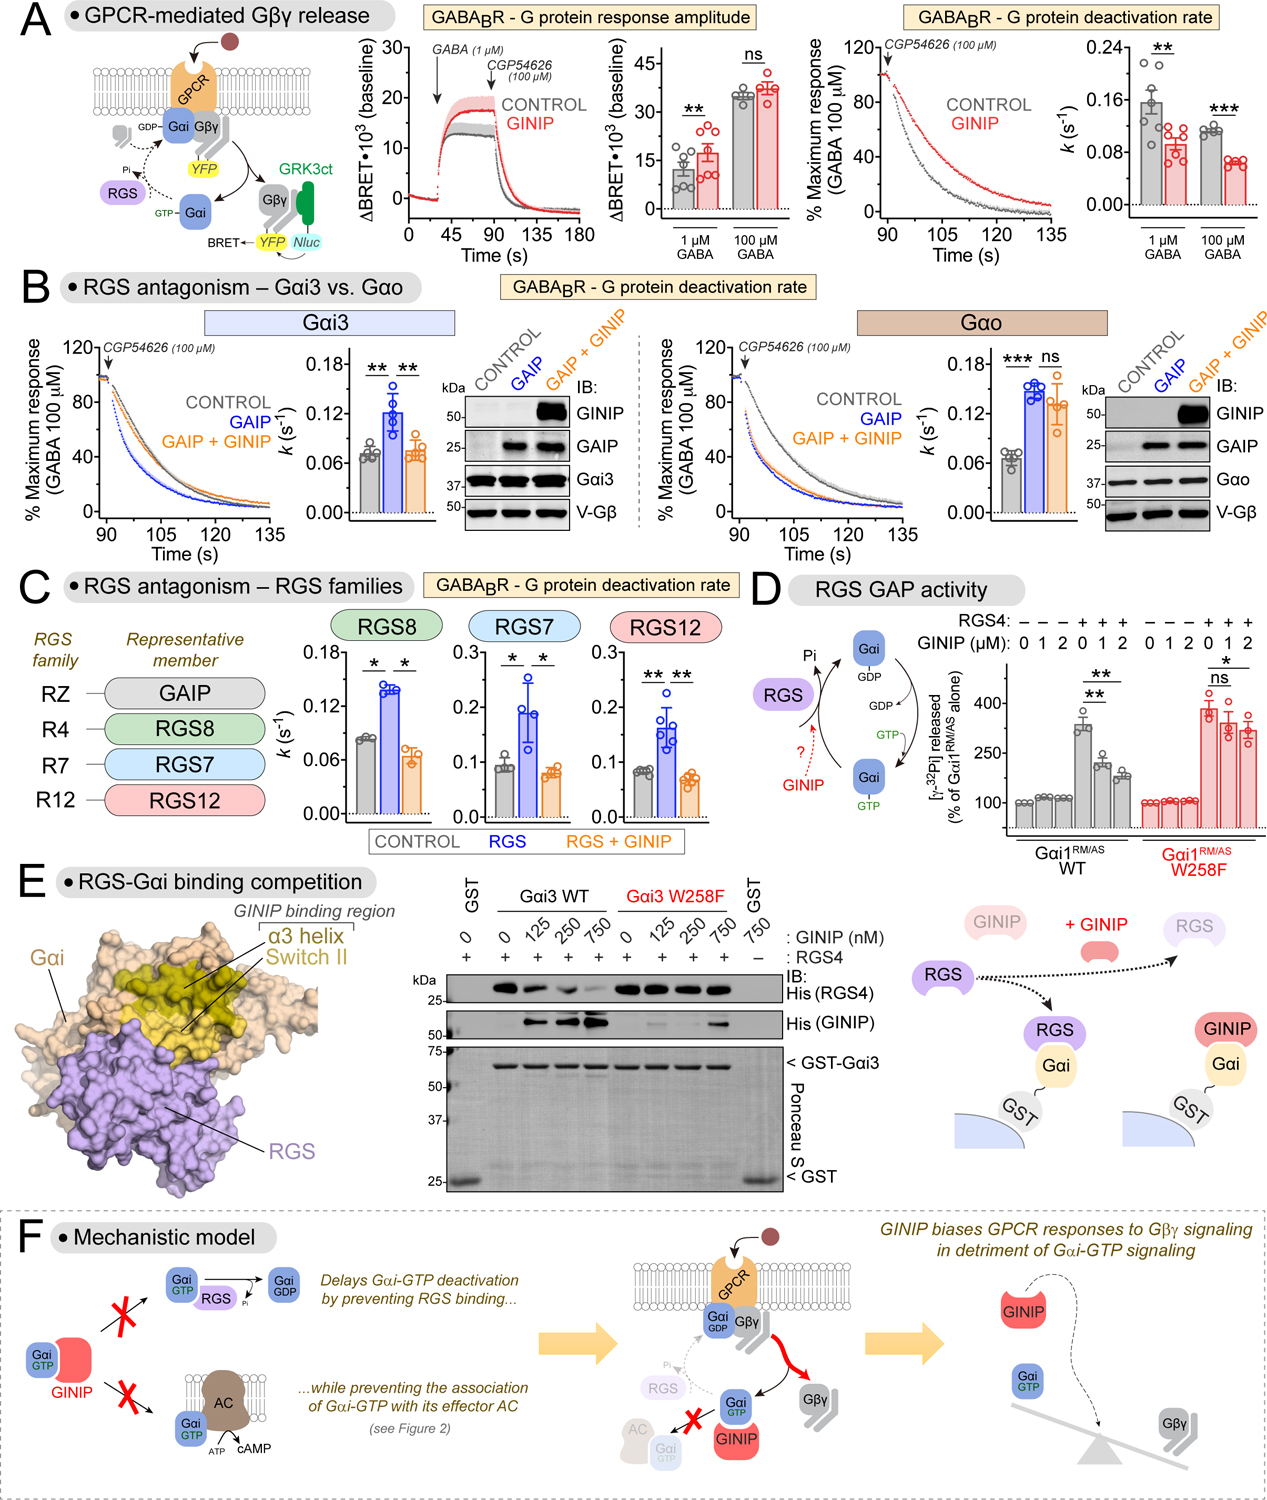
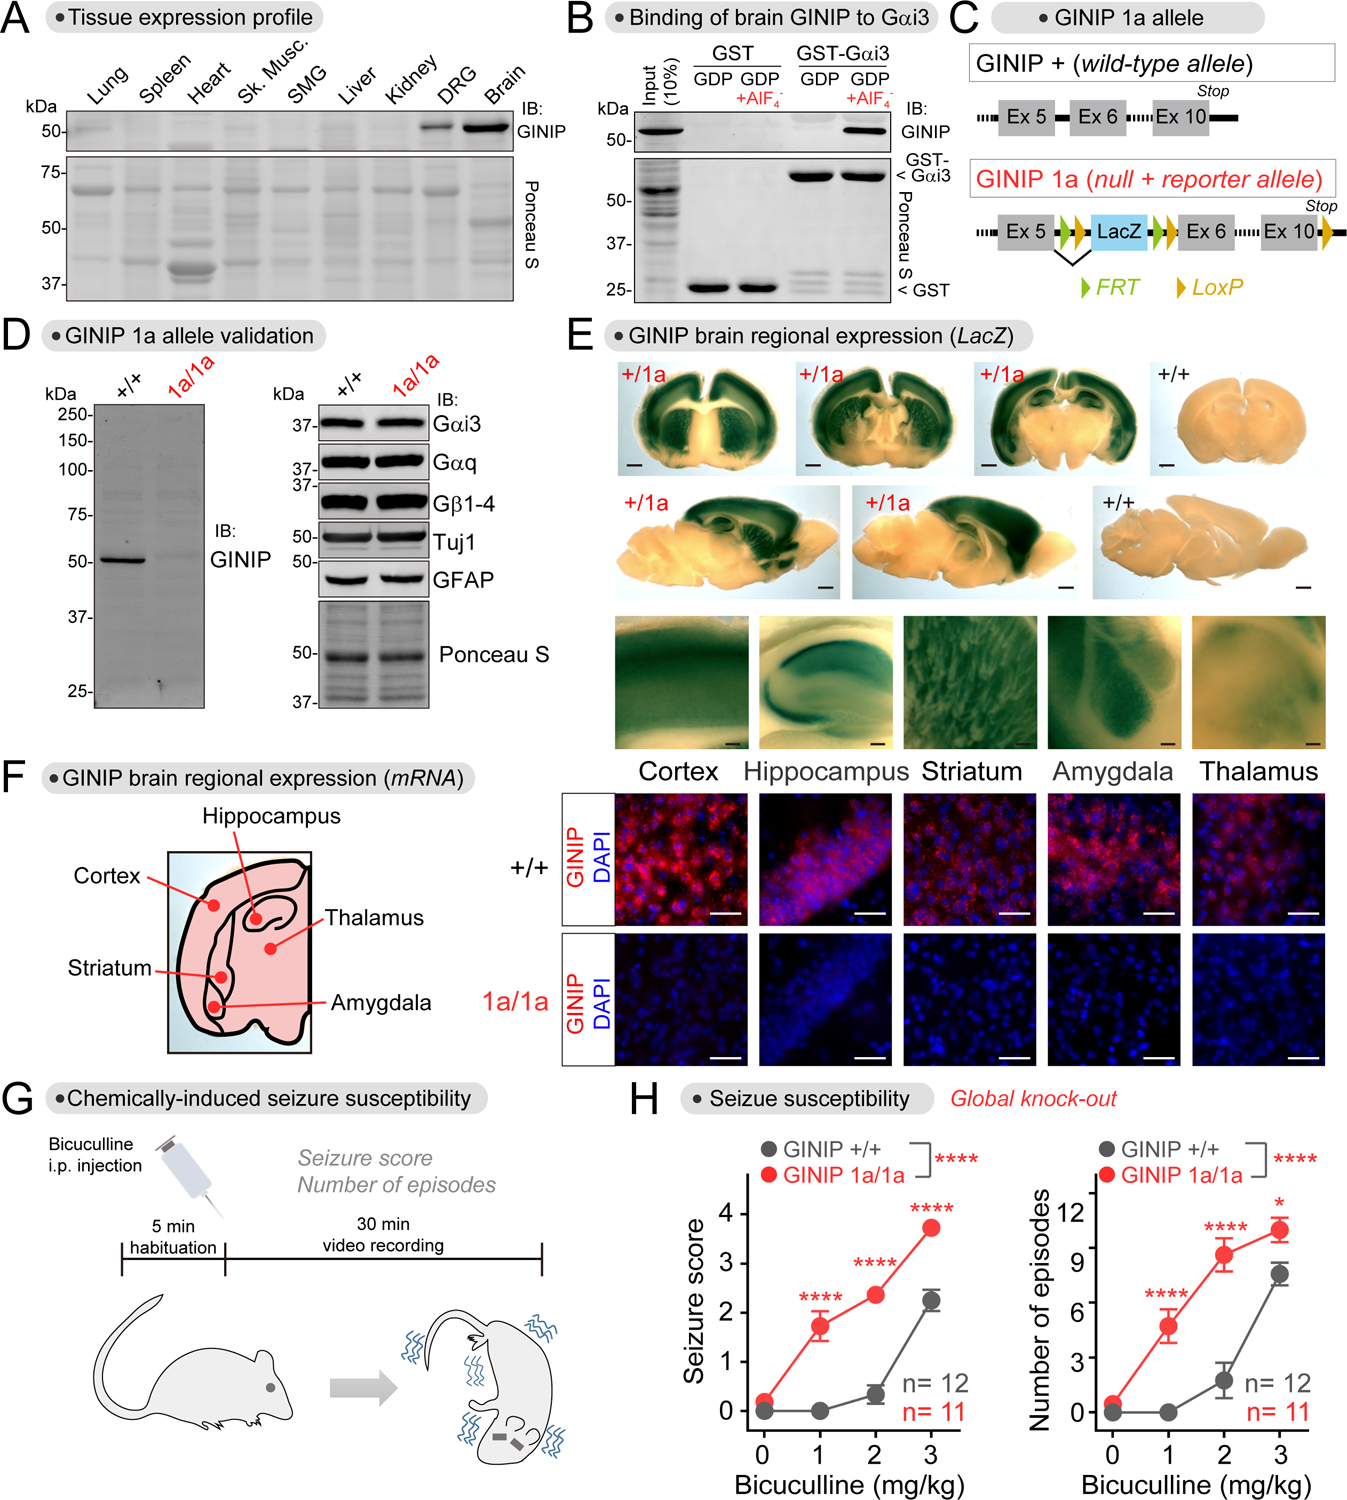
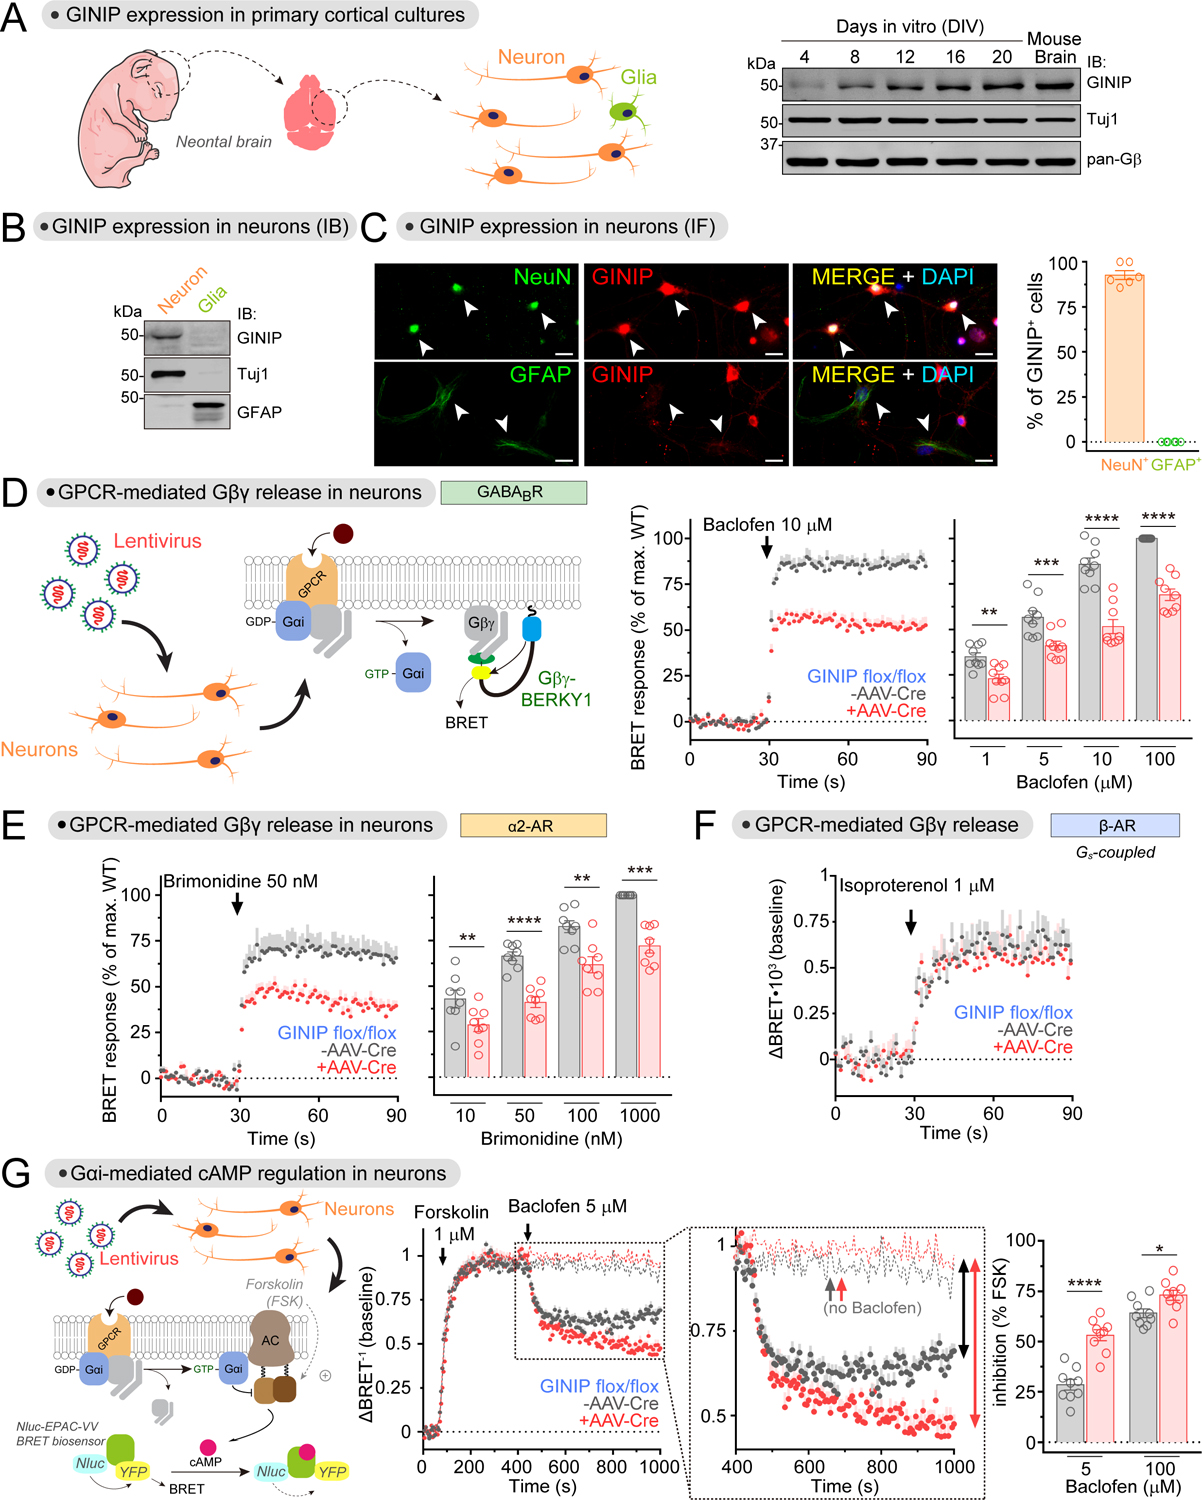
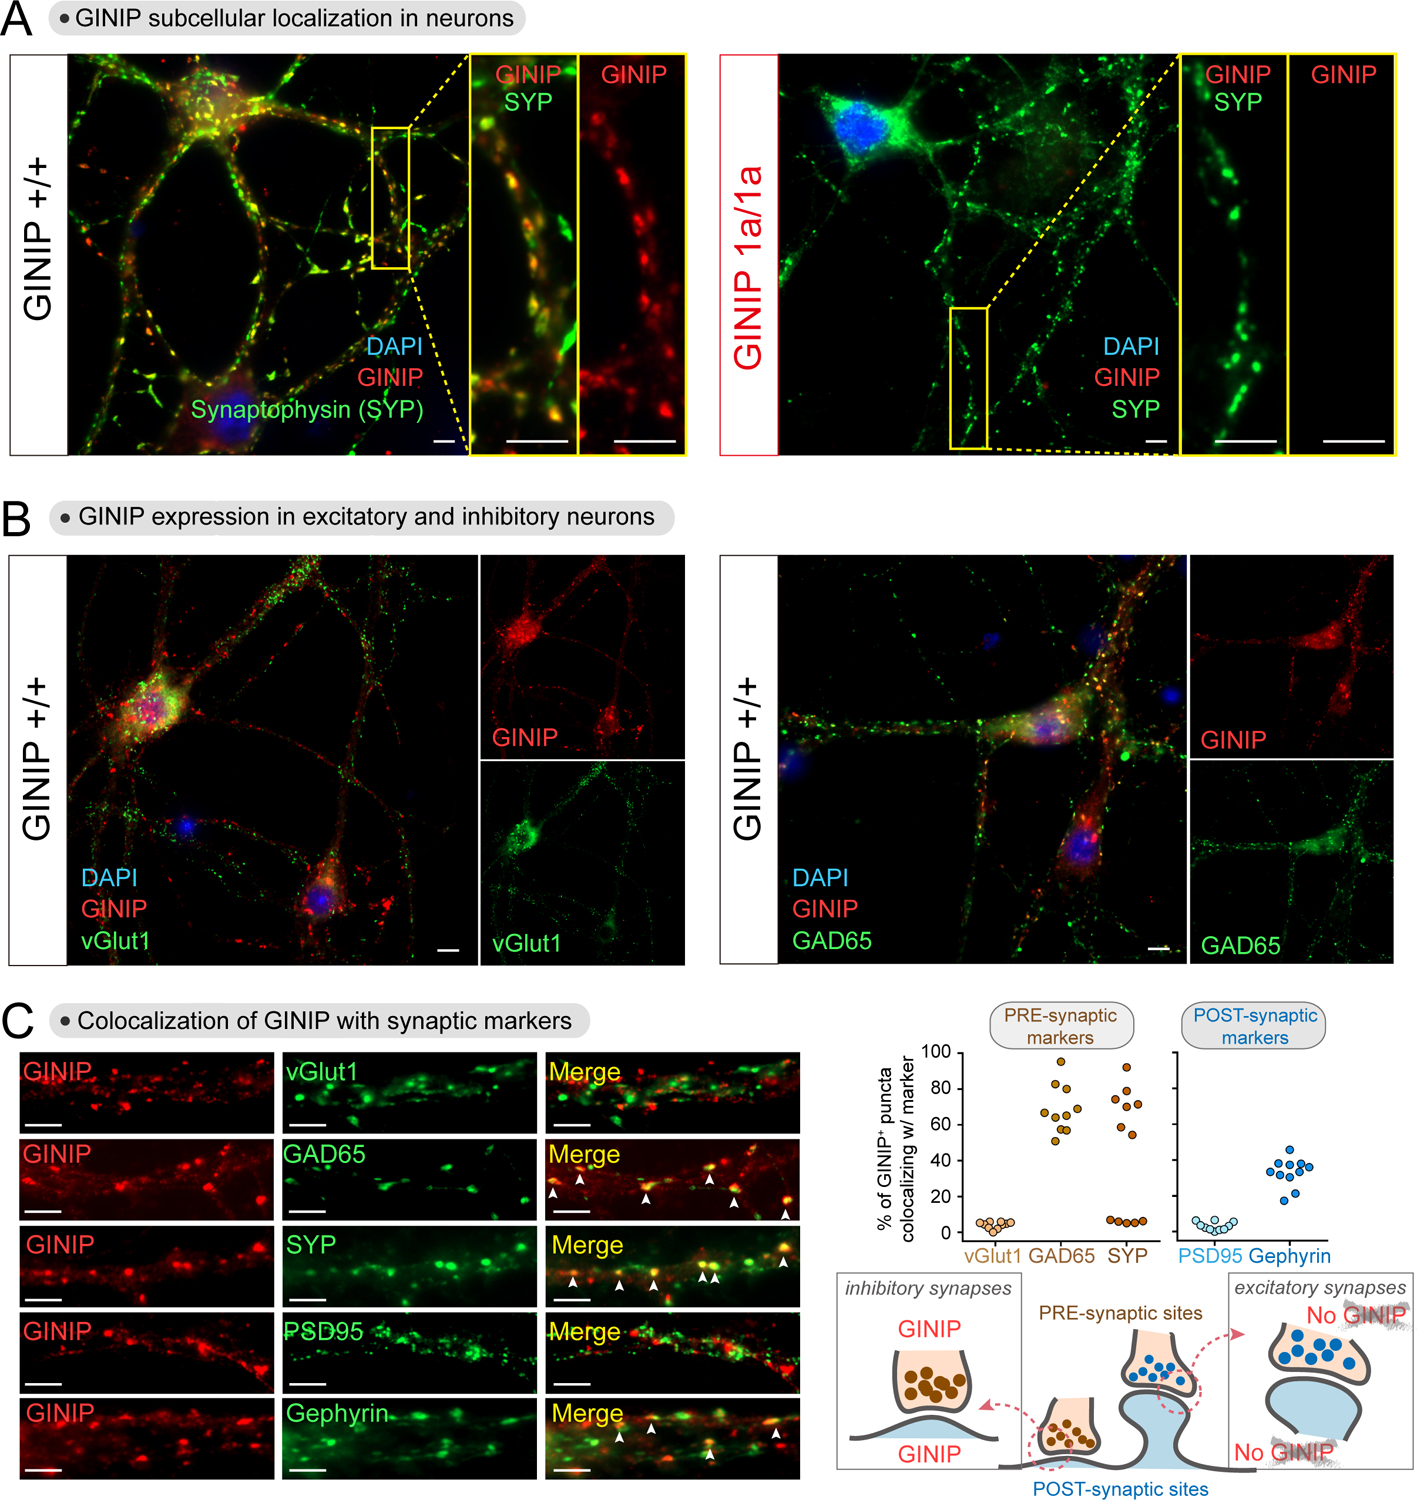
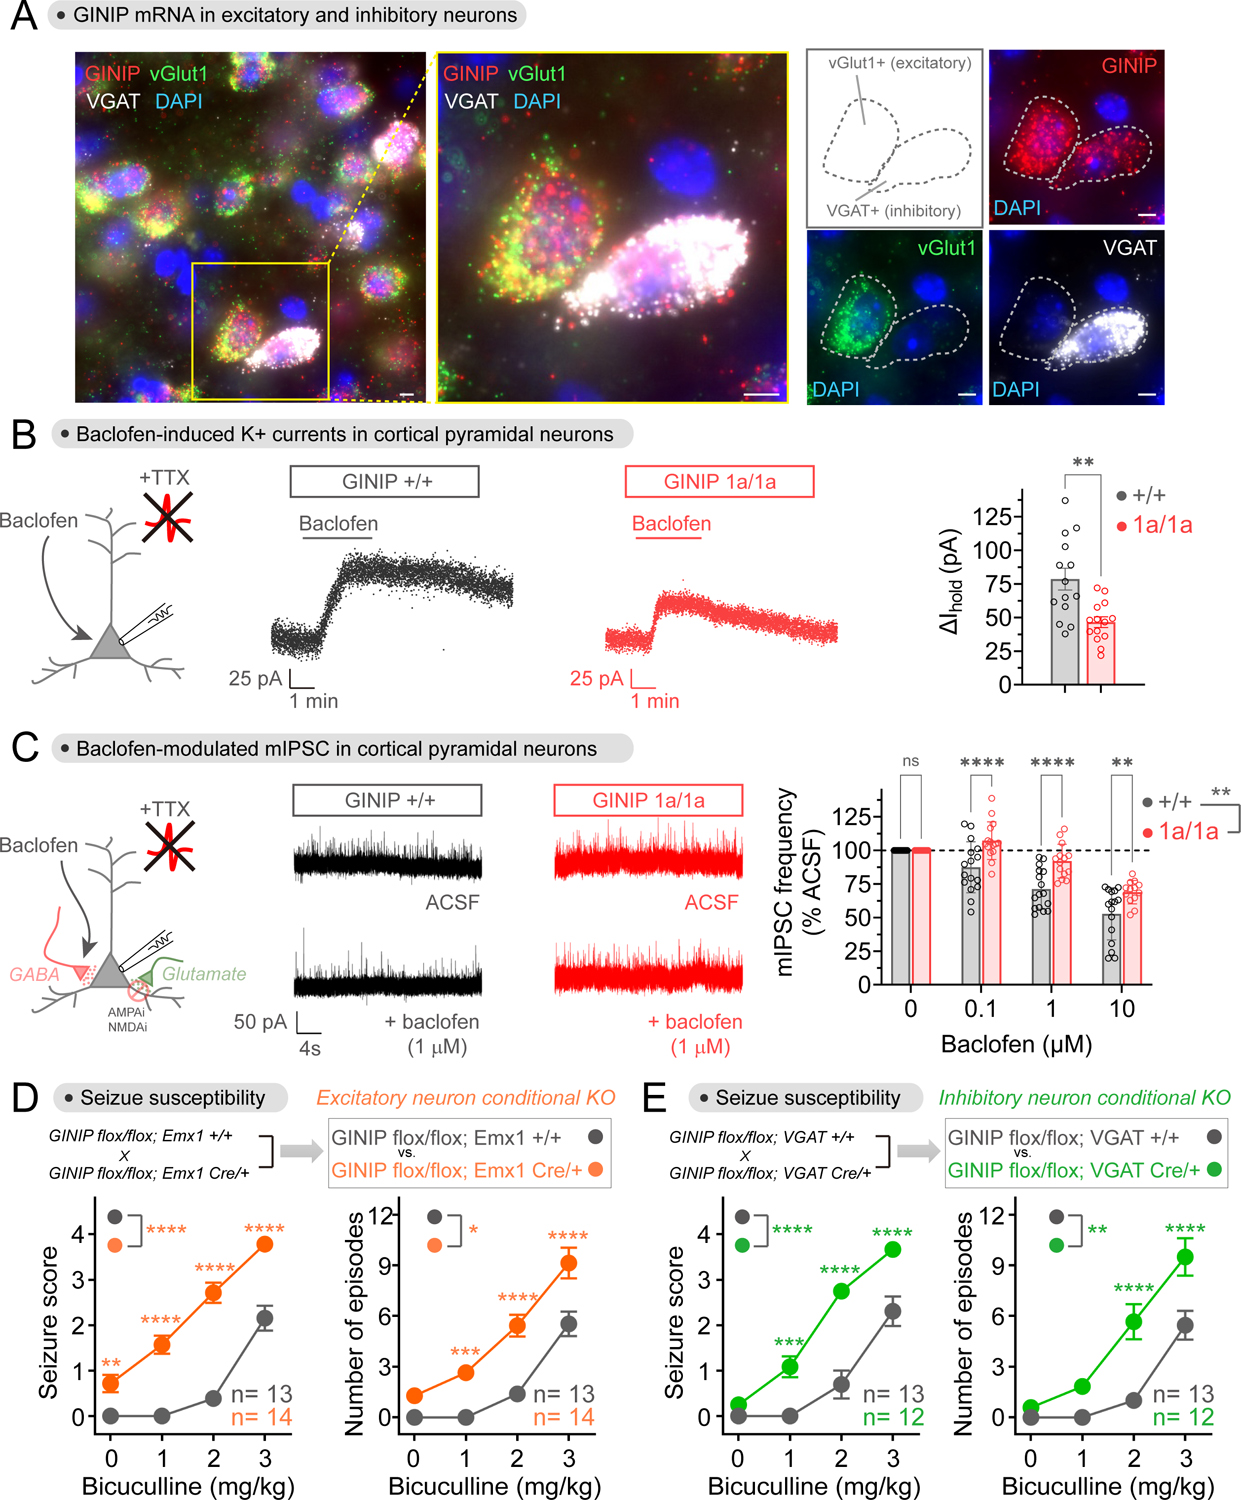
G-protein-coupled receptors (GPCRs) mediate neuromodulation through the activation of heterotrimeric G proteins (Gαβγ). Classical models depict that G protein activation leads to a one-to-one formation of Gα-GTP and Gβγ species. Each of these species propagates signaling by independently acting on effectors, but the mechanisms by which response fidelity is ensured by coordinating Gα and Gβγ responses remain unknown. Here, we reveal a paradigm of G protein regulation whereby the neuronal protein GINIP (Gα inhibitory interacting protein) biases inhibitory GPCR responses to favor Gβγ over Gα signaling. Tight binding of GINIP to Gαi-GTP precludes its association with effectors (adenylyl cyclase) and, simultaneously, with regulator-of-G-protein-signaling (RGS) proteins that accelerate deactivation. As a consequence, Gαi-GTP signaling is dampened, whereas Gβγ signaling is enhanced. We show that this mechanism is essential to prevent the imbalances of neurotransmission that underlie increased seizure susceptibility in mice. Our findings reveal an additional layer of regulation within a quintessential mechanism of signal transduction that sets the tone of neurotransmission.

Keywords: G protein; GPCR; GTPase; KIAA1045; PHF24; neuron; neurotransmitter; seizures.


Conflict of interest statement

Declaration of interests The authors declare no competing interests.

Figures

Figure 1.
Figure 1.. GINIP binds to the effector binding region of Gαi without affecting its enzymatic activity.
(A) GINIP binds to active but not inactive Gαi3. Left, Coomassie-stained gel showing binding of His-Gαi3, loaded as indicated (GDP, GDP·AlF4, GTPγS), to immobilized GST-GINIP. Right, quantification of His-Gαi3 binding to GST-GINIP. Mean±S.E.M., n=3–4. (B) GINIP binds to Gαi3, but not to other Gα’s of the same family (Gαo, Gαz), or other families (Gαs, Gαq, Gα12). Lysates of HEK293T cells expressing the indicated G-proteins were incubated with GST or GST-GINIP immobilized on glutathione-agarose beads in the presence of GDP or GDP·AlF4. Bead-bound proteins were detected by Ponceau S staining or immunoblotting (IB). (C) GINIP does not affect the enzymatic activity of Gαi. Nucleotide exchange on Gαi3 was determined by GTPγS binding, whereas nucleotide hydrolysis by Gαi1RM/AS was determined by the production of free phosphate (Pi) from GTP. GINIP, 2 μM, DAPLE, 1 μM, RGS4, 0.2 μM. Mean±S.E.M., n=3. (D) Gαi3 region aa178–270 is required for GINIP binding. Left, diagram of Gαi3 (orange) /Gαo (green) chimeras. Sequence alignment of Gαi1, Gαi2, Gαi3, and Gαo, indicating mutations tested in panel (E). Right, binding of purified His-GINIP to the indicated G-proteins in the presence of GDP·AlF4. Bead-bound proteins were detected by Ponceau S staining or immunoblotting (IB). (E) Mutation of residues in the α3 helix and Switch II of Gαi ablate GINIP binding. Left, Structural model of Gαi1-(GDP·AlF4) (PDB: 2G83). Red indicates residues in the α3/Switch II region that disrupt GINIP binding when mutated, whereas blue indicates an adjacent residue that does not affect GINIP binding when mutated. Center & Right, binding of purified His-GINIP to the indicated G-proteins in the presence of GDP·AlF4. Bead-bound proteins were detected by Ponceau S staining or immunoblotting (IB). (F) Mutation of residues within, but not adjacent to, the effector binding region (α3/Switch II groove) of Gαi impair GINIP binding. Left, Structural model of Gαi1-(GDP·AlF4) (PDB: 2G83) displaying the residues investigated by site-directed mutagenesis. Right, binding of the indicated G-proteins loaded with GTPγS to GST-GINIP. Bead-bound proteins were detected Coomassie staining. All protein electrophoresis results are representative of n ≥ 3 experiments. See also Figure S1.
Figure 2.
Figure 2.. GINIP directly blocks Gαi-mediated regulation of adenylyl cyclase.
(A) GINIP prevents Gαi-mediated inhibition of adenylyl cyclase (AC) upon stimulation of 3 different GPCRs. Top row, kinetic traces of BRET measurement of cAMP in HEK293T cells expressing the GABABR in the presence or absence of GINIP treated with forskolin (FSK) and GABA as indicated. Bottom row, quantified inhibition of FSK-stimulated cAMP upon stimulation of GABABR, α2A-AR, or D2R with GABA (1 μM), Brimonidine (5 μM), or dopamine (0.2 μM). Immunoblot (IB) validates GINIP expression. Mean±S.E.M., n=3–5. **p<0.01, ***p<0.001, paired t-test. (B) GINIP prevents the association of active Gαi3 with AC5 in cells. Left, changes in BRET (ΔBRET) were determined in HEK293T cells expressing Gαi3-Nluc WT or Gαi3-Nluc Q204L upon transfection of increasing amounts of GINIP. Mean±S.E.M., n=6. Right, validation of GINIP expression by immunoblotting (IB). (C) GINIP prevents the association of Gαi3 with AC5 upon GPCR stimulation. BRET was measured in HEK293T cells expressing the GABABR or the α2A-AR upon transfection of different amounts of GINIP DNA. Kinetic traces correspond to cells expressing no GINIP (‘CTRL’ blue) or transfected with 2 μg of GINIP plasmid (red). Cells were treated with the indicated GPCR agonists/antagonists. Mean±S.E.M., n=3. (D) GINIP blocks the regulation of AC by Gαi in vitro. Coomassie-stained gel shows the purified proteins used. Bar graph shows that FSK (5 μM) or Gαs-GTPγS (0.1 μM), but not myr-Gαi1 (2 μM) or GINIP (2 μM), promote the activation of reconstituted AC (AC5 (C1) + AC2 (C2)). Right, Gαs-stimulated AC activity in the presence of increasing concentrations of myr-Gαi1-GTPγS with (red) or withiot (blue) GINIP (2 μM). Mean±S.E.M., n=5. *p<0.05, **p<0.01, ***p<0.001, ****p<0.0001, two-way ANOVA for presence/ absence of GINIP x myr-Gαi1 concentration, with multiple comparisons at each concentration using Fisher’s LSD test. (E) Diagram summarizing the proposed mechanism action of GINIP on Gαi-mediated modulation of AC activity (competitive binding).
Figure 3.
Figure 3.. GINIP promotes Gβγ-mediated signaling by antagonizing the action of RGS GAPs on Gαi.
(A) GINIP enhances Gβγ-mediated signaling triggered by GABABR. Left, diagram of G-protein activation/deactivation cycle and BRET-based detection of free Gβγ. Center, BRET was measured in HEK293T cells expressing the GABABR in the absence (black) or presence (red) of GINIP. Cells were treated with GABA and CGP54626 as indicated. Right, G protein deactivation rates were determined by normalizing the BRET data and curve fitting to extract rate constant values (k). Mean±S.E.M., n=4–7. ns = not significant, **p<0.01, ***p<0.001, paired t-test. (B) GINIP antagonizes GAIP-mediated acceleration of Gβγ deactivation for Gi but not Go proteins. BRET experiments were carried out and analyzed as in (A) with cells expressing Gαi3 or Gαo in the absence (grey) or presence of GAIP (blue) or GAIP plus GINIP (orange). GAIP and GINIP expression validated by immunoblotting (IB). Mean±S.E.M., n=5. ns = not significant, **p<0.01, ***p<0.001, one-way ANOVA corrected for multiple comparisons (Tukey). (C) GINIP antagonizes the acceleration of Gβγ deactivation mediated by representative members of all RGS families. BRET experiments were carried out and analyzed as in (B), except that RGS8 (R4), RGS7 (R7), or RGS12 (R12) were used instead of GAIP (RZ). RGS7 was co-transfected with Gβ5 and R7BP. Mean±S.E.M., n=3–6. *p<0.05, **p<0.01, one-way ANOVA corrected for multiple comparisons (Tukey). (D) GINIP antagonizes the GAP activity of RGS4 on Gαi in vitro. Nucleotide hydrolysis by Gαi1RM/AS (WT or W258F) was determined in the presence of RGS4 and/or GINIP. Mean±S.E.M., n=3. ns = not significant, *p<0.05, **p<0.01, one-way ANOVA corrected for multiple comparisons (Tukey). (E) GINIP competes with RGS4 for binding to Gαi3. Left, Structural model of Gαi1-(GDP·AlF4) bound to RGS4 (PDB: 1AGR). Right, increasing concentrations of purified His-GINIP and a fixed amount of His-RGS4 (20 nM) were incubated with GST or GST-Gαi3 (WT or W258F) immobilized on glutathione-agarose beads in the presence of GDP·AlF4. Bead-bound proteins were detected by Ponceau S staining or by immunoblotting (IB). One representative result of three independent experiments is shown. (F) Diagram summarizing the proposed mechanism by which GINIP biases G protein responses by favoring Gβγ-dependent signaling in detriment of Gαi-dependent signaling. See also Figure S2 and Figure S3
Figure 4.
Figure 4.. Loss of GINIP increases seizure susceptibility.
(A) GINIP expression is restricted to the nervous system and most abundant in brain. Proteins extracted from the indicated mouse tissues were analyzed by Ponceau S staining or by immunoblotting (IB). n=2. (B) Active Gαi binds to brain-derived GINIP. GST or GST-Gαi3 immobilized on glutathione-agarose beads were incubated with mouse brain lysates in the presence of GDP or GDP·AlF4. Bead-bound proteins were detected by Ponceau S staining or by immunoblotting (IB). n=3. (C) Diagram depicting features of the GINIP 1a allele bearing a LacZ-containing cassette inserted between exon 5 and exon 6. (D) GINIP expression is specifically ablated in GINIP 1a/1a mice. Mouse brain lysates were analyzed by immunoblotting (IB), n=3. (E) GINIP is expressed in the cortex, hippocampus, striatum, amygdala and thalamus. β-galactosidase activity was detected by staining brain slices of GINIP +/1a or +/+ mice. Scale bars are 1 mm (whole sections) or 0.1 mm (enlarged areas). n=3. (F) GINIP mRNA is expressed in the cortex, hippocampus, striatum, amygdala and thalamus. GINIP mRNA was detected in mouse brain coronal slices of GINIP +/+ or 1a/1a by fluorescence in situ hybridization. Scale bar = 50 μm. n=3. (G, H) GINIP 1a/1a mice display increased susceptibility to bicuculline-induced seizures compared to GINIP +/+ mice. 11–12 mice (male and female) per genotype. See Fig. S4 for results stratified by sex. Mean±S.E.M. *p<0.05, ****p<0.0001, two-way ANOVA for genotype x concentration of bicuculline, with multiple comparisons at each concentration using Fisher’s LSD test. See also Figure S4
Figure 5.
Figure 5.. GINIP regulates Gi-coupled GPCR signaling in neurons
(A) GINIP is expressed in cortical neuron cultures. Neuron cultures established from the cortices of neonatal mouse brains were analyzed by immunoblotting (IB) on the indicated days in vitro (DIV). n=2. (B) GINIP is not expressed in cortical glial cultures. Neuron and glial cultures established from the cortices of neonatal mouse brains were analyzed by immunoblotting (IB) on DIV12. n=3. (C) GINIP is expressed in cortical neurons but not in glia. GINIP was co-stained with NeuN or GFAP in DIV12 cortical cultures. Arrows indicate NeuN+ or GFAP+ cells. The proportion of GINIP+ in NeuN+ or GFAP+ cells was quantified from three independent cultures (two image fields per experiment). Mean±S.E.M. Scale bar = 20 μm. (D, E) Loss of GINIP decreases Gβγ responses triggered by GABABR (D) and α2-AR (E). BRET was measured in DIV12–14 cortical neurons from GINIP flox/flox mice that had been transduced (red) or not (black) with AAV-Cre. BRET responses were normalized to the maximum response of WT in each experiment. Mean±S.E.M., n=8–9. **p<0.01, ***p<0.001, ****p<0.0001, paired t-test. (F) Loss of GINIP does not affect Gβγ responses triggered by β-AR. BRET was measured in DIV12–14 cortical neurons as in D and E. Mean±S.E.M. n=5 (G) Loss of GINIP enhances the inhibition of adenylyl cyclase upon stimulation of GABABR. cAMP was measured by BRET in DIV16–18 cortical neurons from GINIP flox/flox mice that had been transduced (red) or not (black) with AAV-Cre. Dotted lines in the kinetic traces indicate controls not stimulated with baclofen. Mean±S.E.M., n=9. *p<0.05, ****p<0.0001, paired t-test. See also Figure S5
Figure 6.
Figure 6.. GINIP localizes to inhibitory but not excitatory synapses.
(A) GINIP protein localizes to dendritic puncta in cortical neurons. DIV21 cortical neurons from GINIP +/+ or 1a/1a mice were co-stained for GINIP and synaptophysin (SYP) before fluorescence imaging. Yellow boxes indicate areas enlarged on the right side of the main images. (B) GINIP is expressed in both excitatory (vGlut1+) and inhibitory (GAD65+) neurons. DIV21 cortical neurons from GINIP +/+ mice were co-stained for GINIP and the indicated markers. (C) GINIP co-localizes with markers of inhibitory but not excitatory synapses. Left, cortical neurons co-stained for GINIP and the indicated markers of different synaptic compartments were imaged by confocal fluorescence microscopy. Right, quantification of the colocalization of GINIP with synaptic markers. Scatter plot values are the percentage of GINIP positive puncta that were positive for each synaptic marker of one field (3–4 fields from 3 independent experiments). All scale bars are 10 μm. All results are representative of n ≥ 3 experiments. See also Figure S6
Figure 7.
Figure 7.. Loss of GINIP from either excitatory or inhibitory neurons affects inhibitory neuromodulation and increases seizure susceptibility.
(A) GINIP mRNA is expressed in excitatory and inhibitory cortical neurons. GINIP, vGlut1 and VGAT mRNAs were simultaneously detected in mouse cortical slices. All scale bars are 10 μm. n ≥ 3 experiments. (B) Loss of GINIP reduces GIRK currents in response to baclofen. Representative traces of baclofen-induced holding current change in cortical pyramidal neurons from GINIP +/+ (black) or GINIP 1a/1a (red) slices are shown in the left and middle, whereas quantification of peak amplitude across multiple cells is shown on the right. Mean±S.E.M. (n=14 per group), **p<0.01, unpaired t-test. Baclofen = 50 μM. (C) Loss of GINIP dampens baclofen-induced reduction of mIPSC frequency. Representative traces of mIPSC recorded from GINIP +/+ (black) and GINIP 1a/1a (red) cortical pyramidal neuron before and after baclofen are shown in the left and middle, whereas quantification of mIPSC frequency for different concentrations of baclofen relative to controls is shown on the right. Mean±S.E.M. n=13–16 per group. **p<0.01, ***p<0.001, ****p<0.0001, two-way ANOVA for GINIP genotype x baclofen concentration, with multiple comparisons at each concentration using Fisher’s LSD test. (D, E) Loss of GINIP from Emx1+ (excitatory) neurons (B) or from VGAT+ (inhibitory) neurons (C) results in increased seizure susceptibility. 12–14 mice (male and female) per genotype. See Fig. S4 for results stratified by sex. Mean±S.E.M. *p<0.05, **p<0.01, ***p<0.001, ****p<0.0001, two-way ANOVA for genotype x concentration of bicuculline, with multiple comparisons at each concentration using Fisher’s LSD test. See also Figure S4 and Figure S7.

Comment in

References

    1. Gilman AG (1987). G proteins: transducers of receptor-generated signals. Annual review of biochemistry 56, 615–649. 10.1146/annurev.bi.56.070187.003151. - DOI - PubMed
    1. Weis WI, and Kobilka BK (2018). The Molecular Basis of G Protein-Coupled Receptor Activation. Annual review of biochemistry 87, 897–919. 10.1146/annurev-biochem-060614-033910. - DOI - PMC - PubMed
    1. Roth BL (2019). Molecular pharmacology of metabotropic receptors targeted by neuropsychiatric drugs. Nature structural & molecular biology 26, 535–544. 10.1038/s41594-019-0252-8. - DOI - PMC - PubMed
    1. Greengard P (2001). The neurobiology of slow synaptic transmission. Science 294, 1024–1030. 10.1126/science.294.5544.1024. - DOI - PubMed
    1. Zurawski Z, Yim YY, Alford S, and Hamm HE (2019). The expanding roles and mechanisms of G protein-mediated presynaptic inhibition. The Journal of biological chemistry 294, 1661–1670. 10.1074/jbc.TM118.004163. - DOI - PMC - PubMed

Publication types

MeSH terms

Substances