. 2023 Jul 20;83(14):2524-2539.e7.
doi: 10.1016/j.molcel.2023.06.004. Epub 2023 Jun 29.

Lysosomal LAMP proteins regulate lysosomal pH by direct inhibition of the TMEM175 channel

Affiliations

Lysosomal LAMP proteins regulate lysosomal pH by direct inhibition of the TMEM175 channel

Jiyuan Zhang et al. Mol Cell. .

Abstract

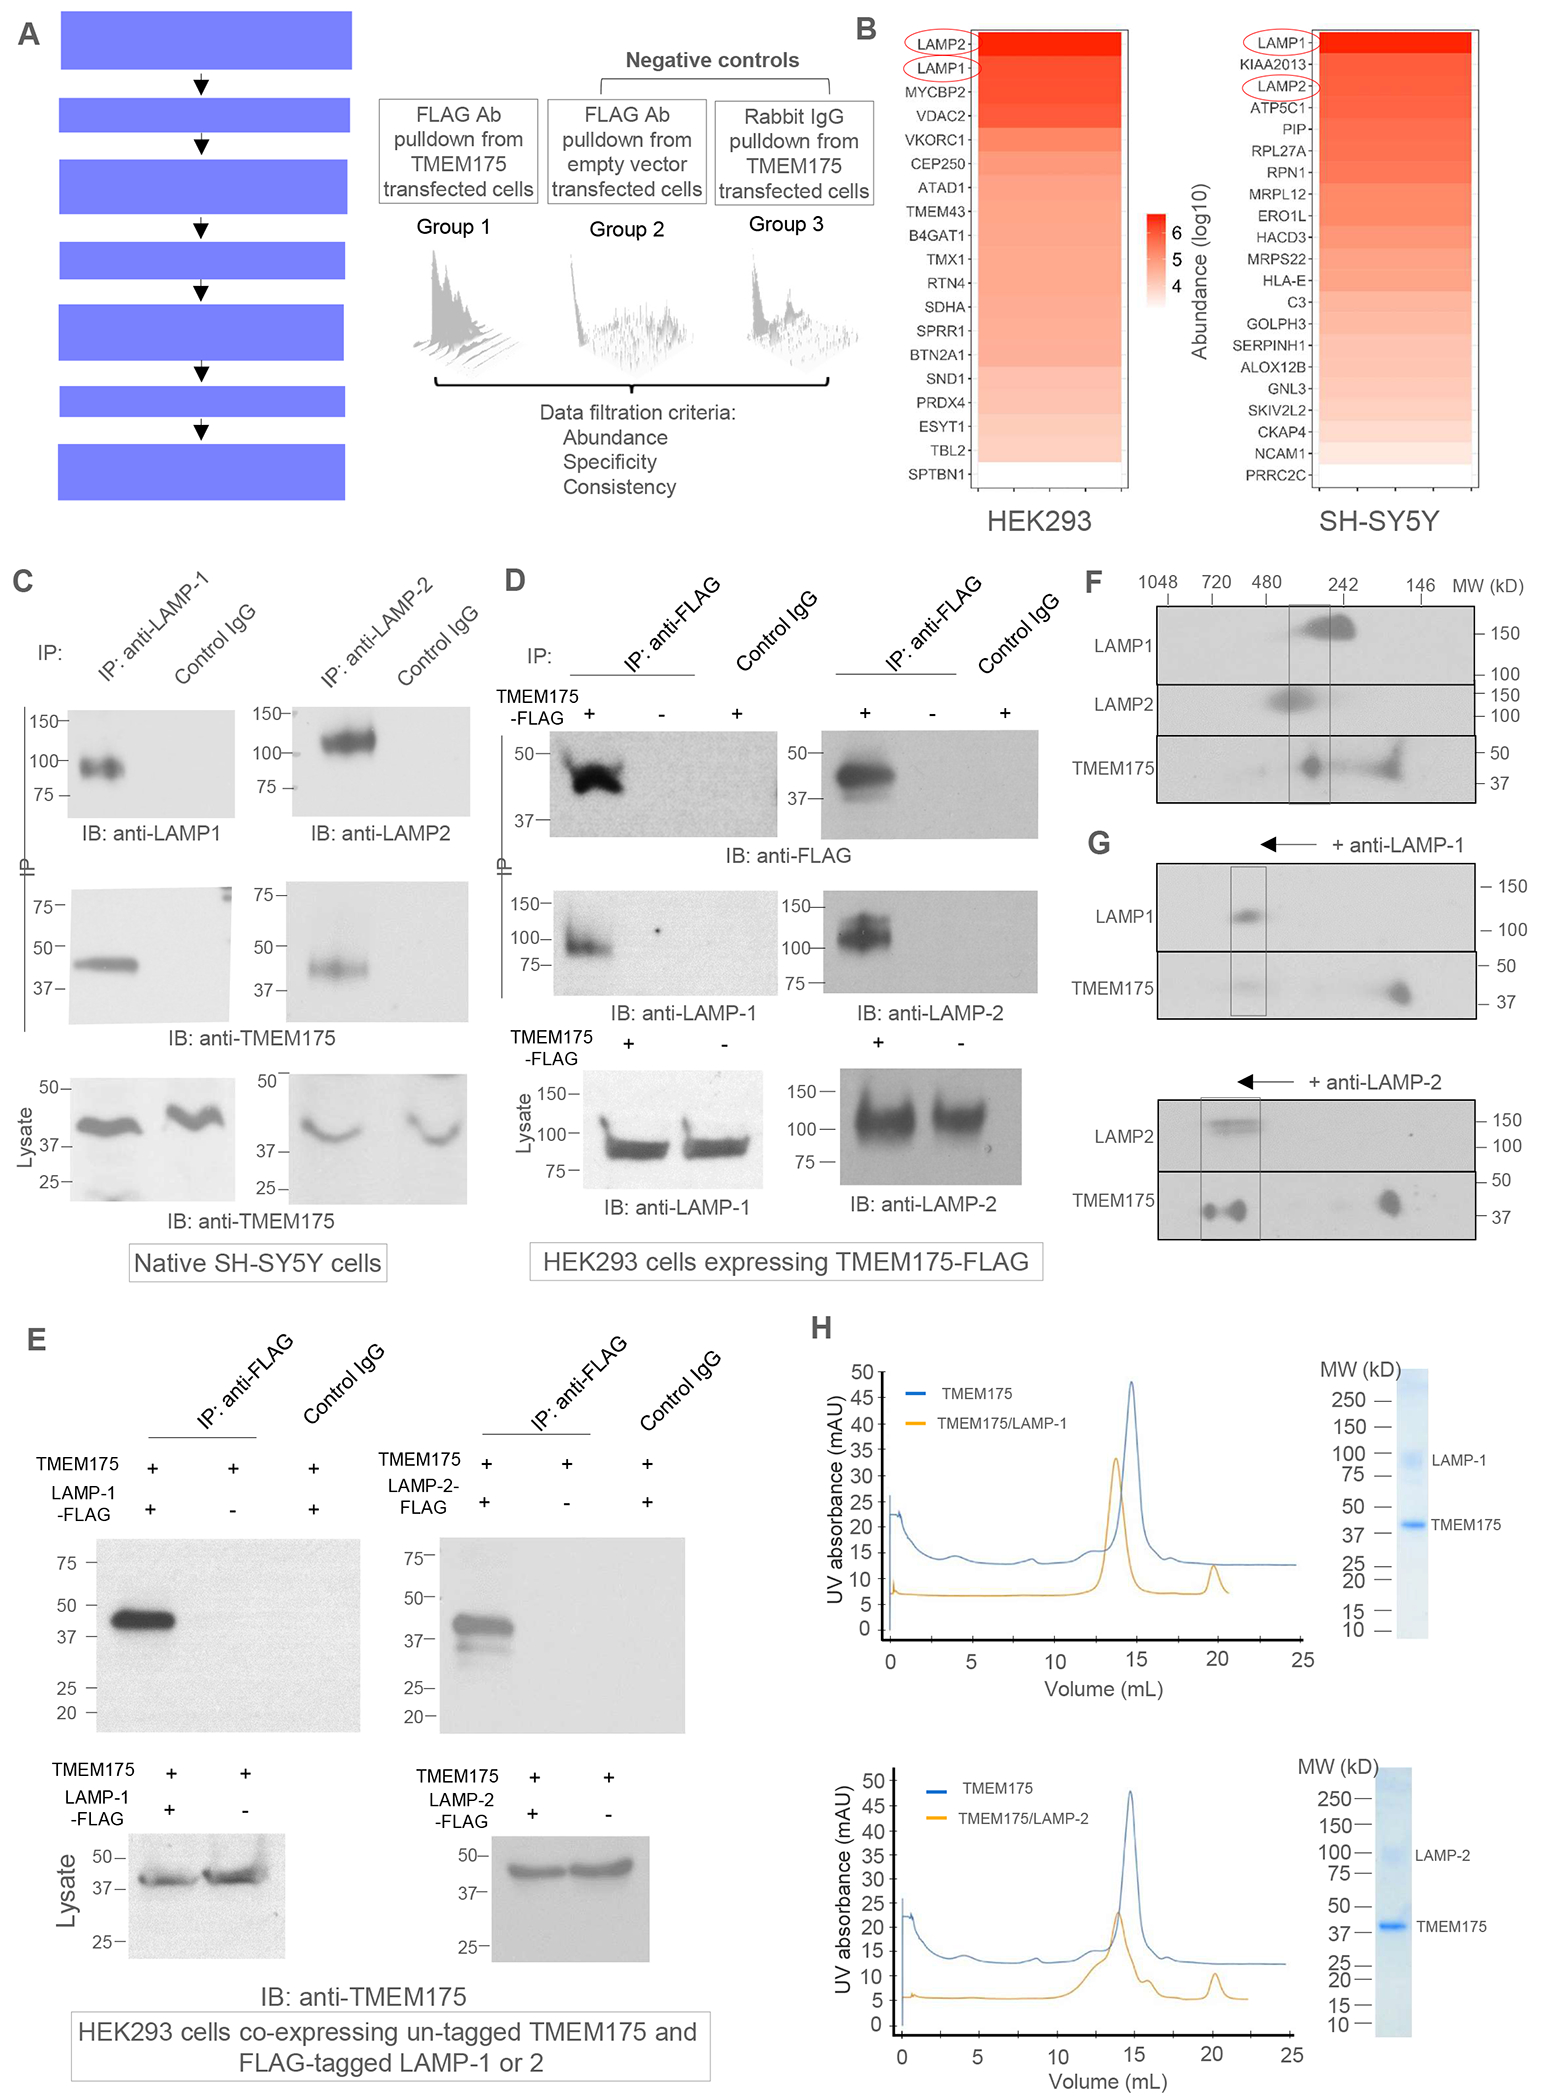
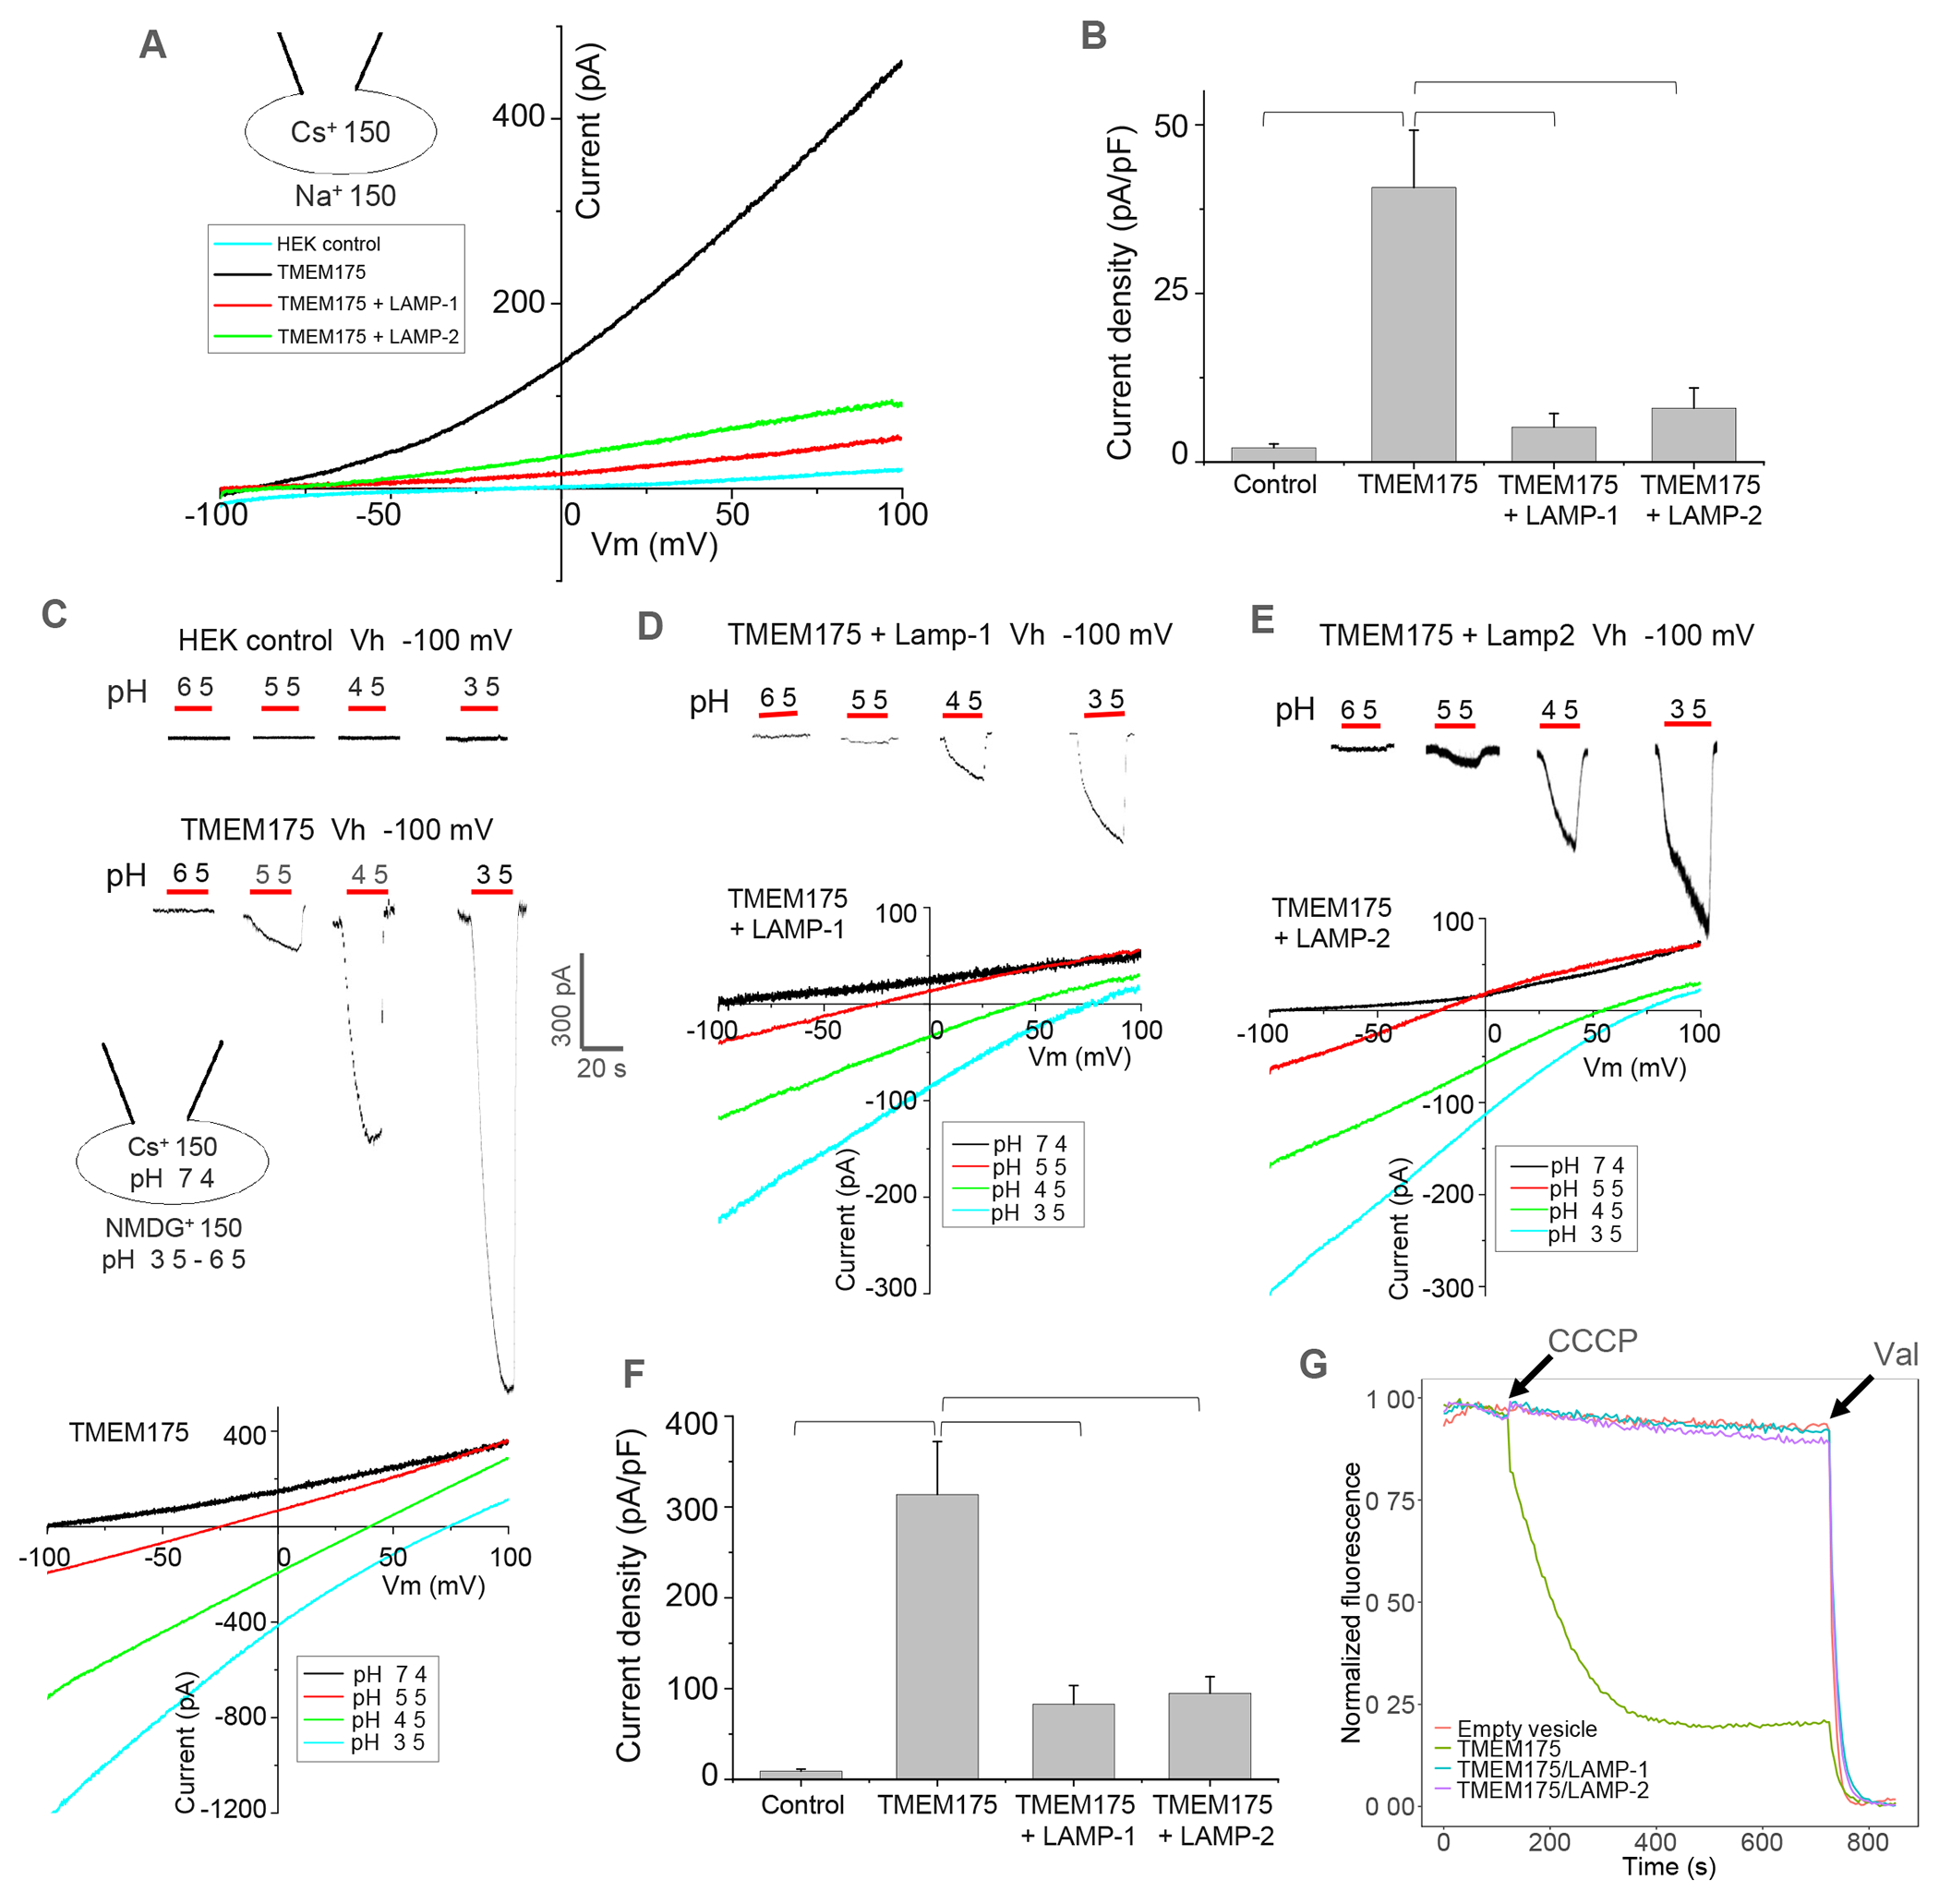
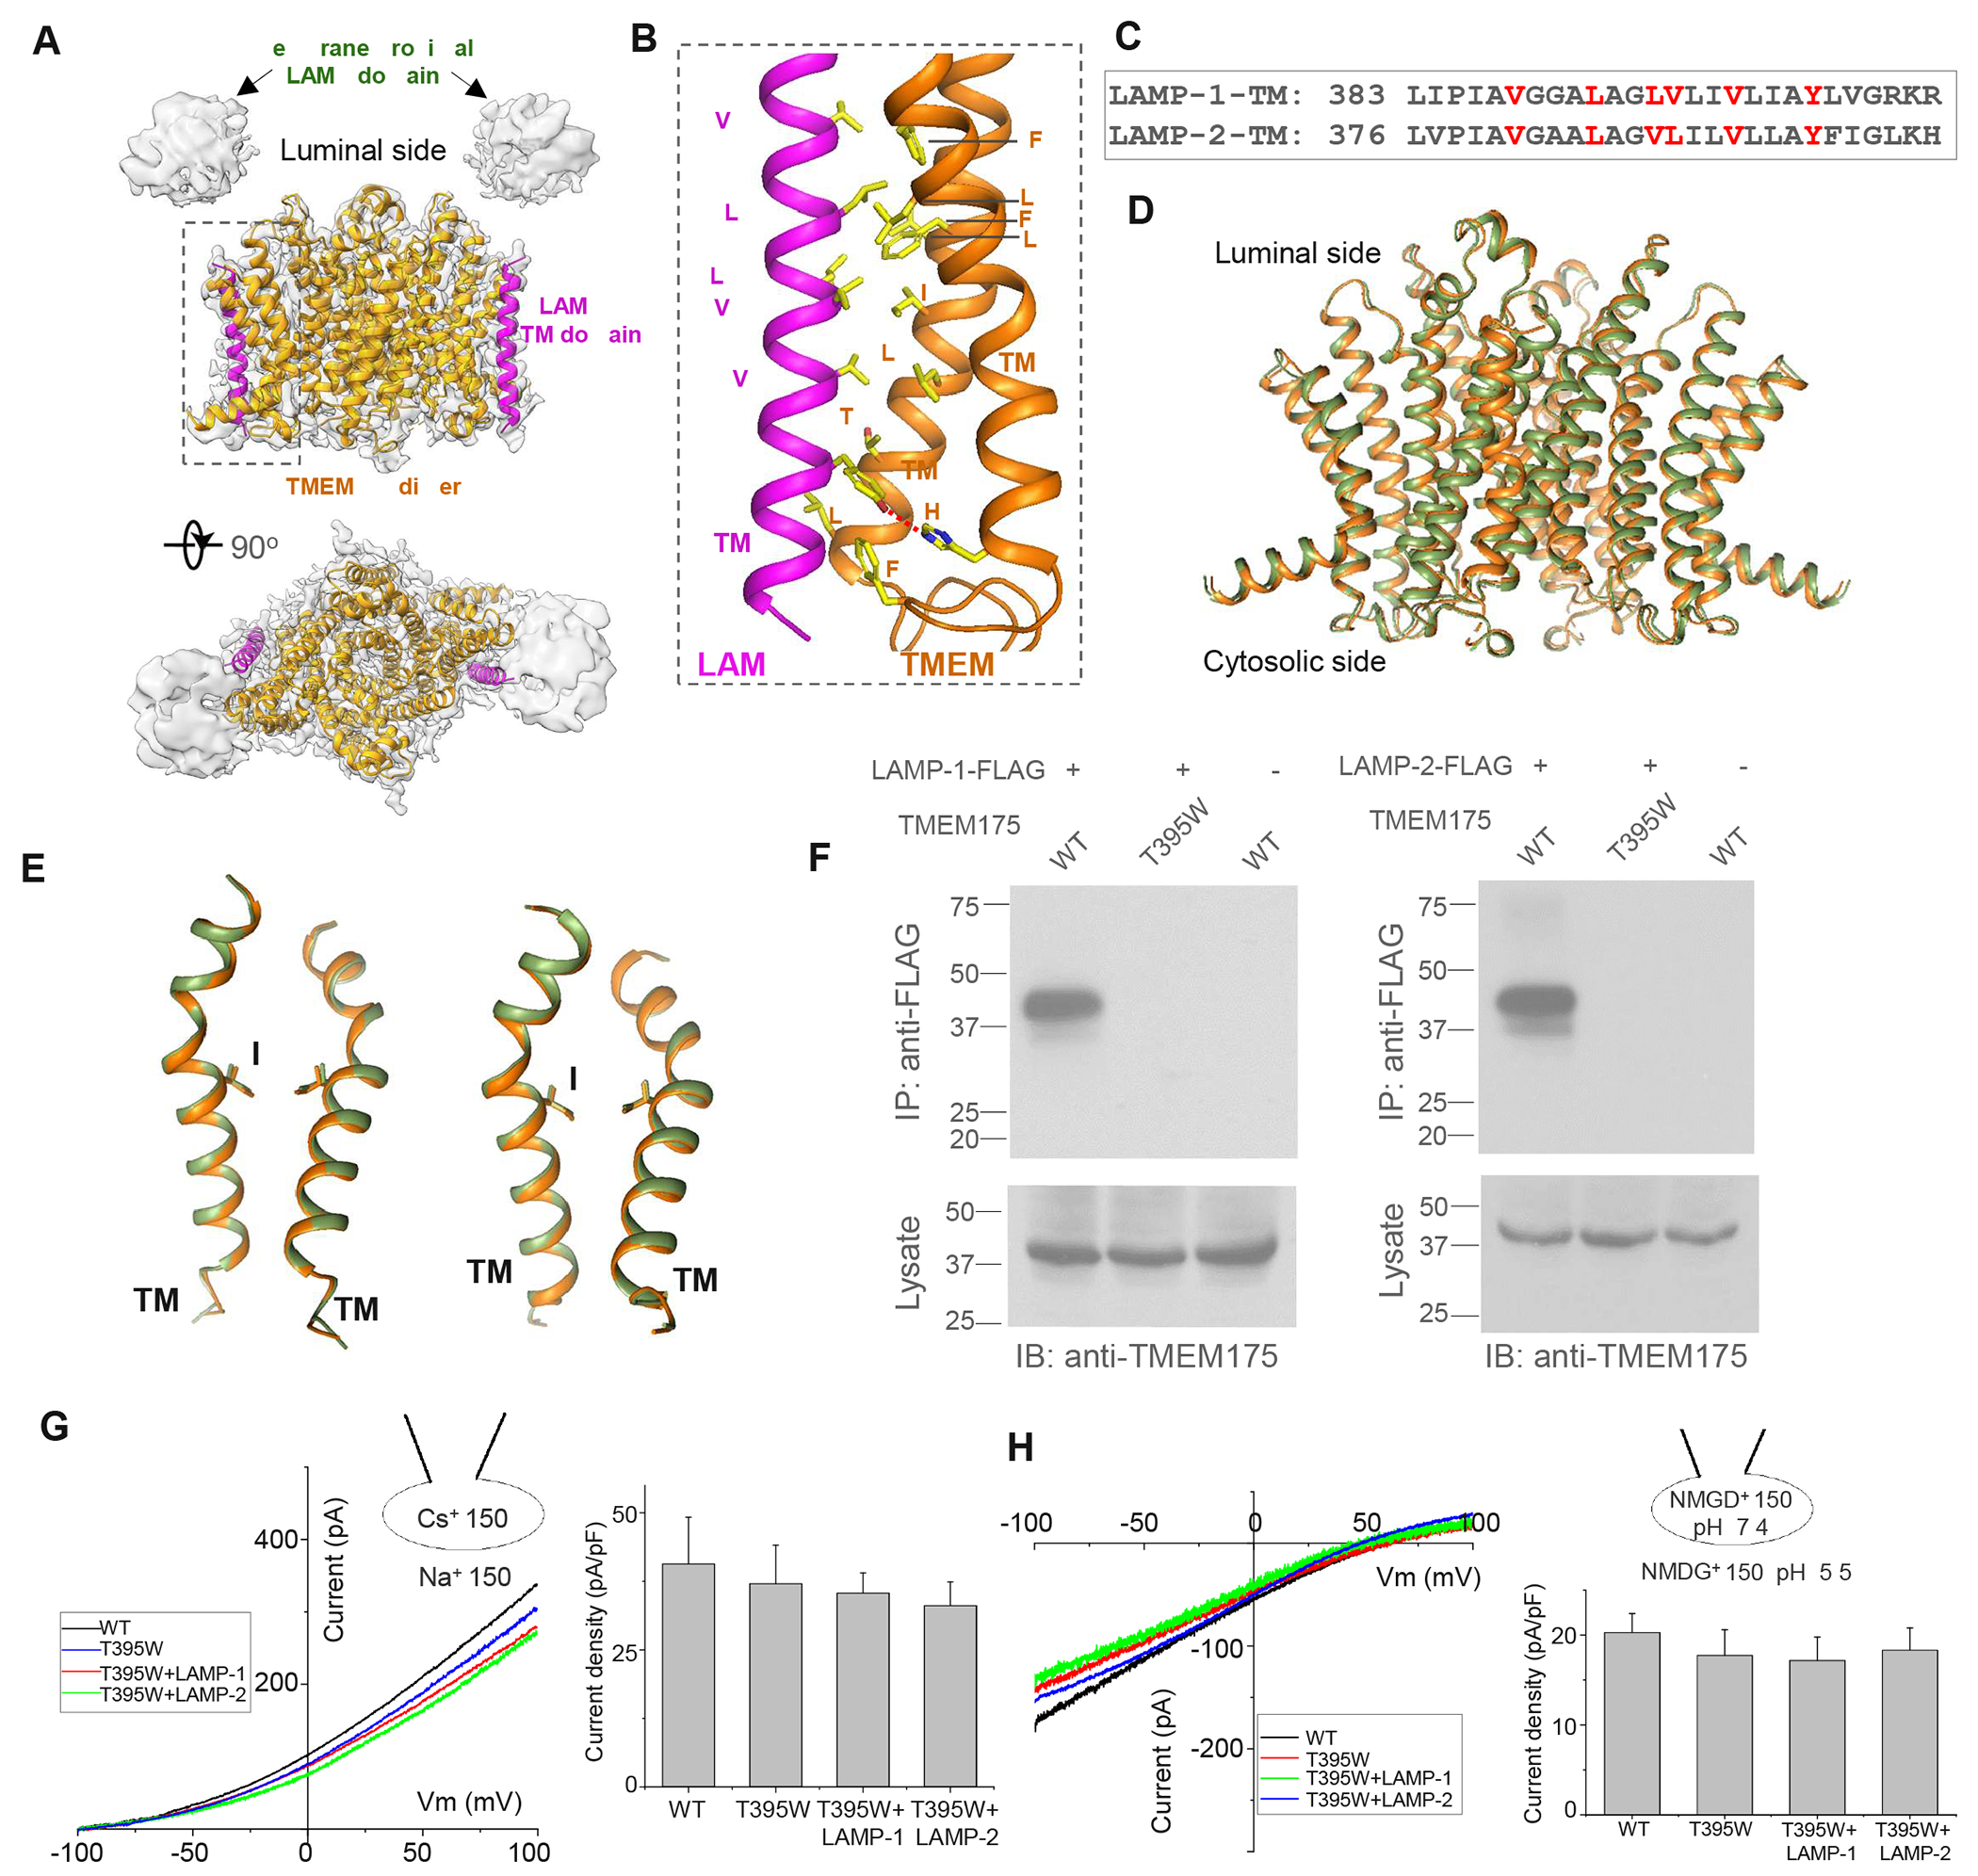
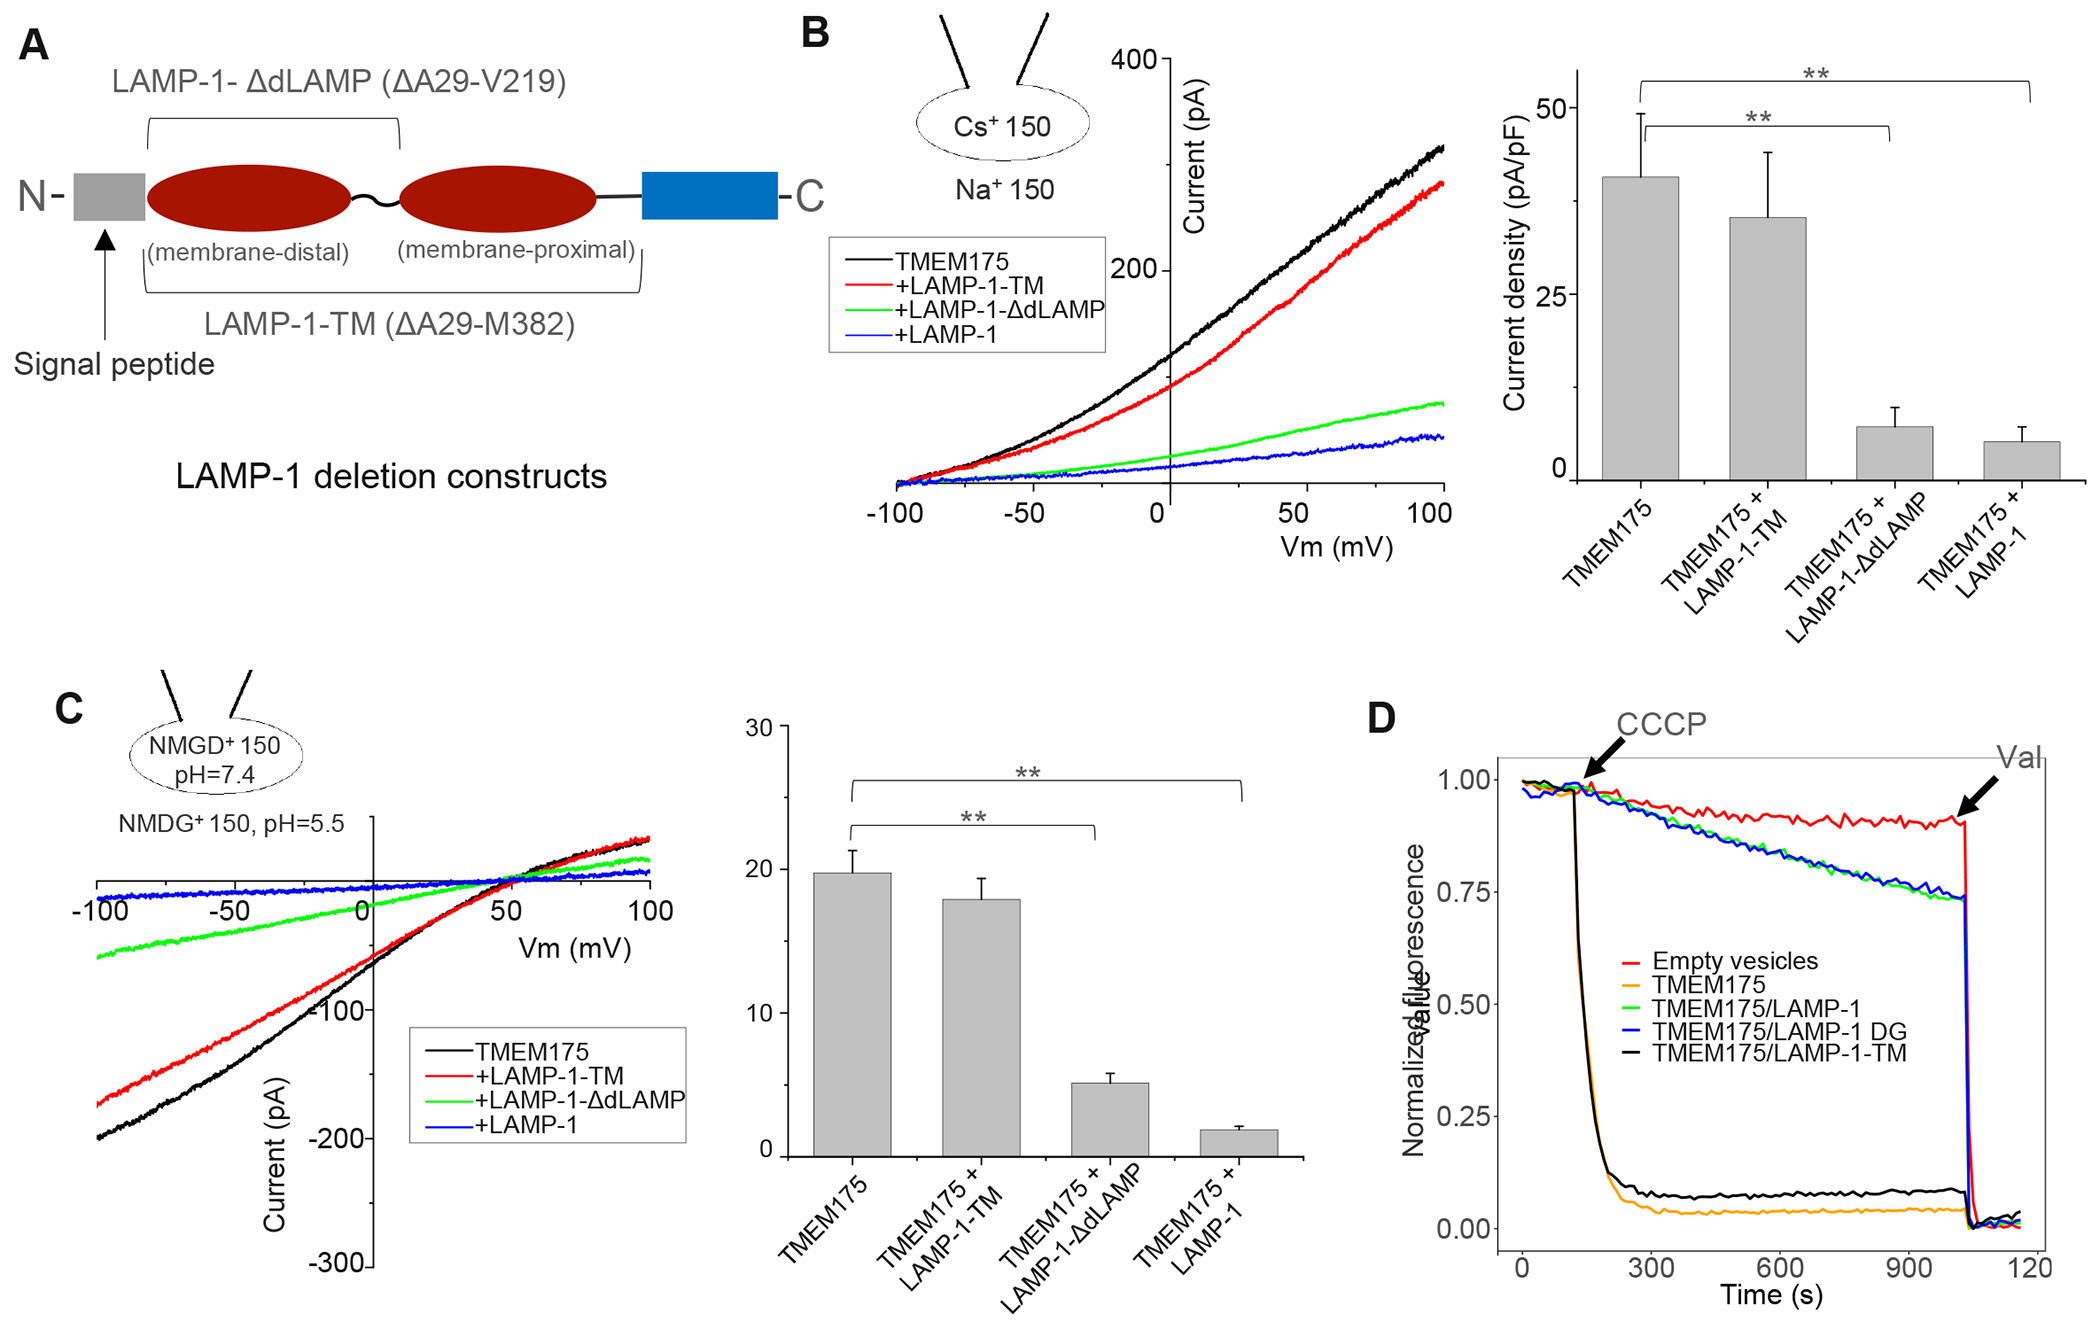
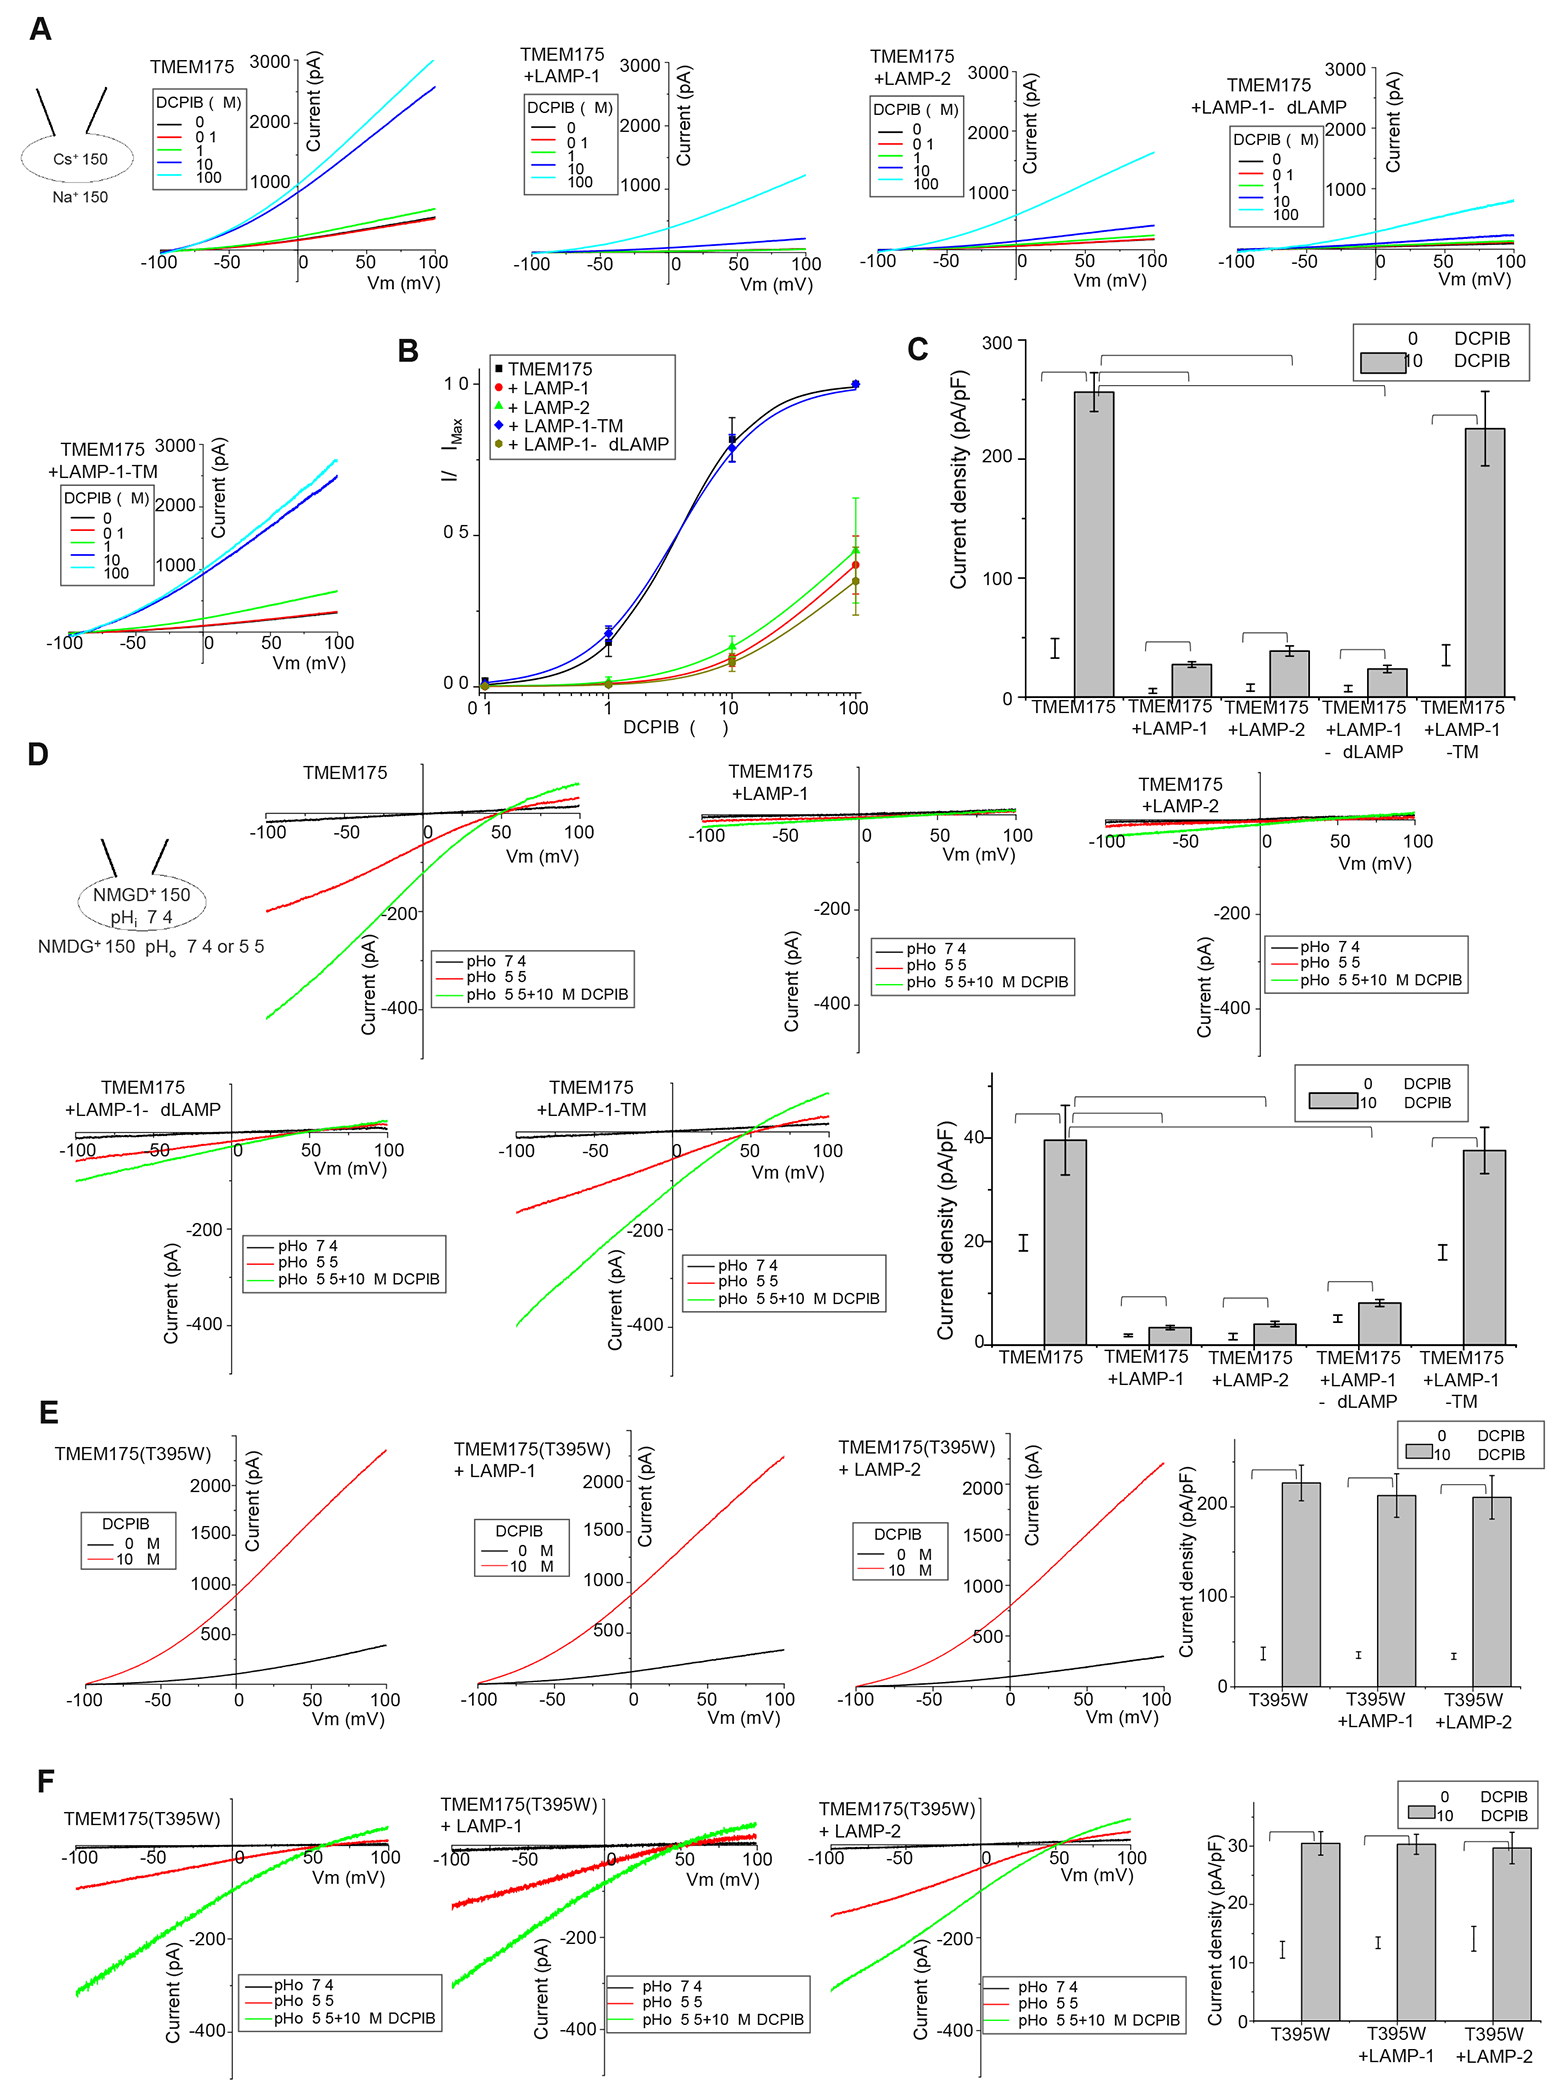
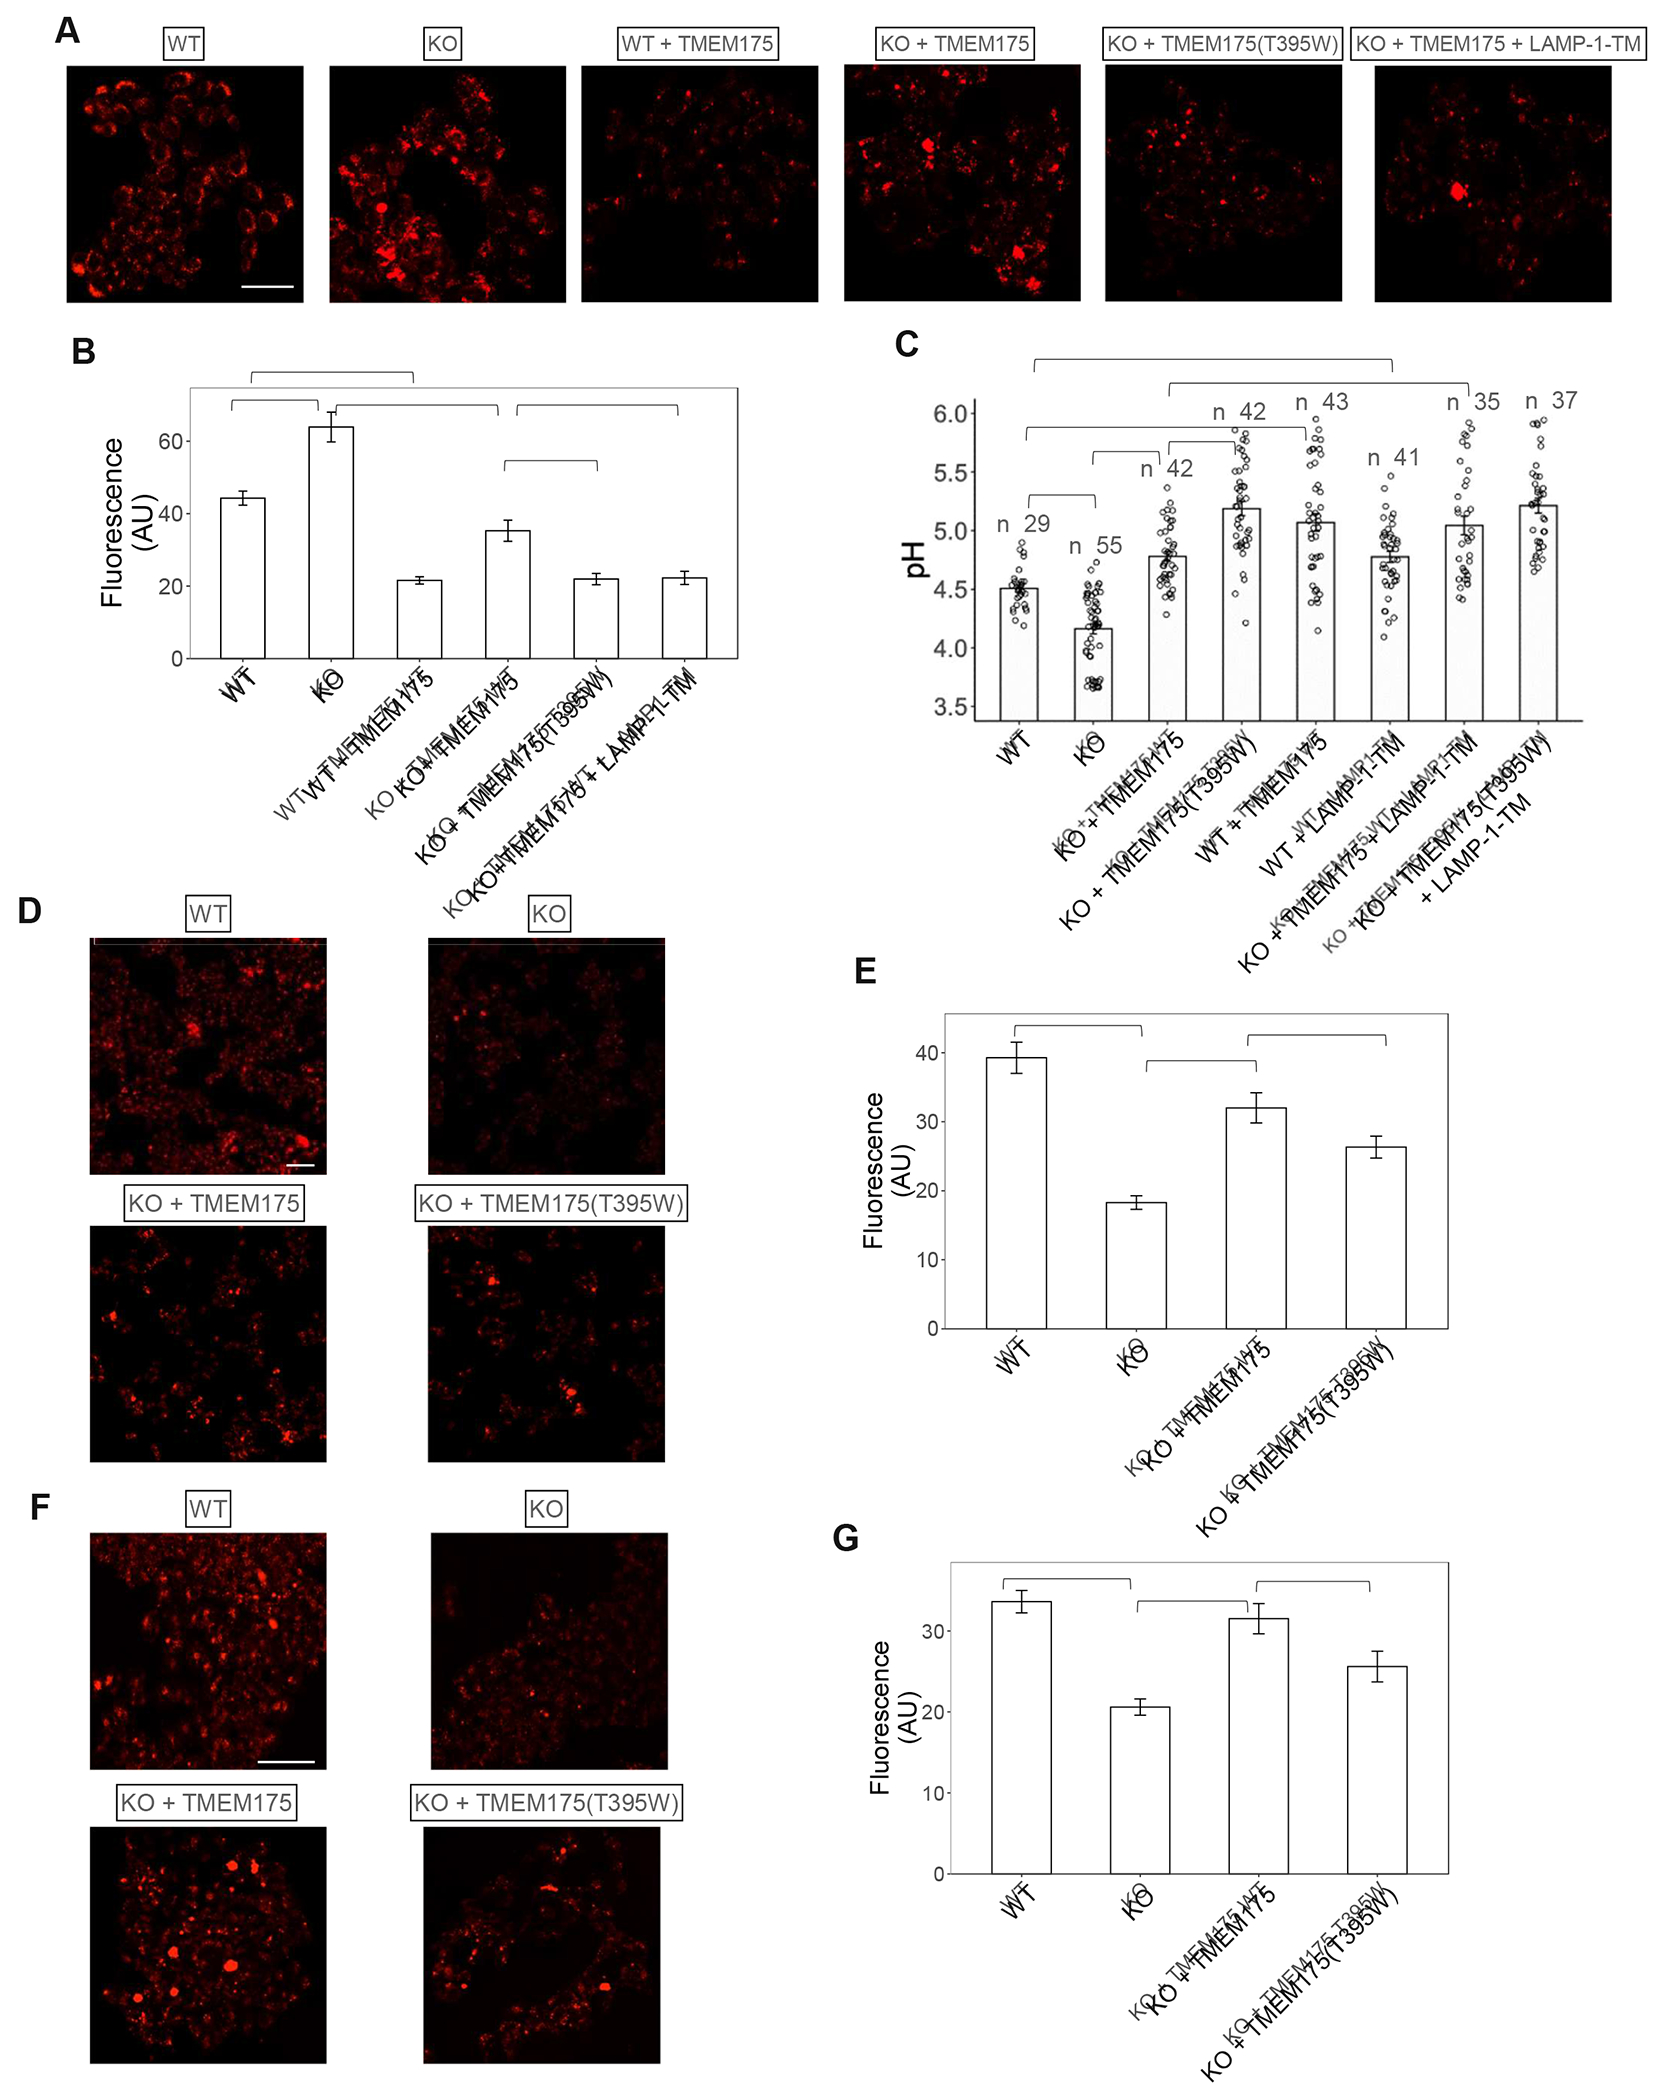
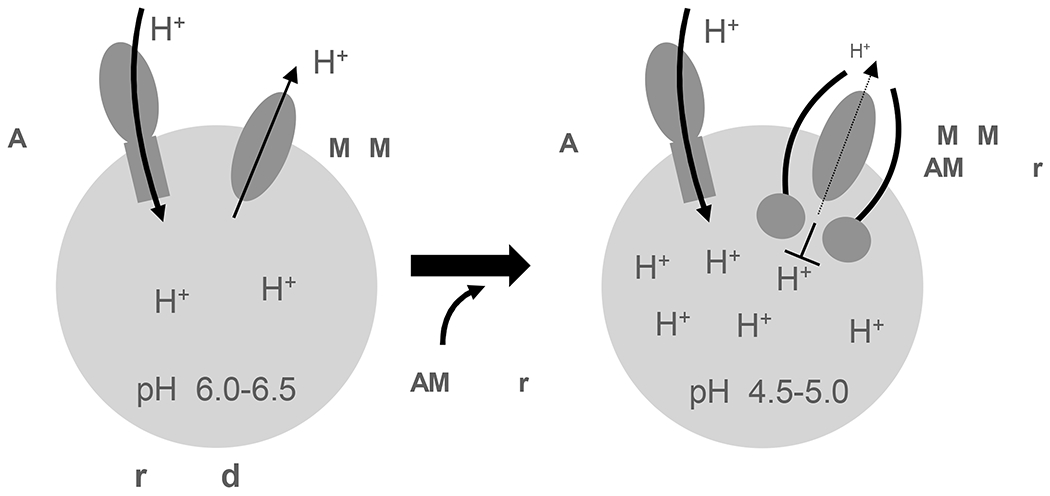
Maintaining a highly acidic lysosomal pH is central to cellular physiology. Here, we use functional proteomics, single-particle cryo-EM, electrophysiology, and in vivo imaging to unravel a key biological function of human lysosome-associated membrane proteins (LAMP-1 and LAMP-2) in regulating lysosomal pH homeostasis. Despite being widely used as a lysosomal marker, the physiological functions of the LAMP proteins have long been overlooked. We show that LAMP-1 and LAMP-2 directly interact with and inhibit the activity of the lysosomal cation channel TMEM175, a key player in lysosomal pH homeostasis implicated in Parkinson's disease. This LAMP inhibition mitigates the proton conduction of TMEM175 and facilitates lysosomal acidification to a lower pH environment crucial for optimal hydrolase activity. Disrupting the LAMP-TMEM175 interaction alkalinizes the lysosomal pH and compromises the lysosomal hydrolytic function. In light of the ever-increasing importance of lysosomes to cellular physiology and diseases, our data have widespread implications for lysosomal biology.

Keywords: LAMP-1 and LAMP-2; TMEM175; lysosomal LAMP proteins; lysosomal hydrolytic function; lysosomal pH homeostasis; lysosome acidification; risk factor for Parkinson’s disease.


Conflict of interest statement

Declaration of interests The authors declare no competing interests.

Figures

Figure 1.
Figure 1.. Identification of LAMP-1 and LAMP-2 as TMEM175-interacting proteins.
(A) Workflow of the proteomic screening of TMEM175-interacting proteins. (B) Lists of putative TMEM175-interacting proteins identified from the pull-down samples from HEK293 and SH-SY5Y cells. (C) Co-immunoprecipitation (Co-IP) of TMEM175 and LAMP proteins in native SH-SY5Y cells. LAMP-1 and 2 were immunoprecipitated by respective antibodies and TMEM175 was detected in the IP samples by immunoblotting (IB). Numbers beside each gel mark the molecular weights in kDa. (D) Co-IP of TMEM175 and LAMP proteins in HEK293 cells expressing FLAG-tagged TMEM175. TMEM175 was immunoprecipitated by anti-FLAG antibodies and LAMP-1 and 2 were detected in the IP sample. (E) Co-IP of TMEM175 and LAMP proteins in HEK293 cells co-expressing untagged TMEM175 and FLAG-tagged LAMP-1 or 2. Overexpressed LAMP-1 or 2 were immunoprecipitated by anti-FLAG antibodies and TMEM175 was detected in the IP samples. (F) 2-D gel electrophoresis (BN-PAGE and SDS-PAGE) of SH-SY5Y cell lysate. Anti-LAMP-1, LAMP-2, and TMEM175 antibodies were used for immunoblotting. (G) 2-D gel electrophoresis of SH-SY5Y cell lysate after mobility shift by anti-LAMP-1 or LAMP-2 antibodies. (H) Gel filtration profiles and SDS-PAGEs of purified TMEM175/LAMP-1 (upper panel) and TMEM175/LAMP-2 (lower panel) complexes. The profiles of TMEM175 (blue) are also shown for comparison. See also Figure S1, Figure S2, and Table S1.
Figure 2.
Figure 2.. LAMP binding inhibits the channel activity of TMEM175.
(A) Sample I-V curves of HEK293 cells expressing TMEM175 with LAMP-1 or 2. Outward Cs+ currents were recorded using whole-cell patch clamp at pH 7.4 with 150 mM Na+ in the bath (extracellular/luminal) and 150 mM Cs+ in the pipette (cytosolic). (B) Cs+ current density of TMEM175 with or without LAMP-1 or 2 co-expression measured at 100 mV in whole-cell recordings. Data are represented as mean ± SEM (n=10, *** p <0.001, **p <0.01). (C) Luminal acidic pH activation of TMEM175. Upper panel: sample traces of inward proton currents recorded at −100 mV with lowering bath pH. Lower panel: sample I-V curves at various bath pHs indicating the change of channel selectivity. For pH activation, Na+ was replaced by NMDG+ in low-pH bath solutions. (D) Luminal acidic pH activation and I-V curves of TMEM175 co-expressing with LAMP-1. (E) Luminal acidic pH activation and I-V curves of TMEM175 co-expressing with LAMP-2. (F) Proton current density of TMEM175 with or without LAMP-1 or 2 co-expression measured at −100 mV with bath pH of 3.5 in whole-cell recordings. Data are represented as mean ± SEM (n=10, *** p <0.001, ** p <0.01). (G) K+ flux assay using proteoliposomes containing TMEM175 or TMEM175/LAMP complexes. K+ flux was initiated by adding H+ ionophore carbonyl cyanide m-chlorophenylhydrazone (CCCP) and terminated by adding K+ ionophore valinomycin (Val). The assay was repeated 3 times with consistent results. See also Figure S3.
Figure 3.
Figure 3.. Structure of TMEM175 in complex with LAMP-1.
(A) Overall structure of TMEM175/LAMP-1 complex consisting of two TMEM175 and two LAMP-1 subunits. EM map (grey) for the TM region is contoured at 4σ. The weak density from the proximal LAMP domain is contoured 2σ after a local resolution filter. (B) Inter-molecular interaction between LAMP-1 TM domain (magenta) and TMs 10 and 11 of TMEM175 (orange). (C) Sequence comparison of the TM domains between LAMP-1 and 2. (D) Comparison between the previously determined TMEM175 structure in a putative open conformation (green, PDB code 6WC9) and TMEM175 in complex with LAMP-1 (orange). (E) Structural comparison of the pore-forming TMs 1 and 7 between the two structures in (D). I46 and I271 form the central constriction of the ion pathway. (F) Co-IP of LAMP proteins and TMEM175 or its T395W mutant in HEK293 cells co-expressing un-tagged TMEM175 or T395W mutant and FLAG-tagged LAMP-1 or 2. Anti-FLAG antibodies were used for immunoprecipitation. Only WT TMEM175 but not its T395W mutant was detected in the IP samples, indicating that the mutation disrupts the interaction between TMEM175 and LAMP proteins. (G) Sample I-V curves and Cs+ current density (at 100 mV) of HEK293 cells expressing TMEM175(T395W) mutant with or without LAMP-1 or 2. The Cs+ currents were recorded at pH 7.4 with 150 mM Na+ in the bath (extracellular) and 150 mM Cs+ in the pipette. Data are represented as mean ± SEM (n=10). (H) Sample I-V curves and proton current density (at −100 mV) of the mutant with or without LAMP-1 or 2. The proton currents were recorded with pH 5.5 in the bath and pH 7.4 in the pipette. NMDG+ was used as monovalent in both bath and pipette solutions. Data are represented as mean ± SEM (n=10). See also Figure S4.
Figure 4.
Figure 4.. Effect of LAMP-1 truncation on TMEM175 inhibition.
(A) Constructs of the two LAMP-1 deletion mutants. Brackets mark the deleted regions. (B) Sample I-V curves and Cs+ current density (at 100 mV) of HEK293 cells expressing TMEM175 with LAMP-1 or its truncation mutants. The Cs+ currents were recorded in whole-cell configuration at pH 7.4. Data are represented as mean ± SEM (n=10, ** p <0.01). (C) Sample I-V curves and proton current density (at −100 mV) of TMEM175 in complex with LAMP-1 or its truncation mutants. The proton currents were recorded with pH 5.5 in the bath and pH 7.4 in the pipette. NMDG+ was used as monovalent in both bath and pipette solutions. Data are represented as mean ± SEM (n=10, ** p <0.01). (D) K+ flux assay using proteoliposomes containing TMEM175, TMEM175/LAMP-1 before or after de-glycosylation (DG), or TMEM175/LAMP-1-TM. See also Figure S5 and S6.
Figure 5.
Figure 5.. LAMP binding antagonizes DCPIB activation of TMEM175.
(A) Sample I-V curves of Cs+ currents from TMEM175 at various DCPIB concentrations. TMEM175 was expressed in HEK293 cells alone or with LAMP-1, LAMP-2, or LAMP-1 deletion mutant. Outward Cs+ currents were recorded using whole-cell patch clamp at pH 7.4. (B) Concentration-dependent DCPIB activation of TMEM175 or TMEM175 in complex with various LAMP protein constructs at 100 mV. Data for DCPIB activation of TMEM175 and TMEM175/LAMP-1-TM complex were normalized against their respective currents at 100 μM DCPIB and were fitted to the Hill equation with EC50=3.6±0.3 μM, n=1.4±0.1 for TMEM175 and EC50=3.5±0.2 μM, n=1.2±0.1 for TMEM175/LAMP-1-TM complex. With markedly reduced currents and lower DCPIB efficacy of TMEM175 upon LAMP inhibition, all data from TMEM175 in complex with LAMP-1, LAMP-2, or LAMP-1-ΔdLAMP were normalized against the averaged TMEM175 currents at 100μM DCPIB. Data are represented as mean ± SEM (n=10 independent experiments). (C) Cs+ current density from TMEM175 and TMEM175 in complex with various LAMP constructs measured at 100 mV in whole-cell recordings with or without 10 μM DCPIB. Data are represented as mean ± SEM (n=10, *** p <0.001, ** p <0.01). (D) Sample I-V curves and proton current density (at −100 mV) from TMEM175 and TMEM175 in complex with various LAMP constructs recorded with or without 10 μM DCPIB. The proton currents were recorded with pH 7.4 (as background control) or 5.5 in the bath and pH 7.4 in the pipette. NMDG+ was used as monovalent in both bath and pipette solutions. Data are represented as mean ± SEM (n=10, *** p <0.001, ** p <0.01). (E) Sample I-V curves and Cs+ current density (at 100 mV) from TMEM175(T395W) mutant with or without LAMP-1 or 2 co-expression. The Cs+ currents were recorded at pH 7.4 with or without 10 μM DCPIB in the bath (extracellular). Data are represented as mean ± SEM (n=10, ** p <0.01). (F) Sample I-V curves and proton current density (at −100 mV) from TMEM175(T395W) mutant with or without LAMP-1 or 2 co-expression. The proton currents were recorded with pH 5.5 with or without 10 μM DCPIB in the bath. NMDG+ was used as monovalent in both bath and pipette solutions. Data are represented as mean ± SEM (n=10, ** p <0.01).
Figure 6.
Figure 6.. Lysosomal pH and hydrolytic activity measurements.
(A) Sample images of LysoTracker staining of WT and KO HAP1 cells expressing TMEM175 or its T395W mutant. (B) Averaged LysoTracker intensity per cell. Data are represented as mean ± SEM (n= 27-30 cells, *** p <0.001). (C) Lysosomal pH in WT and KO HAP1 cells determined using ratiometric fluorescence imaging of Oregon Green 488 Dextran. Data are represented as mean ± SEM (n = number of cells per group, *** p <0.001, ** p <0.01). (D) & (E) Sample images of DQ-BSA-red staining and overall intensity in WT and KO HAP1 cells expressing TMEM175 or its T395W mutant. Data are represented as mean ± SEM (n= 30 cells, *** p <0.001). (F) & (G) Sample images Magic Red staining and overall intensity in WT and KO HAP1 cells expressing TMEM175 or its T395W mutant. Data are represented as mean ± SEM (n= 30 cells, *** p <0.001, * p <0.05). See also Figure S7.
Figure 7.
Figure 7.
Working model of LAMP-facilitated lysosomal acidification

References

    1. Luzio JP, Pryor PR, and Bright NA (2007). Lysosomes: fusion and function. Nat Rev Mol Cell Biol 8, 622–632. 10.1038/nrm2217. - DOI - PubMed
    1. De Duve C, and Wattiaux R (1966). Functions of lysosomes. Annu Rev Physiol 28, 435–492. 10.1146/annurev.ph.28.030166.002251. - DOI - PubMed
    1. Venkatachalam K, Wong CO, and Zhu MX (2015). The role of TRPMLs in endolysosomal trafficking and function. Cell Calcium 58, 48–56. 10.1016/j.ceca.2014.10.008. - DOI - PMC - PubMed
    1. Shen D, Wang X, Li X, Zhang X, Yao Z, Dibble S, Dong XP, Yu T, Lieberman AP, Showalter HD, and Xu H (2012). Lipid storage disorders block lysosomal trafficking by inhibiting a TRP channel and lysosomal calcium release. Nat Commun 3, 731. 10.1038/ncommsl735. - DOI - PMC - PubMed
    1. Kilpatrick BS, Yates E, Grimm C, Schapira AH, and Patel S (2016). Endo-lysosomal TRP mucolipin-1 channels trigger global ER Ca2+ release and Ca2+ influx. J Cell Sci 129, 3859–3867. 10.1242/jcs.190322. - DOI - PMC - PubMed

Publication types

MeSH terms

LinkOut - more resources