. 2023 Sep 6;111(17):2675-2692.e9.
doi: 10.1016/j.neuron.2023.05.032. Epub 2023 Jun 29.

Cortical somatostatin interneuron subtypes form cell-type-specific circuits

Affiliations

Cortical somatostatin interneuron subtypes form cell-type-specific circuits

Sherry Jingjing Wu et al. Neuron. .

Abstract

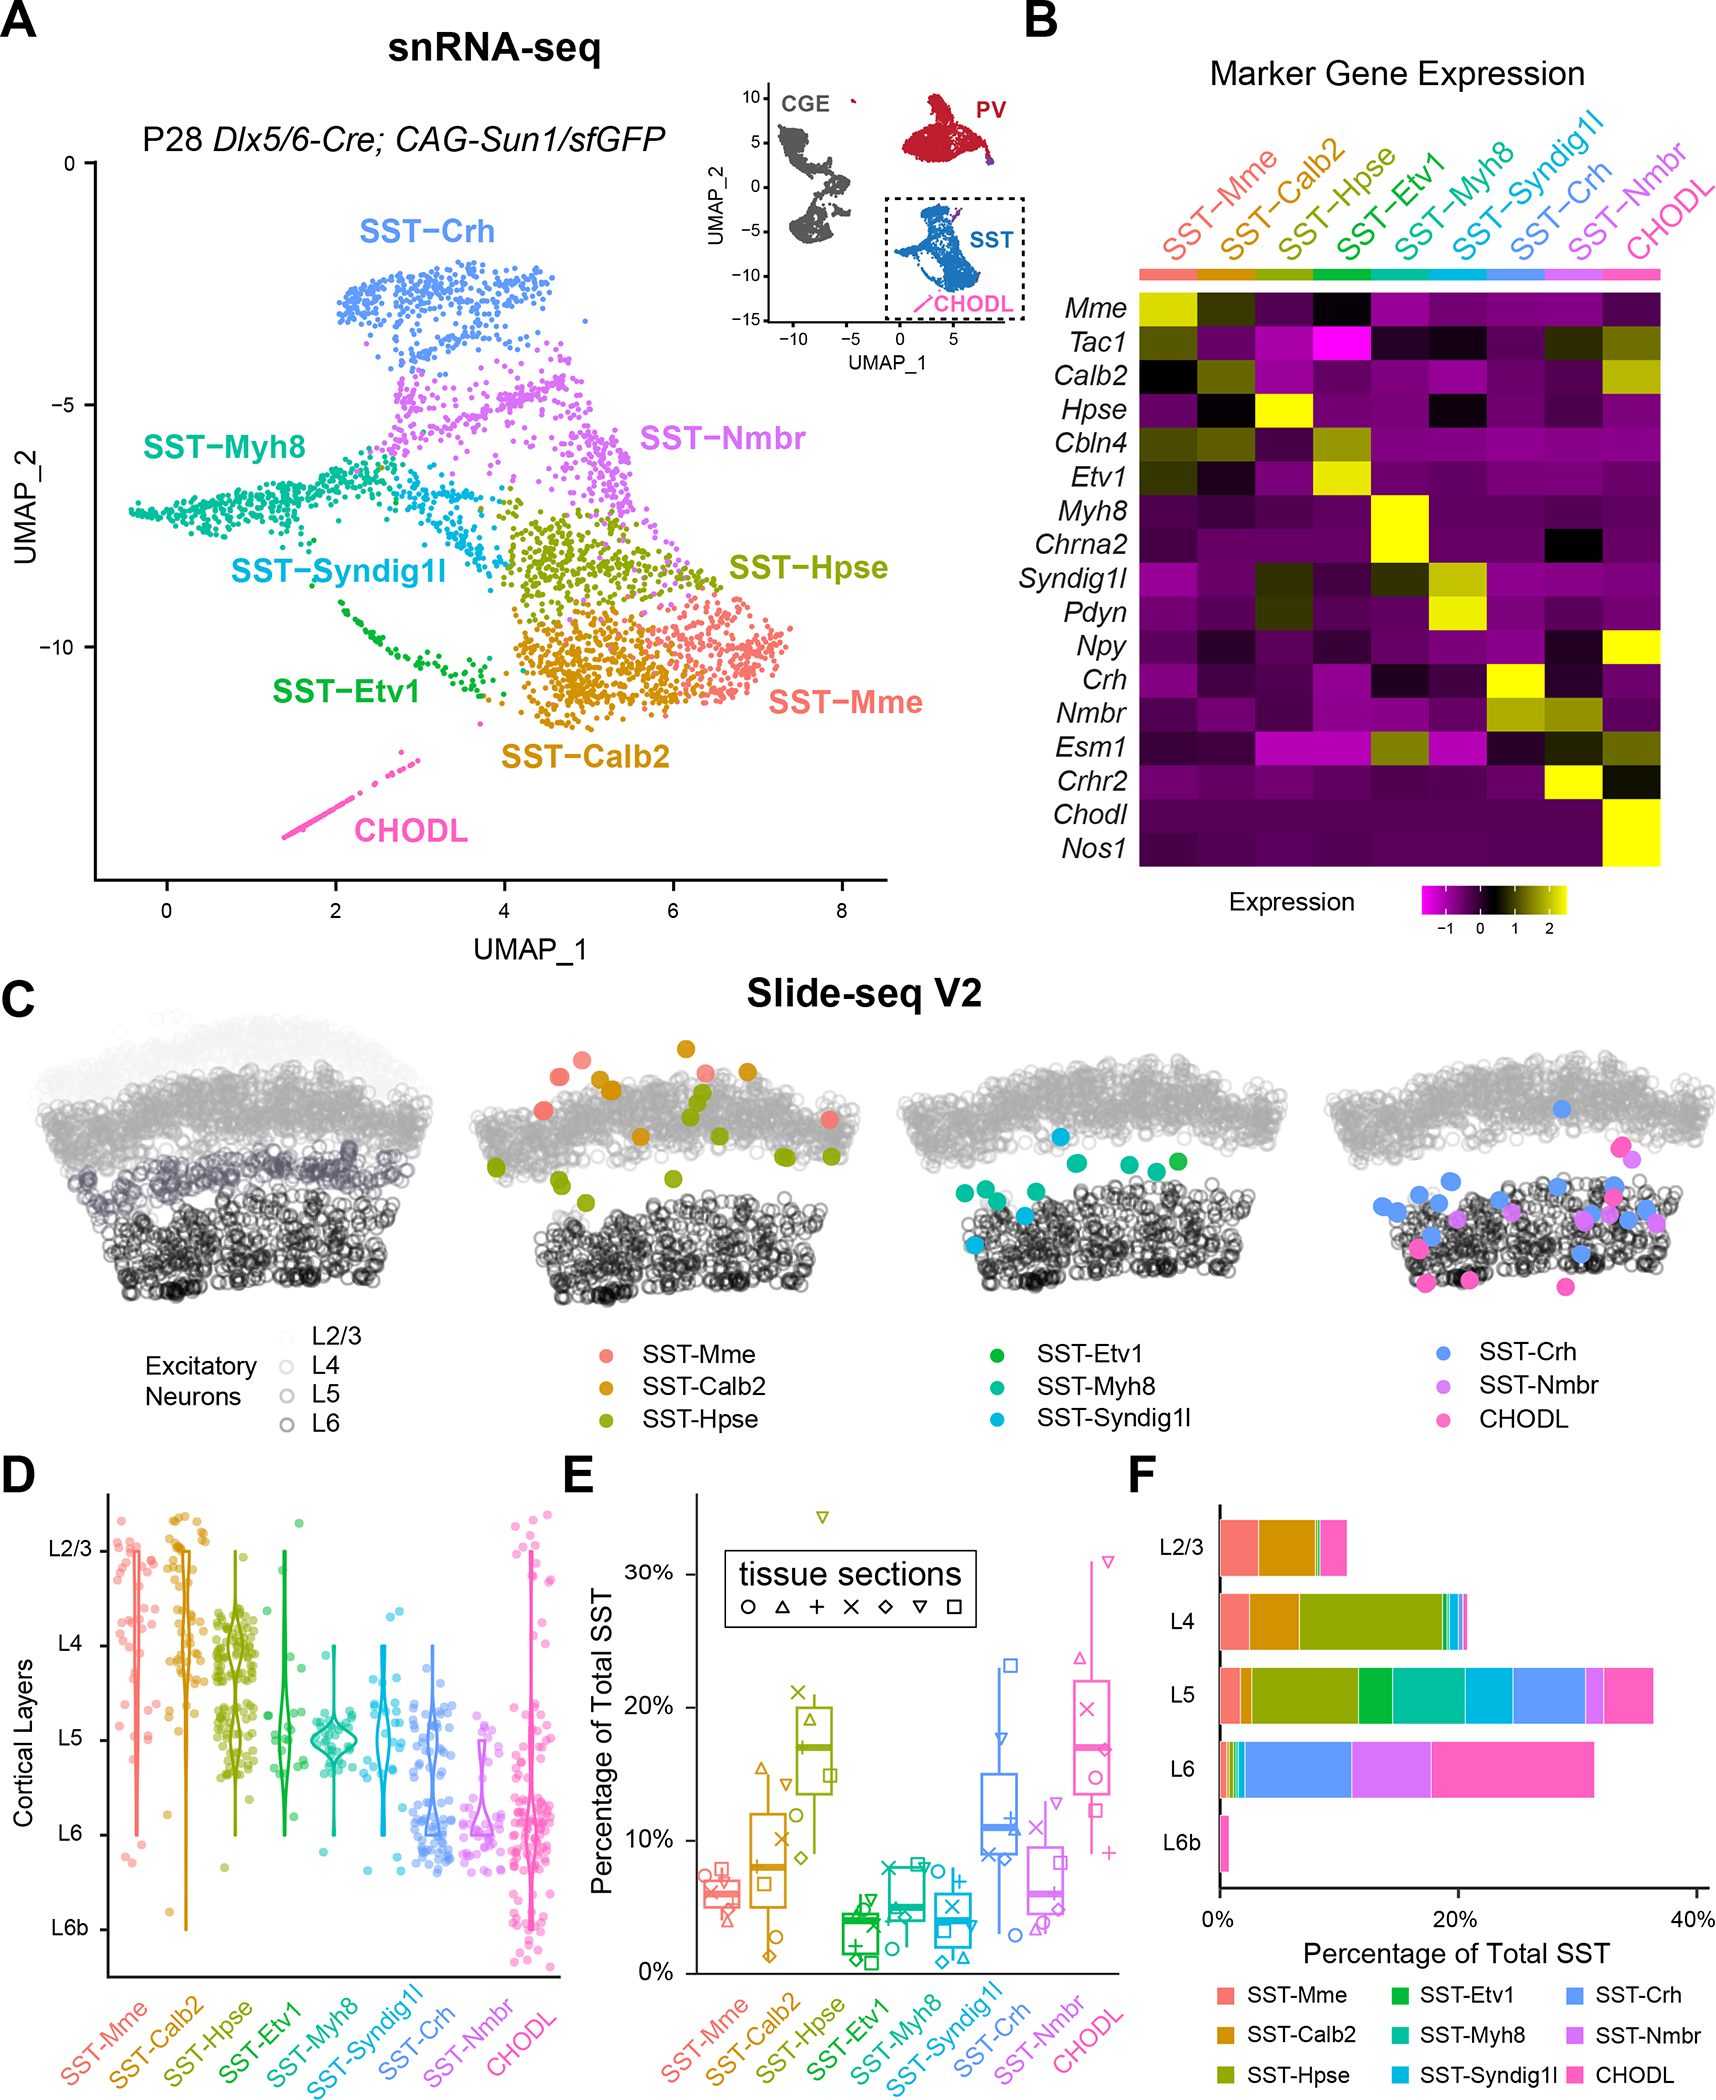
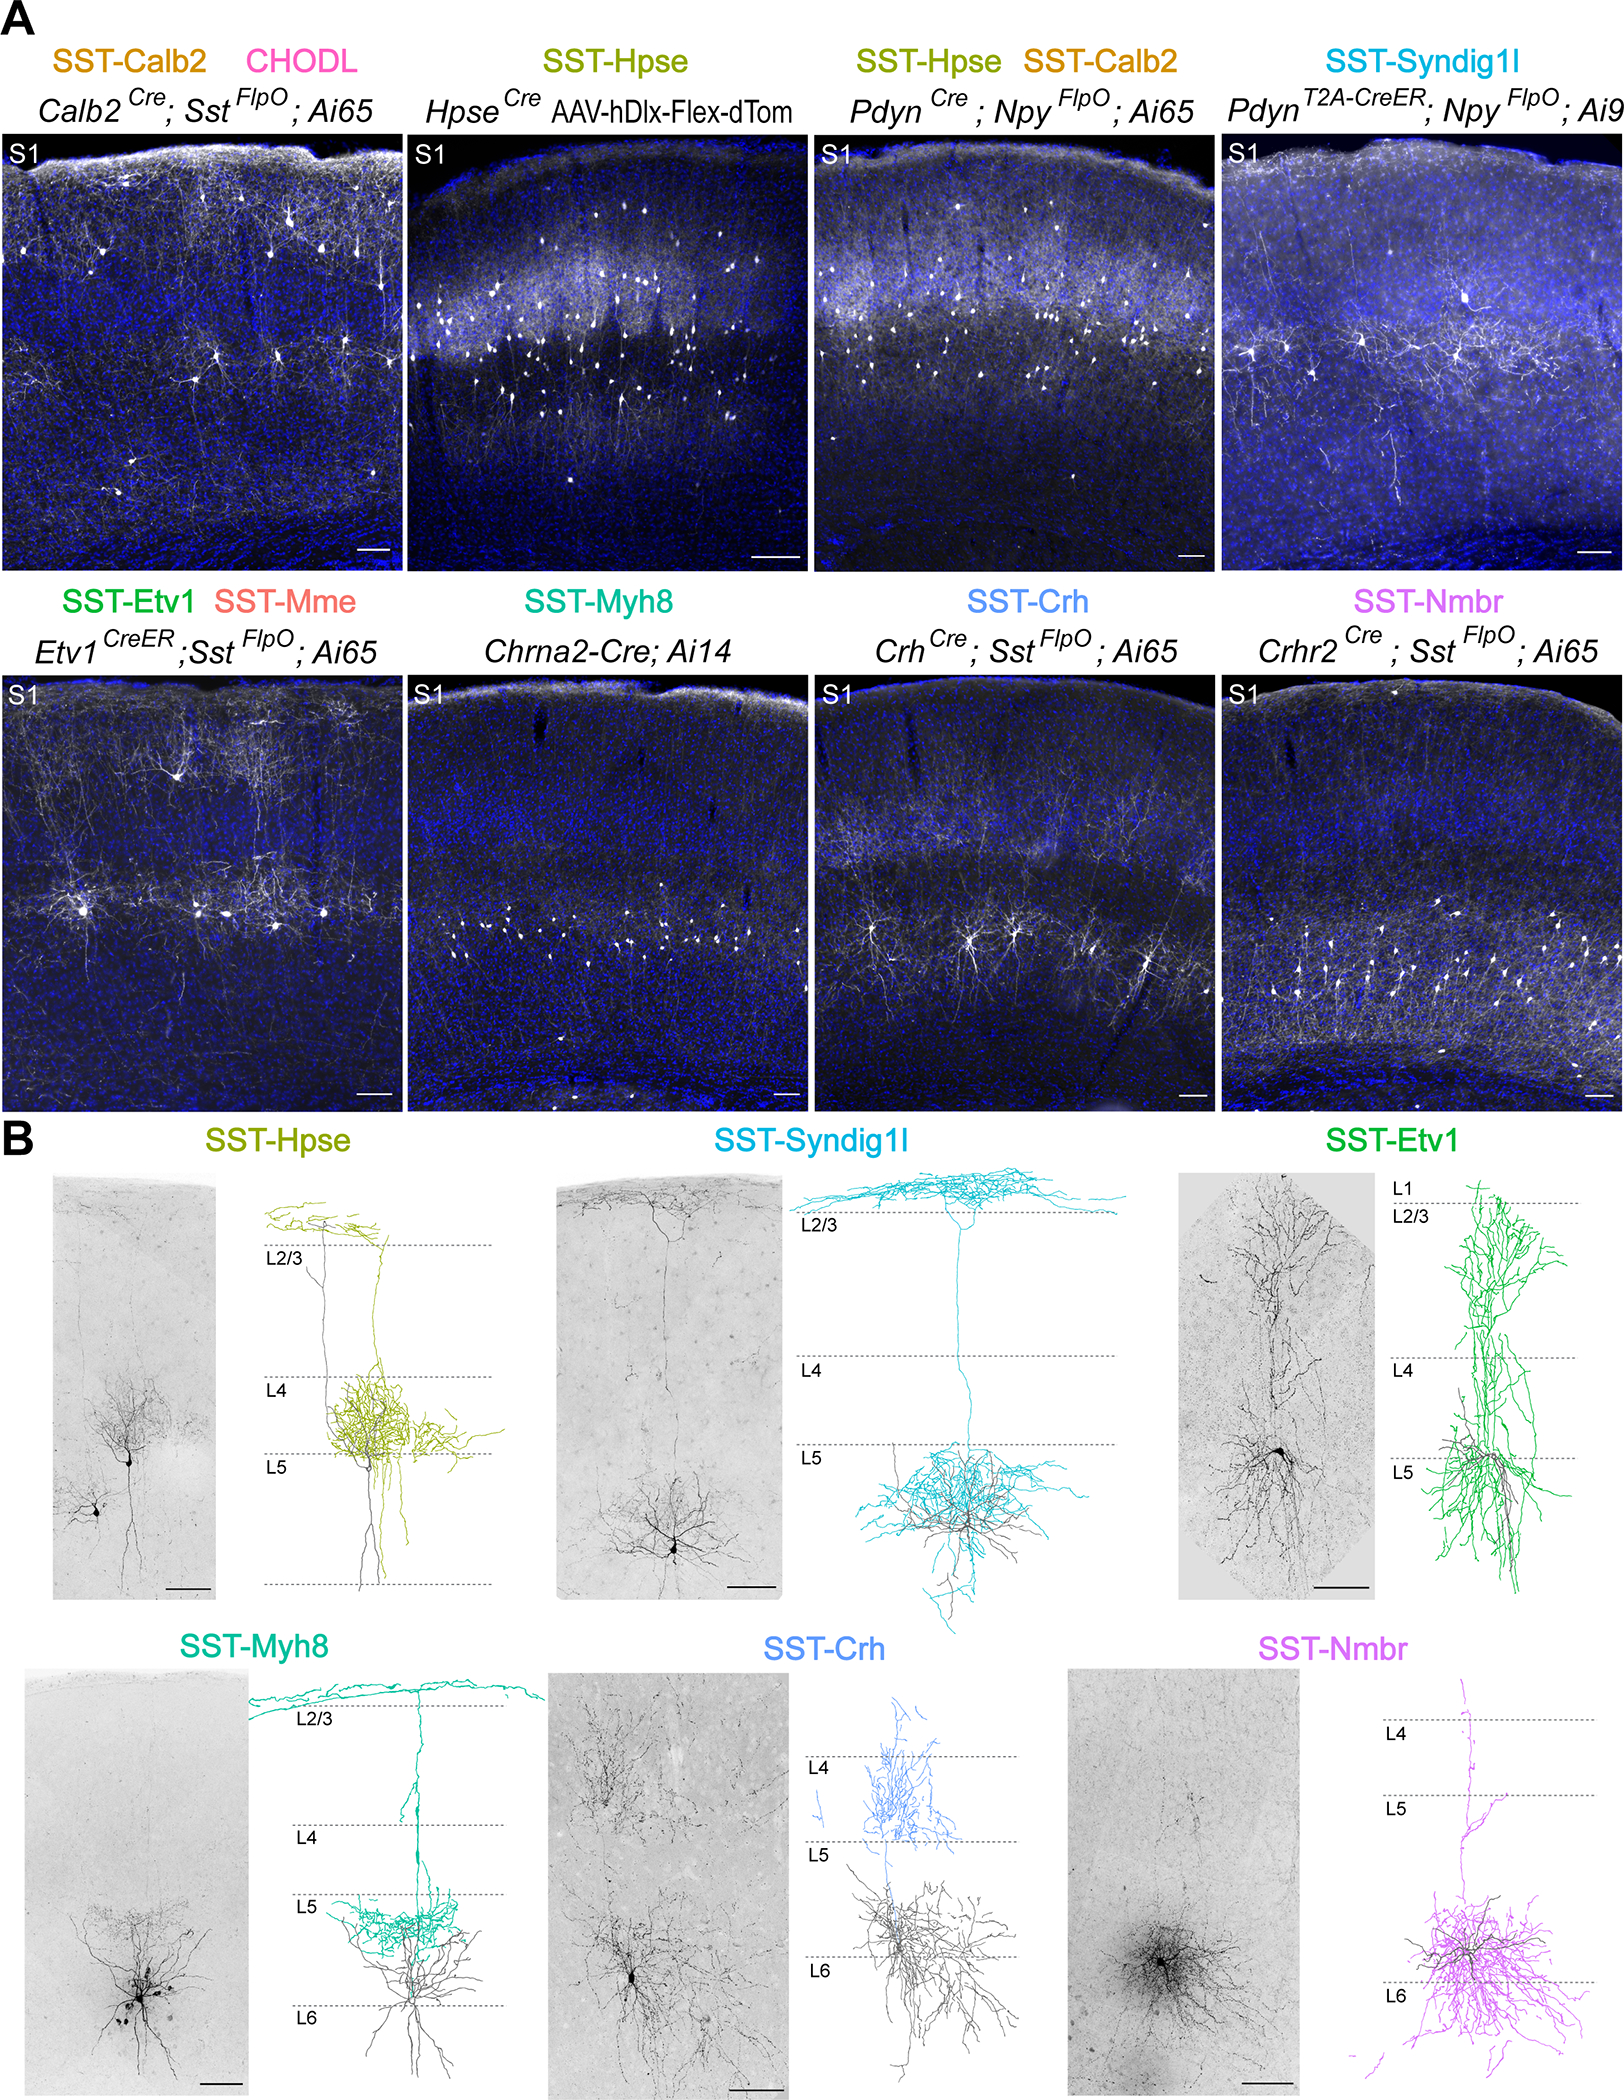
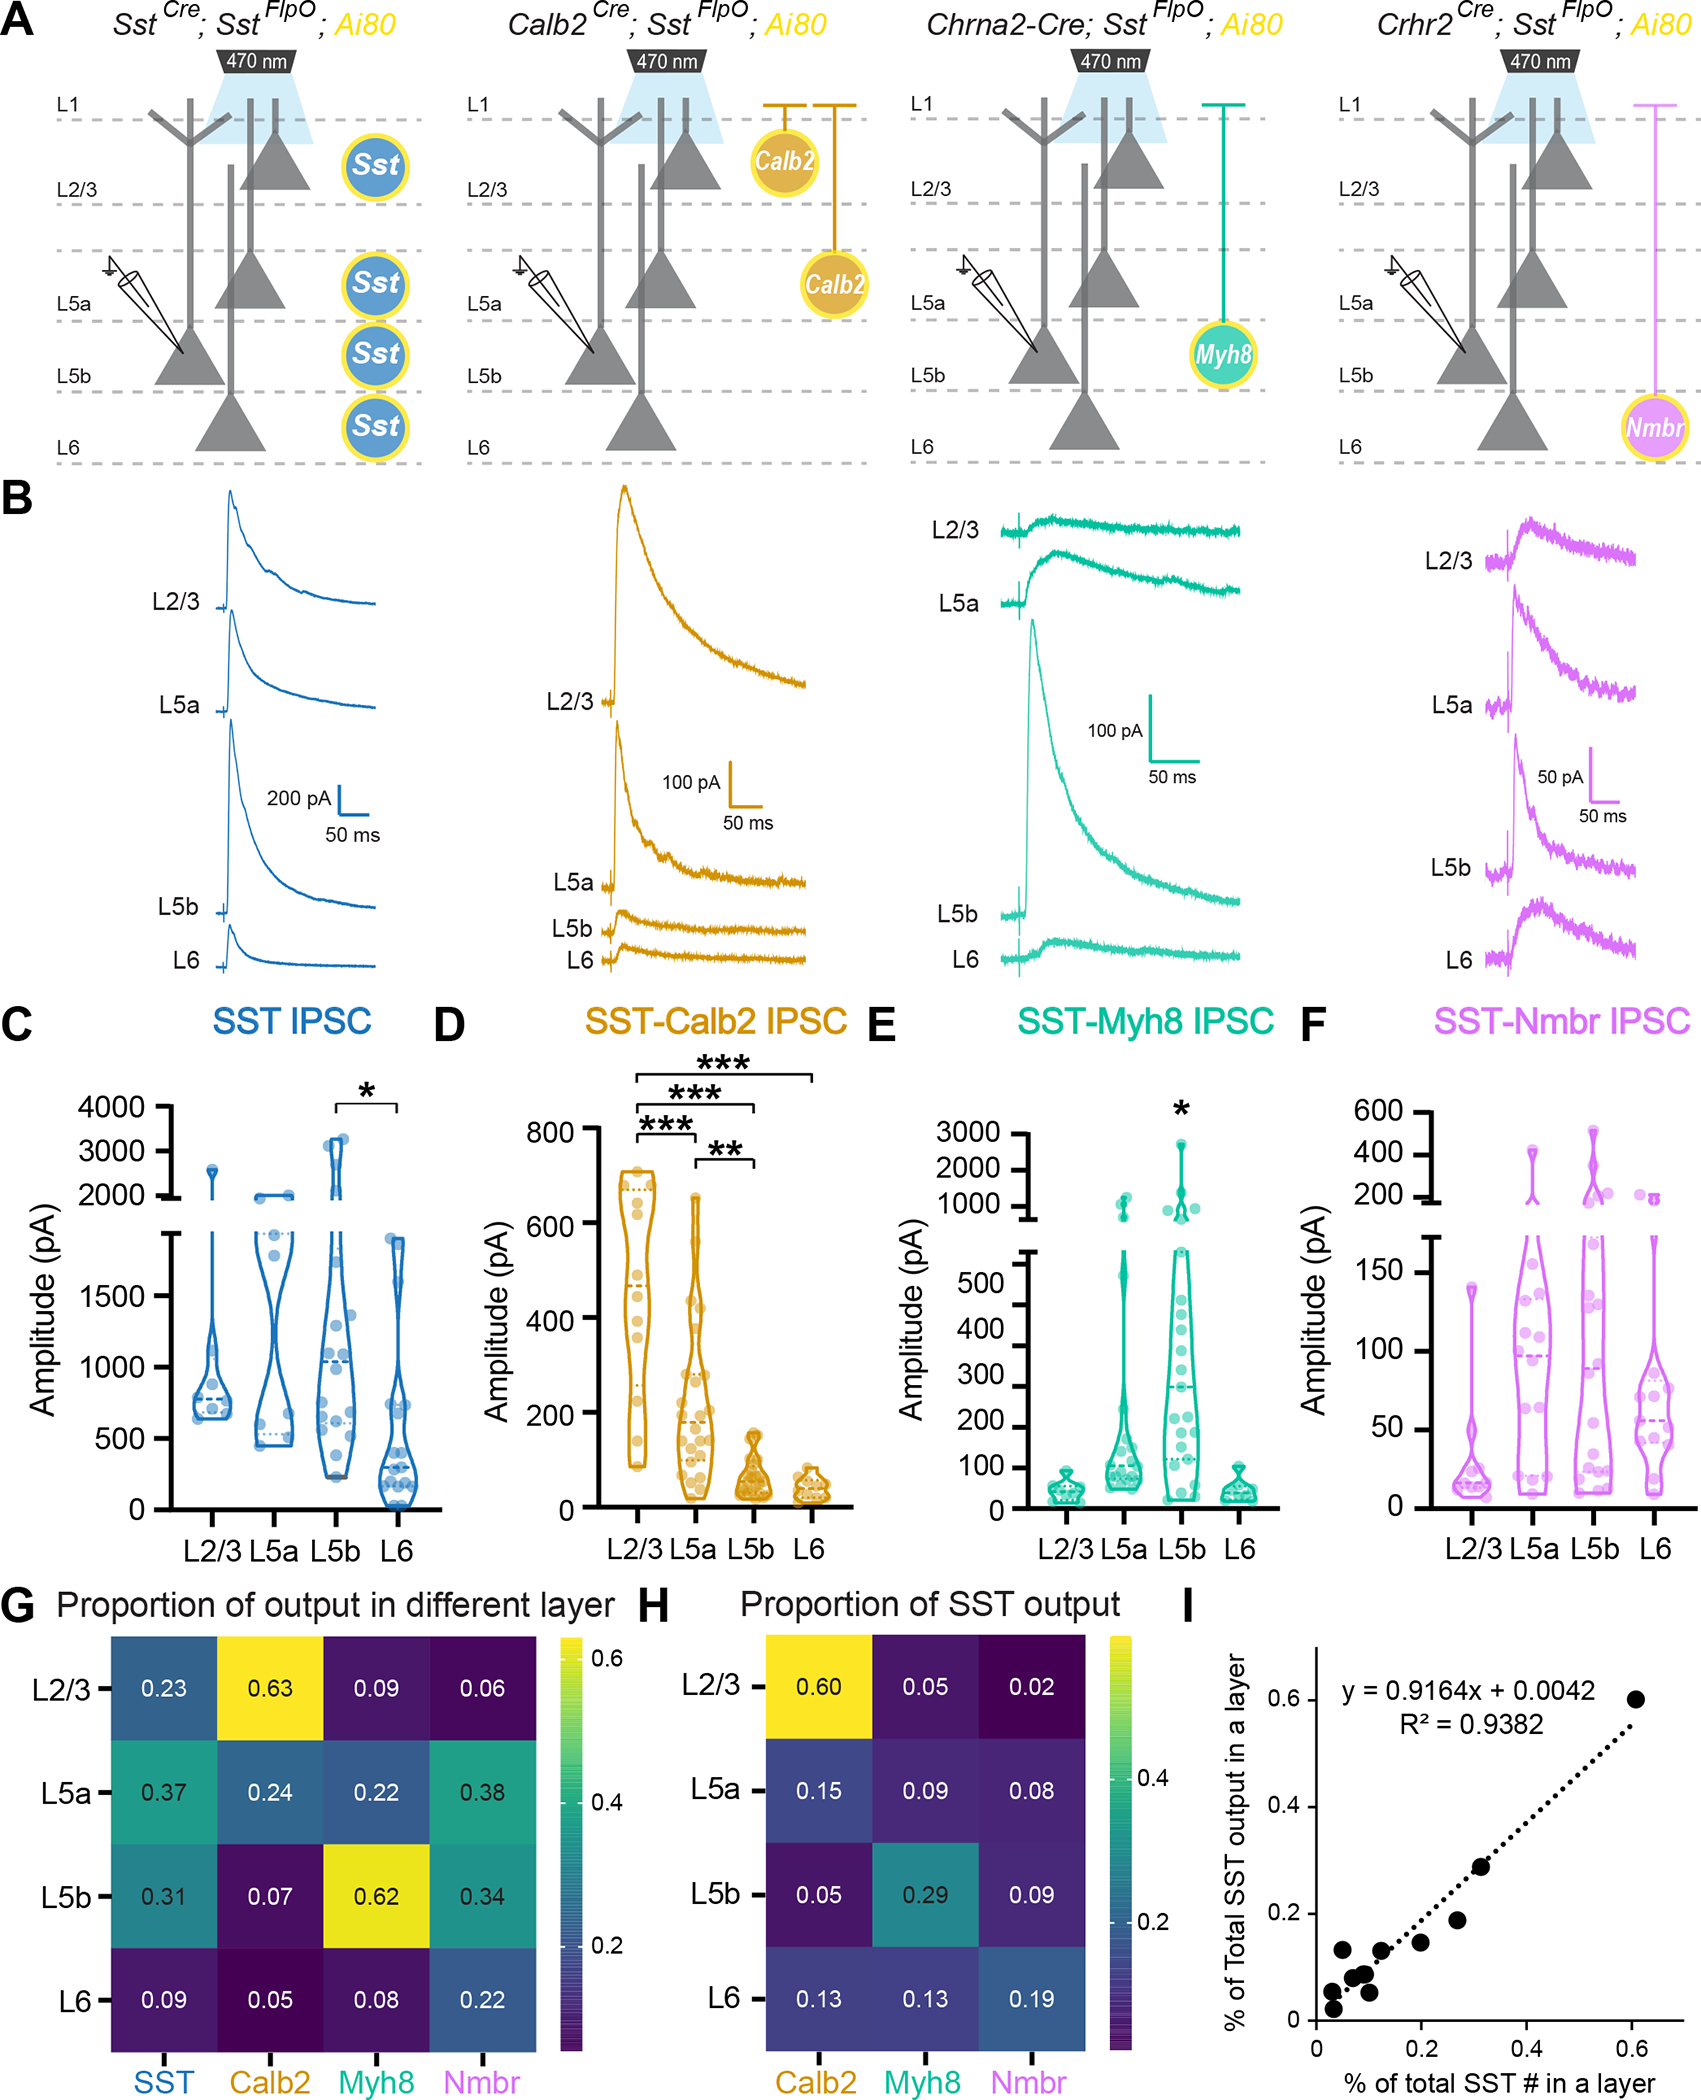
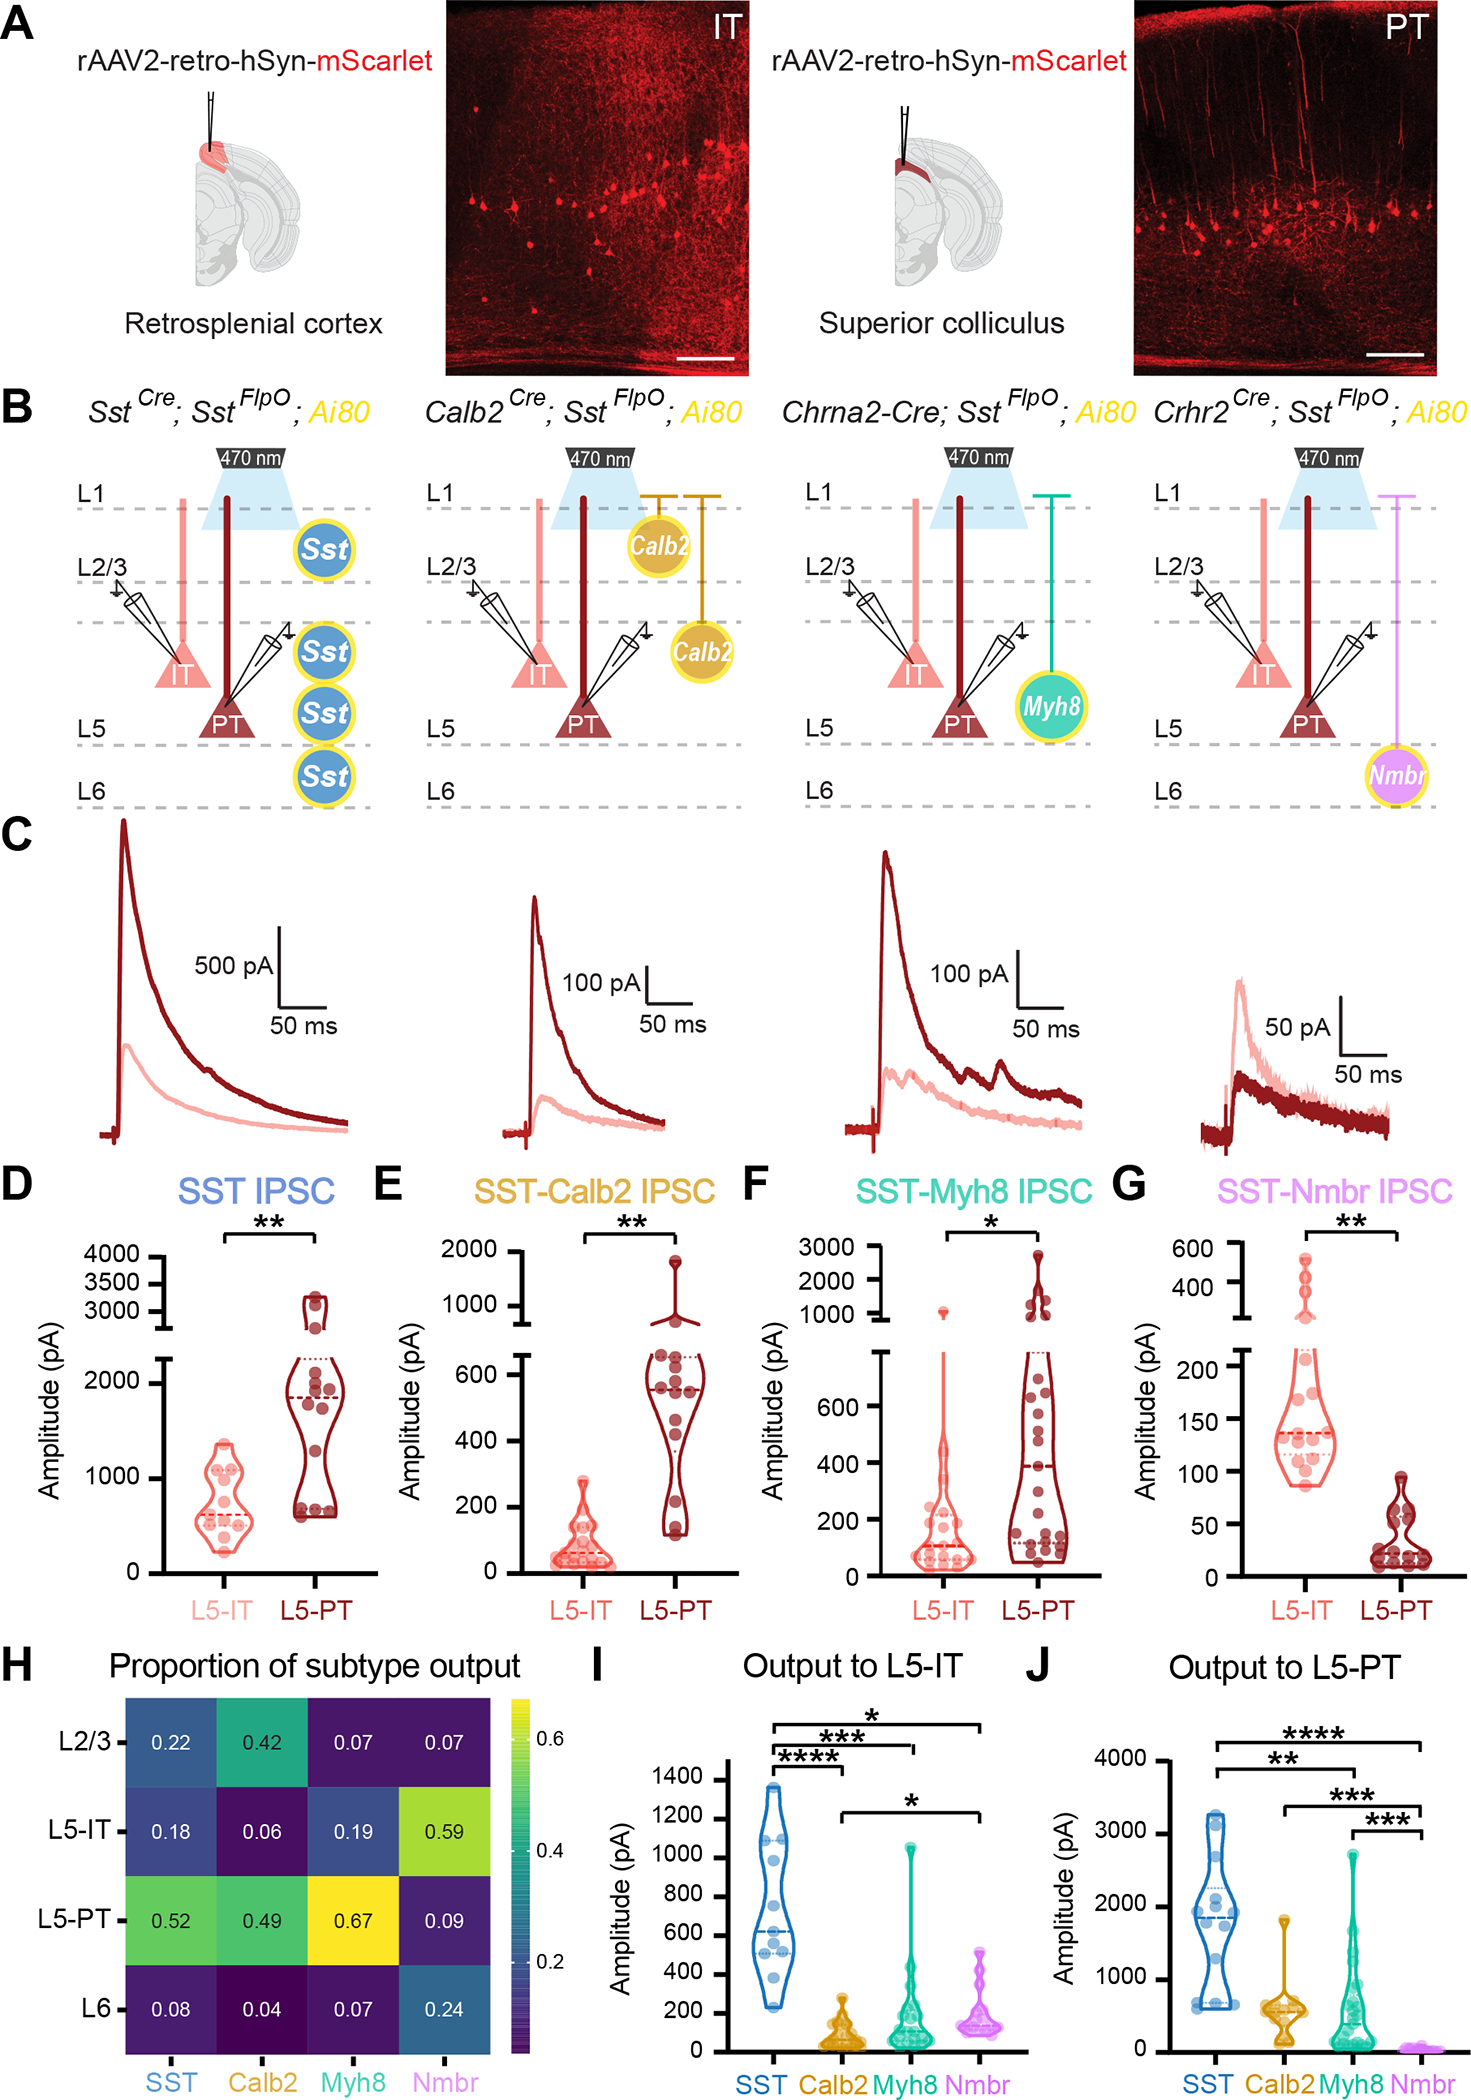
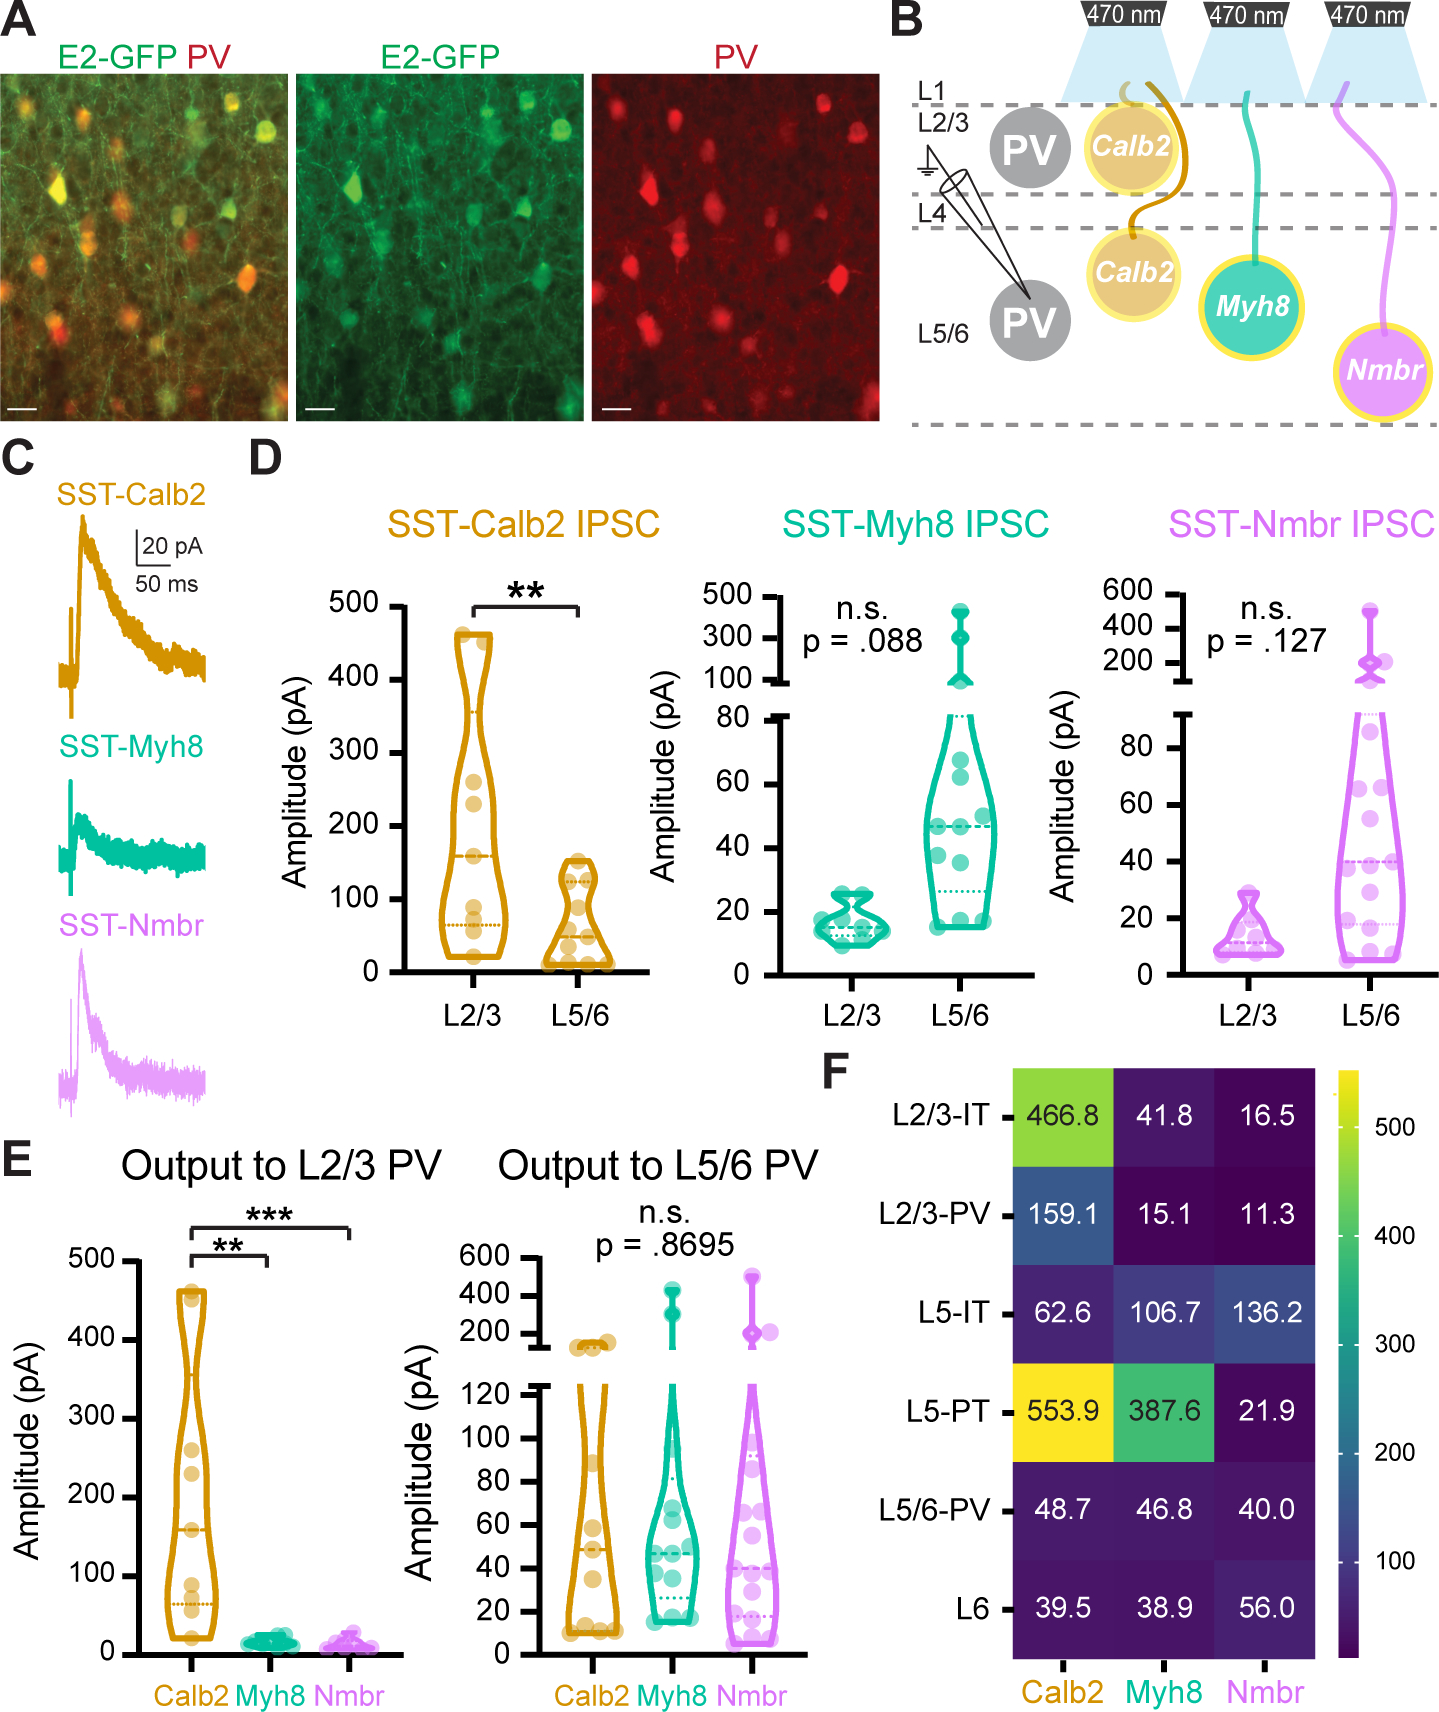
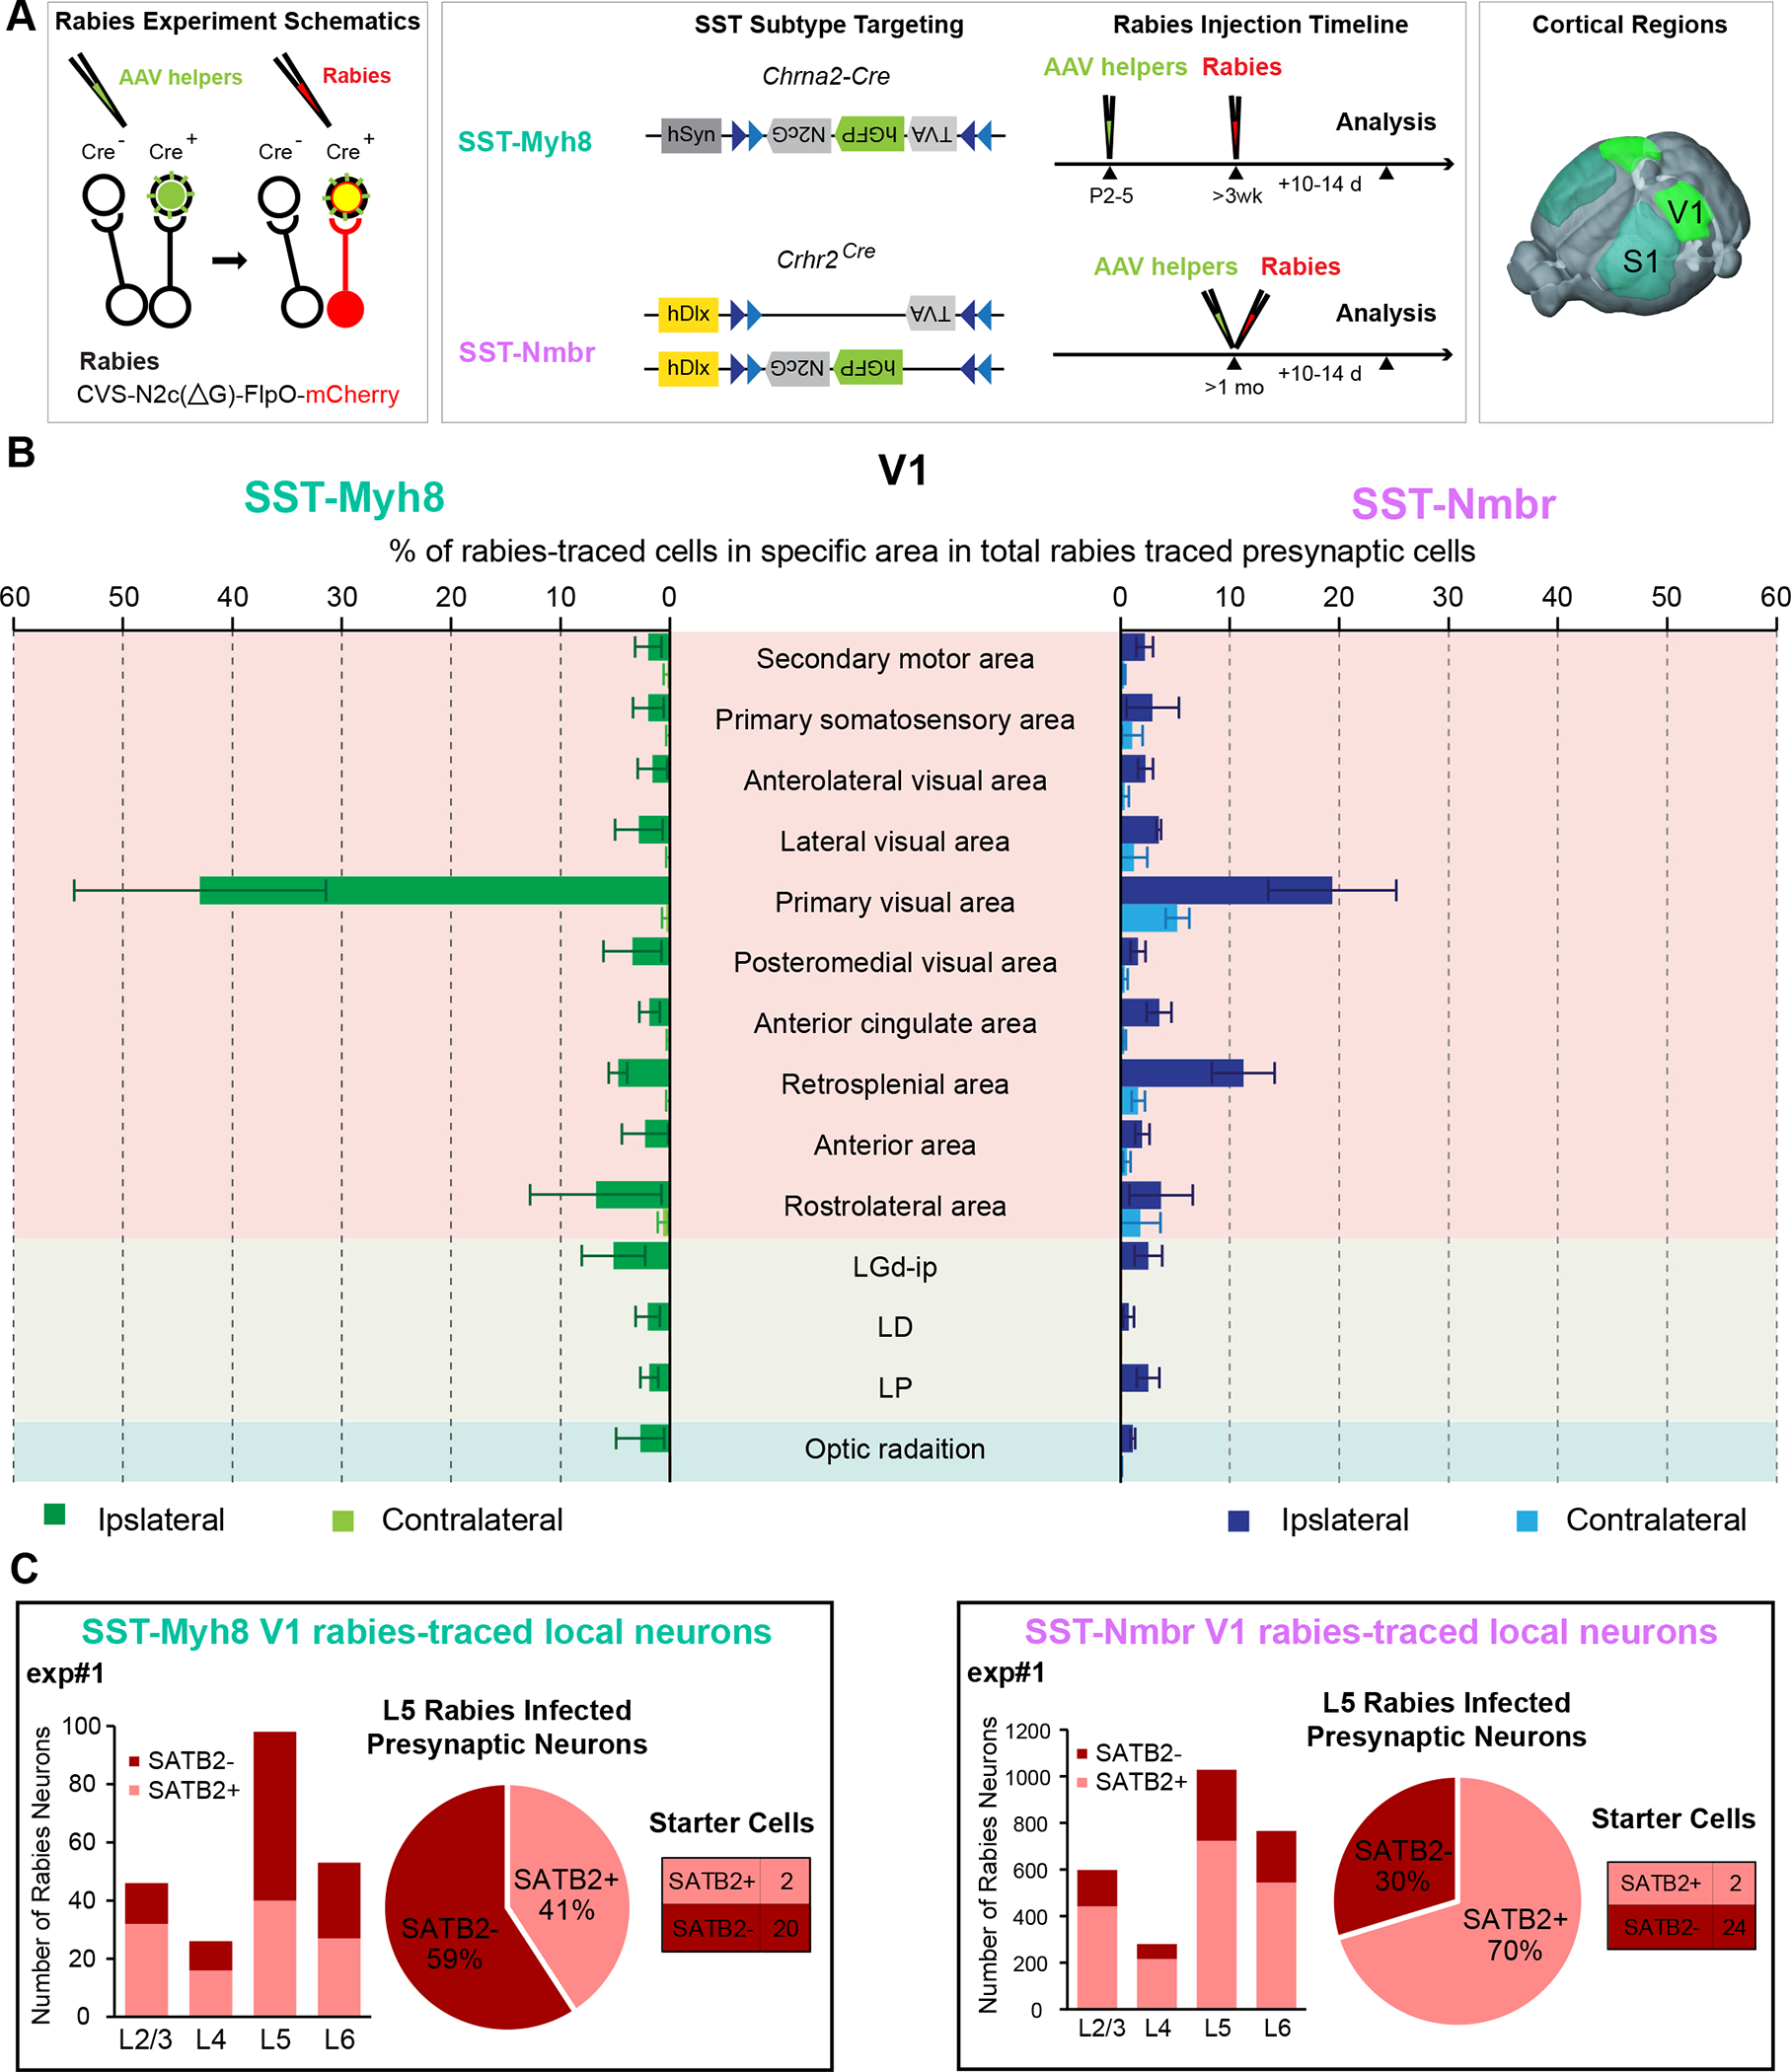
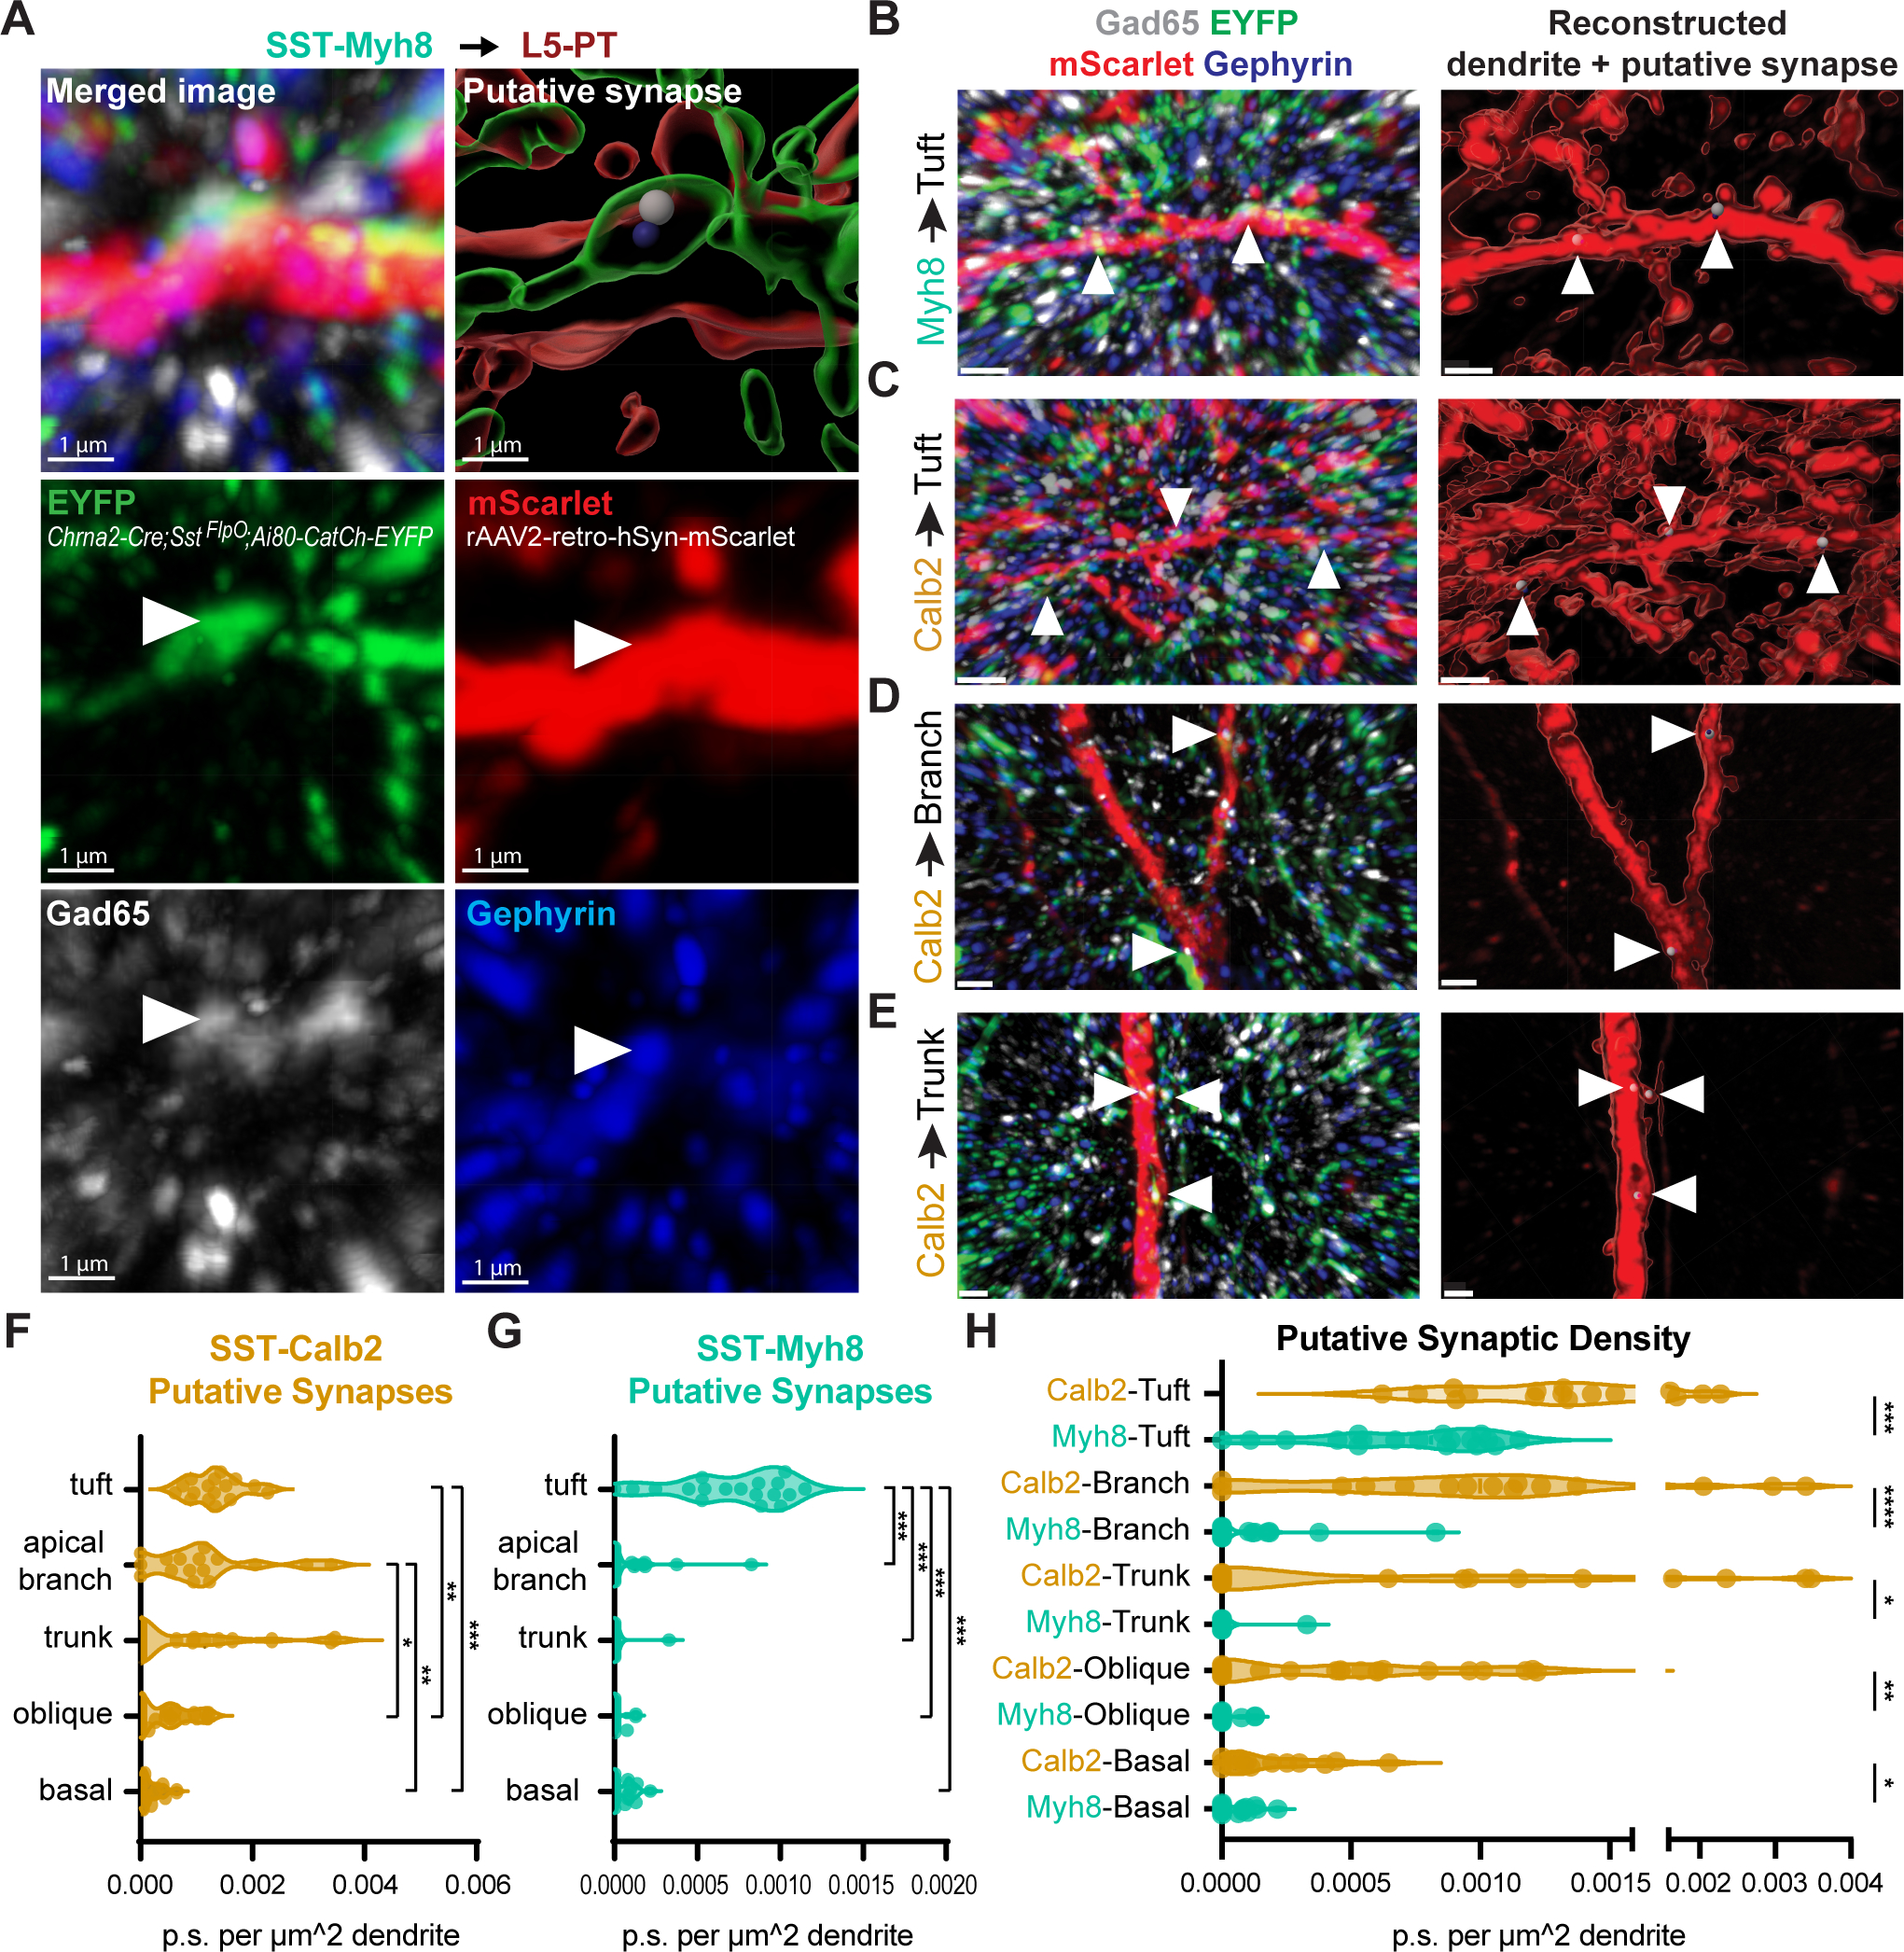
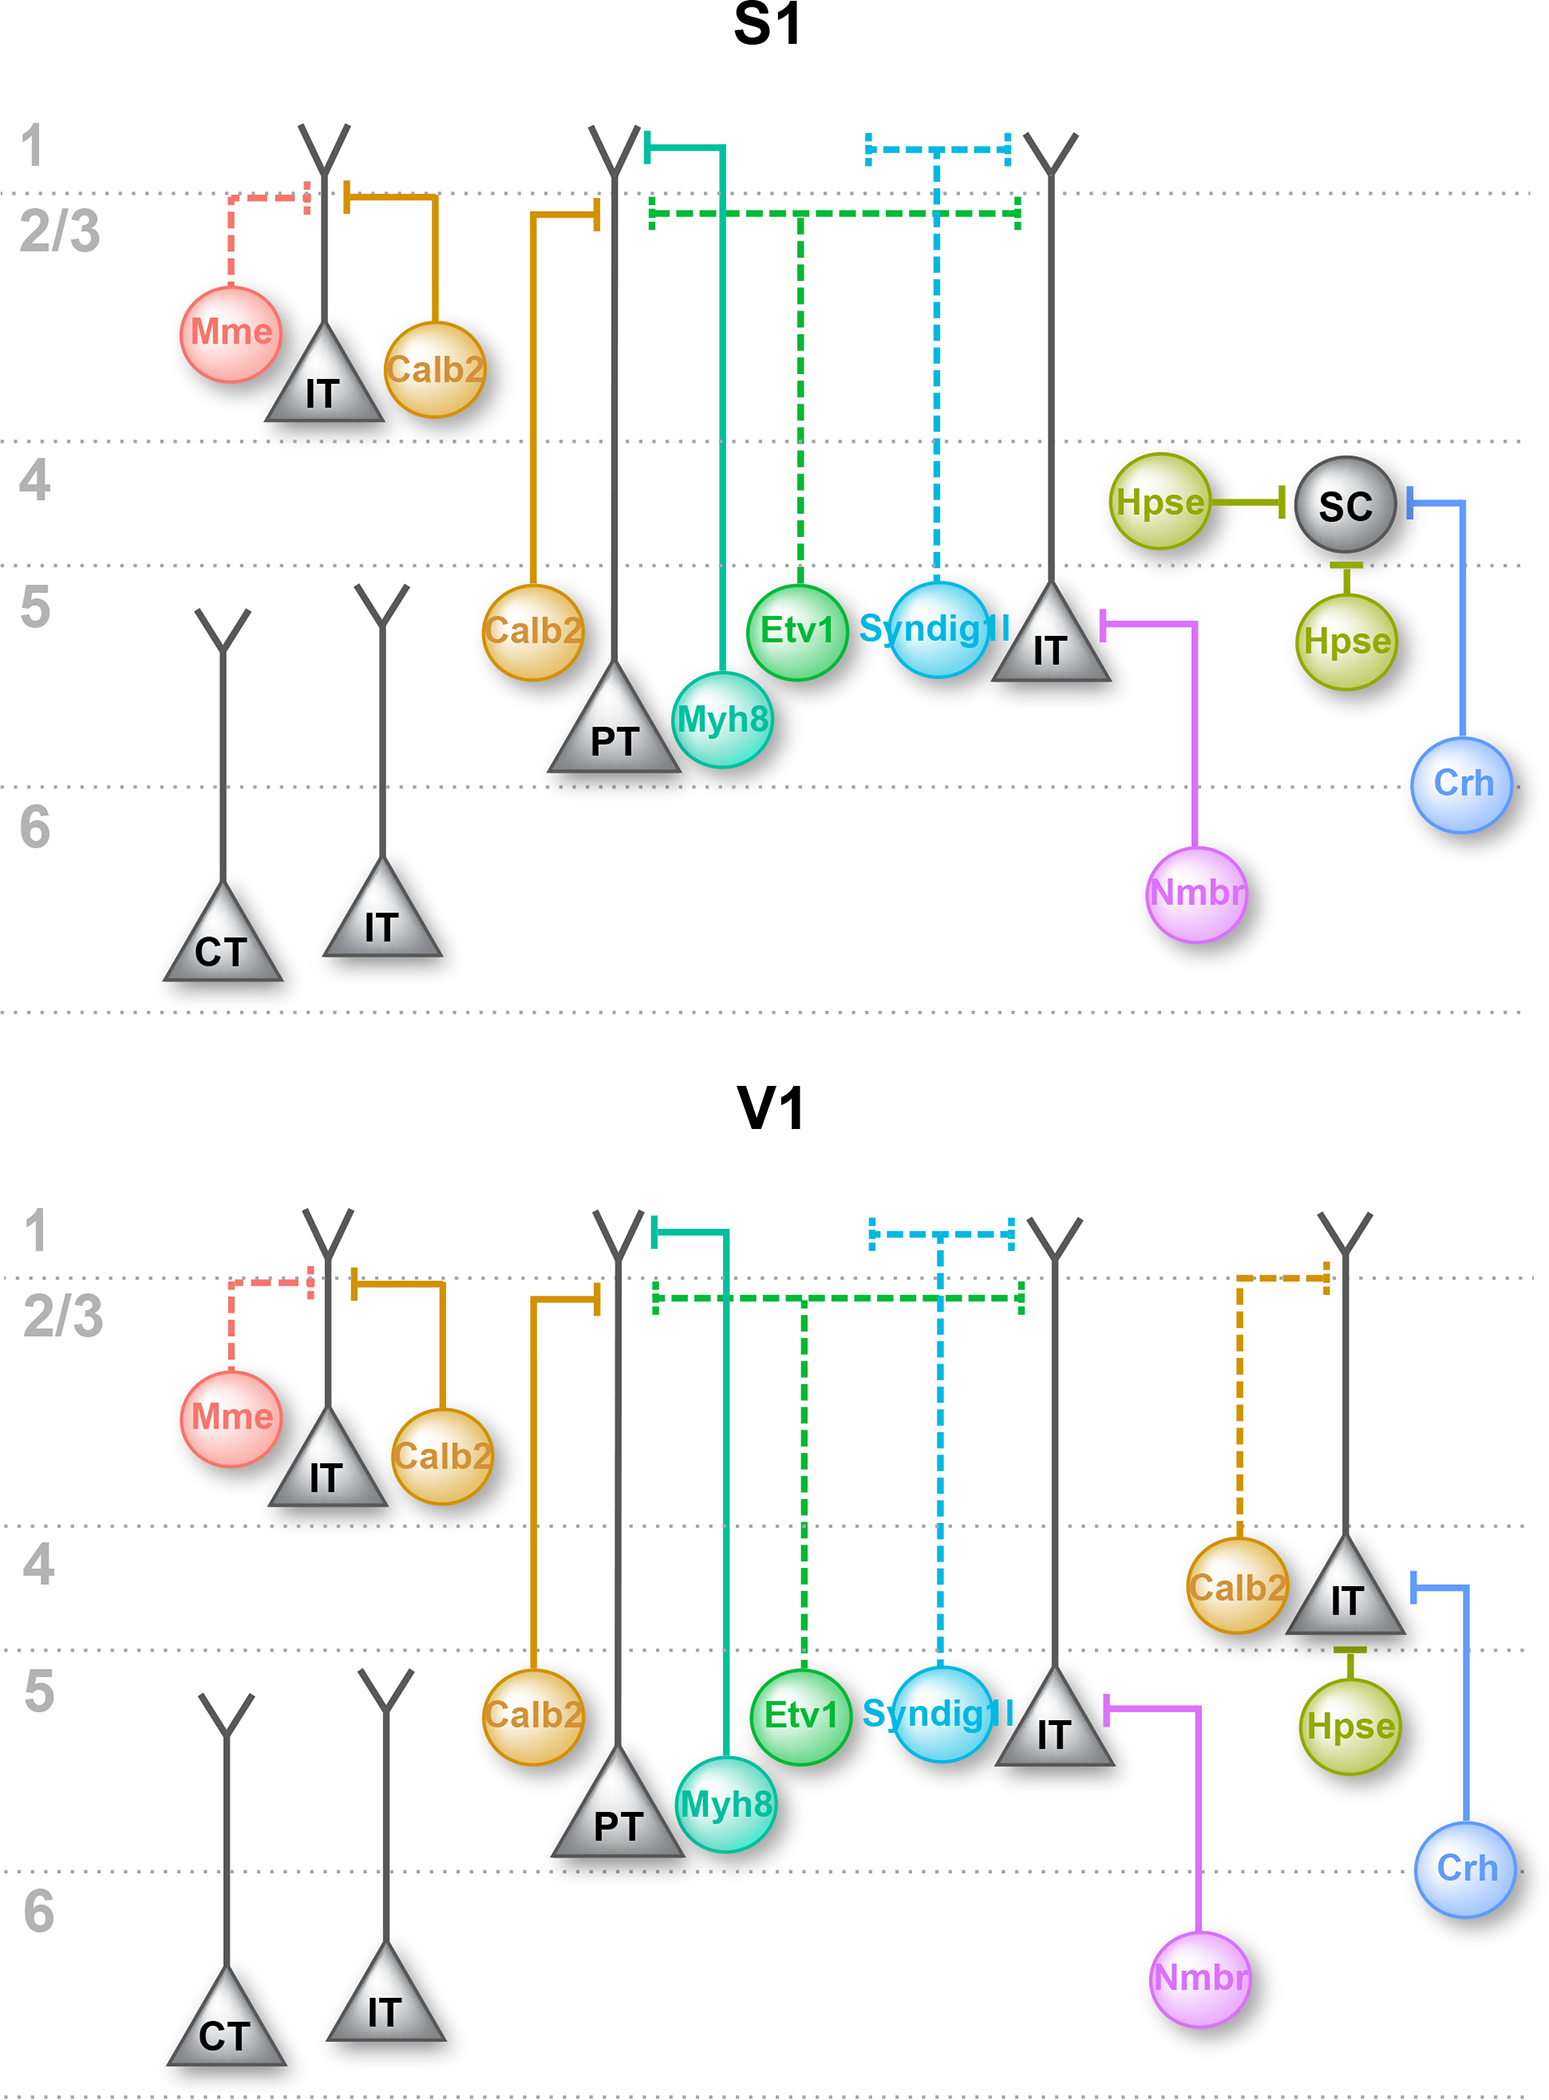
The cardinal classes are a useful simplification of cortical interneuron diversity, but such broad subgroupings gloss over the molecular, morphological, and circuit specificity of interneuron subtypes, most notably among the somatostatin interneuron class. Although there is evidence that this diversity is functionally relevant, the circuit implications of this diversity are unknown. To address this knowledge gap, we designed a series of genetic strategies to target the breadth of somatostatin interneuron subtypes and found that each subtype possesses a unique laminar organization and stereotyped axonal projection pattern. Using these strategies, we examined the afferent and efferent connectivity of three subtypes (two Martinotti and one non-Martinotti) and demonstrated that they possess selective connectivity with intratelecephalic or pyramidal tract neurons. Even when two subtypes targeted the same pyramidal cell type, their synaptic targeting proved selective for particular dendritic compartments. We thus provide evidence that subtypes of somatostatin interneurons form cell-type-specific cortical circuits.

Keywords: cortex; interneurons; intratelencephalic; laminar specificity; monosynaptic rabies tracing; optogenetics; pyramidal neurons; pyramidal tract; reciprocal connectivity; somatostatin; spatial transcriptomics; subtypes.


Conflict of interest statement

Declaration of interests G.F. is a founder of Regel Therapeutics, which has no competing interests with the present manuscript. G.F. is an advisor for Neuron and Annual Review of Neuroscience.

Figures

Figure 1.
Figure 1.. Spatial transcriptomic analysis reveals the laminar organization of eight SST interneuron subtypes
(A) UMAP visualization of snRNA-seq of P28 cortical interneurons, illustrating eight SST subtypes and the CHODL subtype. Inset showing the UMAP of the entire dataset. CGE, caudal ganglionic eminence. (B) Heatmap showing the scaled expression of marker genes for each SST subtype based on snRNA-seq data. (C) Robust cell type decomposition (RCTD) assignment of spatial clusters to different SST subtypes on a representative Slide-seq V2 experiment based on a scRNA-seq reference (see Methods). Gray circles represent the location of excitatory neurons in different layers for reference. (D) Violin plots demonstrate the laminar distribution of different SST subtypes identified in Slide-seqV2 experiments (n = 7 tissue sections, 4 mice). (E) Boxplot showing the proportion of different SST subtypes out of 525 total SST interneurons identified. (F) Bar plot showing the proportion of different SST subtypes identified across different cortical layers. See also Figures S1–2, Tables S1–2.
Figure 2.
Figure 2.. Genetically targeted SST subtypes showed stereotypical laminar distribution and morphology
(A) Representative images of genetically targeted SST subtypes in S1, counterstained with DAPI for visualization of laminar distribution. All images were taken from 1–3 month old mice. Ai9 reporter line is used here as a Cre-ON/Flp-OFF strategy because the FRT sites flanking the LoxP cassette are retained in this mouse line. SST-Hpse interneurons were occasionally observed in PdynT2A-CreER; NpyFlpO; Ai9 strategy, likely due to incomplete FlpO recombination, though not noted in this representative image. For labeling SST-Hpse subtype, rAAV9-hDlx-Flex-dTomato virus was stereotaxically injected in HpseCre mice in S1 at 1 month old and examined 13 days post-injection. Note that Etv1CreER; SstFlpO intersectional strategy may partially target SST-Calb2 subtype (Figure S5B) though not obvious in this example. Scale bars, 100 μm. (B) Sparse labeling and Neurolucida reconstructions of selective SST subtypes in S1. Images of genetically labeled or biocytin-filled SST interneurons are shown to the left of the Neurolucida reconstruction of single-neuron morphology. SST-Etv1 interneurons are labeled by Etv1CreER; SstFlpO; RC::FPSit genetic strategy. SST-Hpse and SST-Syndig1l interneurons are both labeled by PdynT2A-CreER; Ai14 strategy and differentiated by their unique morphology. SST-Crh interneurons are labeled by CrhCre; SstFlpO; RC::FPSit. SST-Myh8 and SST-Nmbr are both labeled by biocytin-filling. All reconstructions were performed using P25–73 mice. Scale bars, 100 μm. See also Figures S3–5, Tables S3–6.
Figure 3.
Figure 3.. Laminar positioning correlates with SST subtype innervation
(A) Recording scheme. Pan-SST interneurons or three SST subtypes, SST-Calb2, SST-Myh8, SST-Nmbr, were genetically targeted to express CatCh by crossing with the Ai80 reporter line. Postsynaptic IPSCs were recorded from pyramidal neurons across layers in response to 1 ms light stimulation. (B) Example average traces from pyramidal neurons across layers in response to pan-SST stimulation (left) and individual SST subtypes (three right panels). (C-F) Violin plot of the evoked IPSC amplitude upon stimulation of pan-SST interneurons or SST-Calb2, SST-Myh8, SST-Nmbr interneurons. (G) Heatmap of the ratio of median evoked IPSC amplitude for pan-SST interneurons or for individual SST subtypes across layers. Data were normalized across columns, where the value represents the ratio between the median evoked IPSC amplitude in a particular layer compared to the summed median IPSC amplitude of that SST subtype across layers. (H) Heatmap of the proportion of inhibition from individual SST subtype as compared to the inhibition from pan-SST interneurons in different layers. (I) Plot showing that percentage of individual SST subtype out of the total number of SST interneurons found in a particular layer (x-axis) is correlated with the proportion of the inhibitory output by individual SST subtype out of pan-SST interneuron response in that layer (y-axis). See also Figure S6. Statistics in Table S7.
Figure 4.
Figure 4.. SST subtypes differentially target IT vs. PT pyramidal neurons in L5
(A) Strategy for targeting IT and PT pyramidal neurons by injecting rAAV2-retro-hSyn-mScarlet into the retrosplenial cortex (Rs) or superior colliculus (SC), respectively. Representative images of mScarlet-labeled IT and PT neurons. Scale bars, 100 μm. (B) Recording scheme. Pan-SST interneurons or three SST subtypes, SST-Calb2, SST-Myh8, SST-Nmbr, were genetically targeted to express CatCh by crossing with the Ai80 reporter line. Postsynaptic IPSCs are recorded from IT or PT neurons in response to 1 ms light stimulation. (C) Representative average traces of evoked IPSC in IT (pink) and PT (red) neurons upon stimulation of pan-SST, SST-Calb2, SST-Myh8, and SST-Nmbr interneurons. (D-G) Violin plot of evoked IPSC amplitude upon optogenetic stimulation of pan-SST interneurons, SST-Calb2, SST-Myh8 or SST-Nmbr interneurons in L5-IT and L5-PT neurons. (H) Heatmap of the proportion of inhibition from individual SST subtype as compared to the inhibition from pan-SST interneurons in different layers and pyramidal neuron cell types. (I-J) Violin plot of evoked IPSC amplitude in L5-IT or L5-PT pyramidal neurons. See also Figure S6. Statistics in Table S7.
Figure 5.
Figure 5.. SST subtypes differentially innervate PV interneurons
(A) Representative images of E2-GFP injection in V1 labeling PV interneurons. Scale bars, 5 μm. (B) Recording scheme. SST-Calb2, SST-Myh8, SST-Nmbr interneurons were genetically targeted to express CatCh by crossing with the Ai80 reporter line. IPSCs were recorded from PV neurons in response to 1 ms light stimulation. (C-D) Representative traces of IPSCs and violin plots of IPSC amplitudes in PV interneurons in response to optogenetic stimulation of different SST subtypes. (E) Comparison of different SST subtypes output to L2/3 (left) and L5/6 PV interneurons (right). (F) Heatmap of median evoked IPSC amplitude (pA) from each SST subtype across pyramidal neurons and PV interneurons in different layers. Statistics in Table S7.
Figure 6.
Figure 6.. Monosynaptic rabies tracing from two different SST subtypes revealed cell type-specific afferent input
(A) Experimental design of rabies retrograde tracing from two SST subtypes. TVA and N2cG (green) are expressed via AAV helpers, followed by infection and retrograde tracing with rabies virus (red) (left panel). The design of AAV-DIO-helper viruses and the timeline of AAV-helpers and N2cRV injections for tracing from SST-Myh8 (top) and SST-Nmbr interneurons (bottom) using Chrna2-Cre and Crhr2Cre mouse lines, respectively. Rabies tracing patterns were analyzed 10–14 days post-infection (middle panel). The tracing was performed on both SST subtypes from two cortical regions, S1 and V1 (right panel). (B) Presynaptic inputs to SST-Myh8 and SST-Nmbr interneurons in V1 quantified as the percentage of rabies traced cells in each regional category out of the total number of cells labeled in the brain. The top 10 input regional categories for either SST subtype are included in the plot. (n = 3 mice for each SST subtype). Abbreviations of thalamic regions: dorsal part of the lateral geniculate complex (LGd-ip), lateral dorsal nucleus of thalamus (LD), lateral posterior nucleus of the thalamus (LP). (C) Quantification of rabies traced local presynaptic neurons in one representative experiment from SST-Myh8 (left) and SST-Nmbr interneurons (right), respectively. SATB2+ neurons are IT neurons, SATB2- neurons are either PT neurons or interneurons. For each experiment, a histogram of rabies traced neurons in each layer (left); a pie chart of the numbers of SATB2+ versus SATB2- rabies infected presynaptic neurons in L5 (middle), and a table shows the number of starter cells (right) are shown. Note that there are occasionally a small number of SATB2+ pyramidal neuron starter cells, due to the challenge of specifically targeting a small interneuron population that only constitutes ~2% of cortical neurons. See also Figure S7–8.
Figure 7.
Figure 7.. SST subtypes target distinct subcellular compartments of L5-PT dendrites.
(A) Representative images of a putative synapse from SST-Myh8 interneurons onto a PT tuft dendrite. SST-Myh8 axons are labeled with Chrna2-Cre;SstFlpO;Ai80-CatCh-EYFP, L5-PT dendrites labeled with rAAV2-retro-hSyn-mScarlet, presynaptic puncta labeled with Gad65, and postsynaptic puncta labeled with Gephyrin. The top row shows the merged image with all four channels (left) and the 3D reconstruction in Imaris (right). Arrowheads indicate the location of the putative synapse identified by the colocalization of all four channels in Imaris. Scale bars, 1 μm. (B) Representative images of putative synapses from SST-Myh8 interneurons onto PT tuft dendrites in lower magnification. Arrowheads indicate the location of putative synapses. Merged image (left) shows all four channels as in (A), and Imaris reconstruction (right) shows the locations of the putative synapses on the dendrite. Scale bars, 1 μm. (C-E) Representative image of SST-Calb2 putative synapses on L5-PT tuft dendrites, dendritic apical branch, or dendritic trunk, as in (B). Scale bars, 1 μm. (F) Quantification of SST-Calb2 puncta on L5-PT dendrites. The number of puncta is normalized by the surface area of the reconstructed dendrite. Each data point represents one ROI examined. (G) Quantification of SST-Myh8 puncta on L5-PT dendrites. The number of puncta is normalized by the surface area of the reconstructed dendrite. (H) Comparison of SST-Calb2 and SST-Myh8 puncta on L5-PT dendrites. Statistics in Table S7.
Figure 8.
Figure 8.. Schematic drawing of the output circuitry of different SST subtypes in S1 and V1
Summary of our current understanding of the innervation pattern of different SST subtypes in S1 and V1, showing the preferred postsynaptic excitatory neuron cell type of each SST subtype. Dashed lines showing hypothesized output circuitry for SST subtypes that have not been fully characterized. IT, intratelencephalic neuron; PT, pyramidal-tract neuron; SC, L4 spiny stellate cell; CT, corticothalamic neuron.

References

    1. Fishell G, and Kepecs A (2020). Interneuron Types as Attractors and Controllers. Annu Rev Neurosci 43, 1–30. 10.1146/annurev-neuro-070918-050421. - DOI - PMC - PubMed
    1. Tremblay R, Lee S, and Rudy B (2016). GABAergic interneurons in the neocortex: From cellular properties to circuits. Neuron 91, 260–292. 10.1016/j.neuron.2016.06.033. - DOI - PMC - PubMed
    1. Yao Z, van Velthoven CTJ, Nguyen TN, Goldy J, Sedeno-Cortes AE, Baftizadeh F, Bertagnolli D, Casper T, Chiang M, Crichton K, et al. (2021). A taxonomy of transcriptomic cell types across the isocortex and hippocampal formation. Cell 184, 3222–3241.e26. 10.1016/j.cell.2021.04.021. - DOI - PMC - PubMed
    1. Kepecs A, and Fishell G (2014). Interneuron cell types are fit to function. Nature 505, 318–326. 10.1038/nature12983. - DOI - PMC - PubMed
    1. Fino E, and Yuste R (2011). Dense Inhibitory Connectivity in Neocortex. Neuron 69, 1188–1203. 10.1016/j.neuron.2011.02.025. - DOI - PMC - PubMed

Publication types

LinkOut - more resources