. 2023 Jul 11;18(7):1394-1404.
doi: 10.1016/j.stemcr.2023.06.001. Epub 2023 Jun 29.

Vascularized hiPSC-derived 3D cardiac microtissue on chip

Affiliations

Vascularized hiPSC-derived 3D cardiac microtissue on chip

Ulgu Arslan et al. Stem Cell Reports. .

Erratum in

  • Vascularized hiPSC-derived 3D cardiac microtissue on chip.
    Arslan U, Brescia M, Meraviglia V, Nahon DM, van Helden RWJ, Stein JM, van den Hil FE, van Meer BJ, Vila Cuenca M, Mummery CL, Orlova VV. Arslan U, et al. Stem Cell Reports. 2023 Oct 10;18(10):2003. doi: 10.1016/j.stemcr.2023.08.012. Stem Cell Reports. 2023. PMID: 37820576 Free PMC article. No abstract available.

Abstract

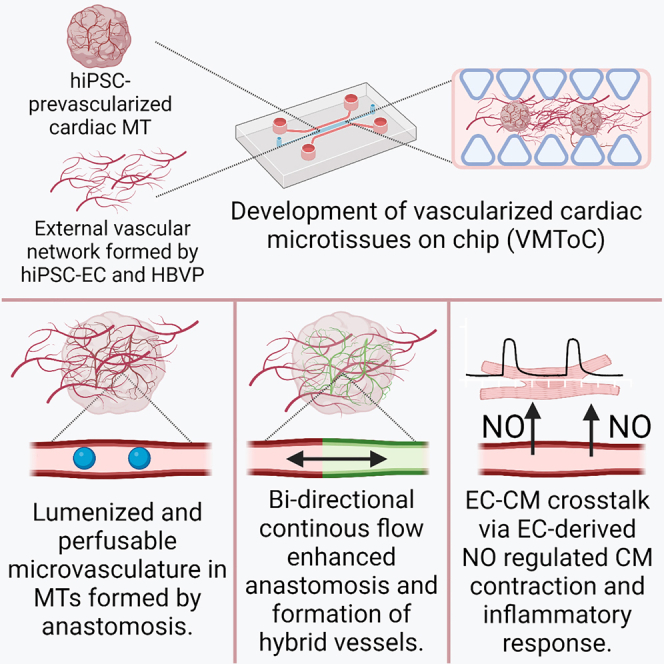
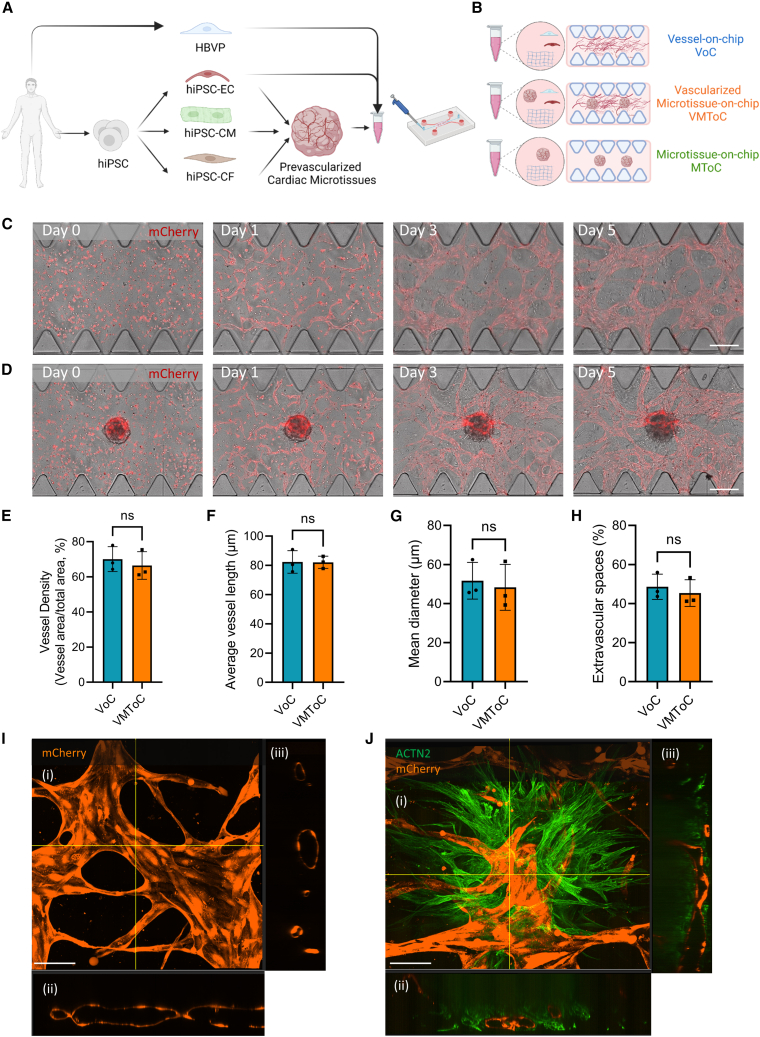
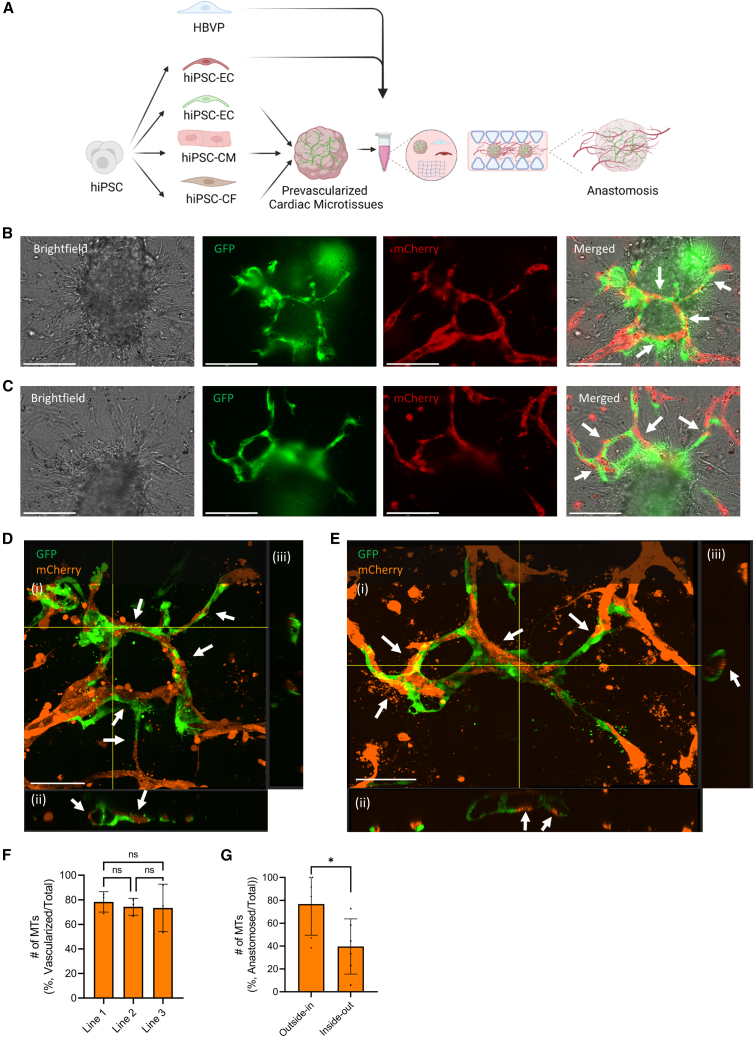
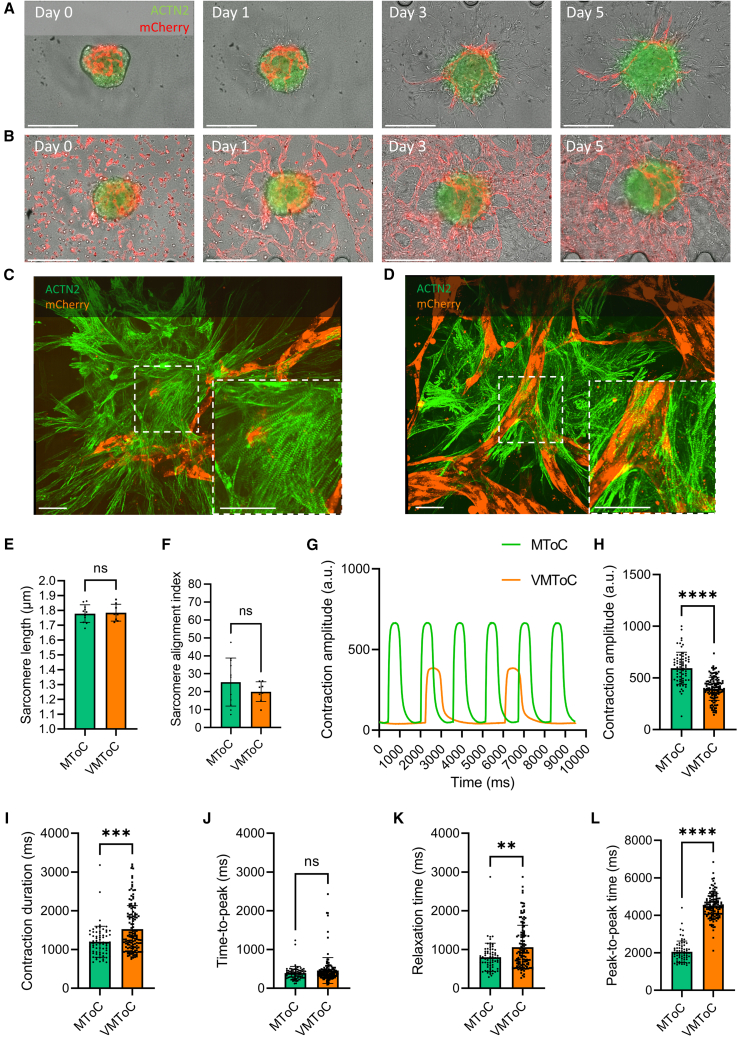
Functional vasculature is essential for delivering nutrients, oxygen, and cells to the heart and removing waste products. Here, we developed an in vitro vascularized human cardiac microtissue (MT) model based on human induced pluripotent stem cells (hiPSCs) in a microfluidic organ-on-chip by coculturing hiPSC-derived, pre-vascularized, cardiac MTs with vascular cells within a fibrin hydrogel. We showed that vascular networks spontaneously formed in and around these MTs and were lumenized and interconnected through anastomosis. Anastomosis was fluid flow dependent: continuous perfusion increased vessel density and thus enhanced the formation of the hybrid vessels. Vascularization further improved endothelial cell (EC)-cardiomyocyte communication via EC-derived paracrine factors, such as nitric oxide, and resulted in an enhanced inflammatory response. The platform sets the stage for studies on how organ-specific EC barriers respond to drugs or inflammatory stimuli.

Keywords: Heart-on-chip; Organ-on-chip; cardiac microtissue; cell-cell interaction; hiPSC-derived cardiomyocytes; hiPSCs; human induced pluripotent stem cells; vascularization.


Conflict of interest statement

Conflict of interests C.L.M. is co-founder of Ncardia bv.

Figures

None
Graphical abstract
Figure 1
Figure 1
Characterization of the vascular network in the presence of cardiac MTs (A and B) Schematic overview of the vascularized cardiac MTs experimental setup (A) and conditions used in the study (B). hiPSC-ECs and HBVPs were cocultured to form VoC; hiPSC-MTs were cocultured with hiPSC-ECs and HBVPs to form VMToC; hiPSC-MTs were integrated into chips without any additional vascular cells to form MToC. (C and D) Representative images from chips on days 0, 1, 3, and 5 after seeding in the chips, which shows the development of external vascular networks in VoC (C) and VMToC (D). Images showing bright field and hiPSC-EC (red, mCherry) (10×). Scale bars, 300 μm. (E–H) Quantification of vessel density (%) (E), average vessel length (μm) (F), mean diameter (μm) (G), extravascular spaces (%) (H). Error bars are shown as mean ± SD from N = 3; three independent experiments with at least six microfluidic channels per experiment. Student’s t test; ns, not significant. (I and J) Representative confocal images of microvascular network in VoC (I) and VMToC (J) showing hiPSC-ECs (orange, mCherry) and hiPSC-CMs (green, ACTN2). Images displaying maximum projection in xyz (i), xy (ii), and yz cross-sectional perspectives (iii) (40×). Scale bar, 100 μm. See also Figure S1 and Videos S1, S2, and S3.
Figure 2
Figure 2
Mechanism of the intra-microvascular network formation (A) Schematic of the experimental setup. MTs were generated combining hiPSC-CMs, hiPSC-ECs (green, GFP), and hiPSC-CFs. These MTs were cocultured with hiPSC-ECs (red, mCherry) and HBVPs in chips. (B and C) Representative images of outside-in (B) and inside-out (C) anastomosis and formation of hybrid vessels by interconnection of internal microvascular network (green, GFP) and external vascular network (red, mCherry) (20×). Scale bar, 150 μm. (D and E) Representative confocal images of hybrid vessels visible in (B) and (C), respectively. Internal hiPSC-ECs (green, GFP) and external hiPSC-ECs (orange, mCherry). Images displaying maximum projection in xyz (i), xy (ii), and yz cross-sectional perspectives (iii) (40×). Scale bar, 100 μm. Arrows indicate the anastomosed points and hybrid lumens. (F) Quantification of number of vascularized MTs (%, number vascularized MTs/total number of MTs). MTs contained CMs from three different hiPSC lines. Error bars are shown as mean ± SD from N = 3; three independent experiments with at least 10 MTs in each experiment. One-way ANOVA; ns, not significant. (G) Quantification of number of anastomosed MTs (%, #anastomosed MTs/total # of MTs) in independent experiments. Error bars are shown as mean ± SD from N = 6; six independent experiments with at least nine MTs in each experiment. Student’s t test, ∗p < 0.05. See also Figure S2.
Figure 3
Figure 3
Characterization of contractile dynamics of cardiac MTs in MToC and VMToC (A and B) Representative images of MTs in chips on days 0, 1, 3, and 5 in MToC (A) and VMToC (B) (10×). Scale bar, 300 μm. (C and D) Representative confocal images of sarcomeres showing hiPSC-ECs (orange, mCherry) and hiPSC-CMs (green, ACTN2) in MToC (C) and VMToC (D) (40×). White dashed box is the area that is zoomed 100×. Scale bar, 50 μm. (E and F) Quantification of the sarcomere parameters: sarcomere length (E); sarcomere alignment index (F); error bars are shown as mean ± SD from MToC N = 3, n = 11; VMToC N = 4, n = 8; three or four independent experiments with at least eight MTs. (G) Representative beating traces of MTs from MToC (green trace) and VMToC (orange trace). (H–L) Quantification of the contraction parameters: contraction amplitude (H), contraction duration (I), time to peak (J), relaxation time (K), and peak-to-peak time (L) in MTs with AICS-0075 hiPSC-CMs. Error bars are shown as mean ± SD from MToC N = 3, n = 69; VMToC N = 3, n = 132; three independent experiments with 16 or 24 MTs from at least six different microfluidic channels each experiment. Student’s t test (E), Wilcoxon-Mann-Whitney test (F and H–L). ∗∗∗p < 0.001, ∗∗∗∗p < 0.0001; ns, not significant. See also Figure S3.
Figure 4
Figure 4
Altered contractile dynamics and inflammatory response of cardiac MTs regulated by EC-CM communication in VMToC but not in MToC (A–H) Quantification of the contraction parameters presented as percentage change from the baseline mean of spontaneous beating condition, after 1 h (A–D) and 6 h (E–H) incubation with vehicle or L-NAME (1 mM): contraction duration (A and E); time to peak (B and F); relaxation time (C and G); peak-to-peak time (D and H) in MTs with LUMC0059iCTRL03 hiPSC-CMs. Error bars are shown as mean ± SD from MToC N = 3, n > 28 (vehicle) and n > 27 (L-NAME); VMToC N = 3, n > 24 (vehicle) and n > 27 (L-NAME); three independent experiments with at least seven MTs in each experiment. (I–K) Quantification of pro-inflammatory cytokines from the medium after 12 h incubation of IL-1β (10 ng/mL): IL-6 (I); IL-8 (J); MCP1/CCL2 (K) in MTs with LUMC0059iCTRL03 hiPSC-CMs. Y axis shows concentration (pg/mL). Error bars are shown as mean ± SD. MToC N = 3, n > 3; VMToC N = 3, n > 3; three independent experiments; medium was collected from at least with three different microfluidic channels in each experiment. (L–O) Quantification of the contraction parameters presented as percentage change from the baseline mean of spontaneous beating condition after 12 h incubation with vehicle or IL-1β (10 ng/mL): contraction duration (L); time to peak (M); relaxation time (N); peak-to-peak time (O) in MTs with LUMC0059iCTRL03 hiPSC-CMs. Error bars are shown as mean ± SD from MToC N = 3, n = 26 (vehicle) and n = 30 (IL-1β); VMToC N = 3, n = 25 (vehicle) and n = 31 (IL-1β); three independent experiments with at least seven MTs in each experiment. Kruskal-Wallis test with Dunn’s multiple comparisons test (A–H, L–O), two-way ANOVA with Šidák’s multiple comparisons test (I–K), ∗p < 0.05, ∗∗p < 0.01, ∗∗∗p < 0.001; ∗∗∗∗p < 0.0001; ns, not significant. See also Figure S4.

References

    1. Abe Y., Watanabe M., Chung S., Kamm R.D., Tanishita K., Sudo R. Balance of interstitial flow magnitude and vascular endothelial growth factor concentration modulates three-dimensional microvascular network formation. APL Bioeng. 2019;3 - PMC - PubMed
    1. Amersfoort J., Eelen G., Carmeliet P. Immunomodulation by endothelial cells — partnering up with the immune system? Nat. Rev. Immunol. 2022;22:576–588. - PMC - PubMed
    1. Arslan U., Moruzzi A., Nowacka J., Mummery C.L., Eckardt D., Loskill P., Orlova V.V. Microphysiological stem cell models of the human heart. Mater. Today. Bio. 2022;14 - PMC - PubMed
    1. Berry C., Duncker D.J. Coronary microvascular disease: the next Frontier for Cardiovascular Research. Cardiovasc. Res. 2020;116:737–740. - PMC - PubMed
    1. Campostrini G., Meraviglia V., Giacomelli E., Helden R.W.J., van, Yiangou L., Davis R.P., Bellin M., Orlova V.V., Mummery C.L. Generation, functional analysis and applications of isogenic three-dimensional self-aggregating cardiac microtissues from human pluripotent stem cells. Nat Protoc. 2021;16:2213–2256. doi: 10.1038/s41596-021-00497-2. - DOI - PMC - PubMed

Publication types