. 2023 Aug:519:113520.
doi: 10.1016/j.jim.2023.113520. Epub 2023 Jun 29.

Effect of wash media type during PBMC isolation on downstream characterization of SARS-CoV-2-specific T cells

Affiliations

Effect of wash media type during PBMC isolation on downstream characterization of SARS-CoV-2-specific T cells

Zion Congrave-Wilson et al. J Immunol Methods. 2023 Aug.

Abstract

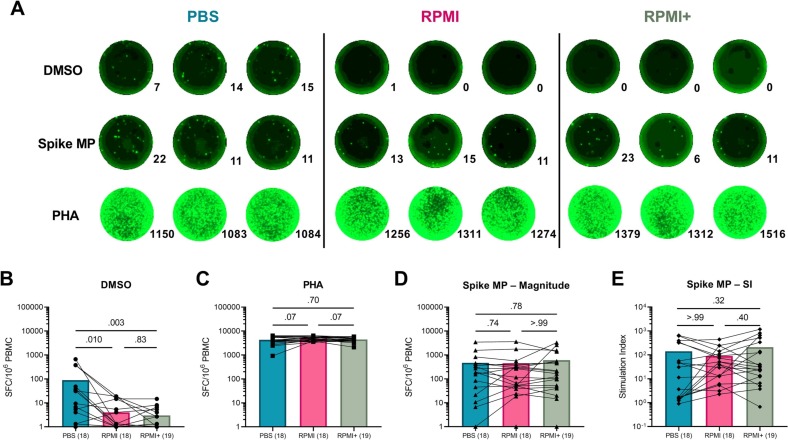
Protocols for the isolation of peripheral blood mononuclear cells (PBMCs) from whole blood vary greatly between laboratories, especially in published studies of SARS-CoV-2-specific T cell responses following infection and vaccination. Research on the effects of different wash media types or centrifugation speeds and brake usage during the PBMC isolation process on downstream T cell activation and functionality is limited. Blood samples from 26 COVID-19-vaccinated participants were processed with different PBMC isolation methods using either PBS or RPMI as the wash media with high centrifugation speed and brakes or RPMI as the wash media with low speed and brakes (RPMI+ method). SARS-CoV-2 spike-specific T cells were quantified and characterized via a flow cytometry-based activation induced markers (AIM) assay and an interferon-γ (IFNγ) FluoroSpot assay and responses were compared between processing methods. Samples washed with RPMI showed higher AIM+ CD4 T cell responses than those washed with PBS and showed a shift away from naïve and towards an effector memory phenotype. The activation marker OX40 showed higher SARS-CoV-2 spike-induced upregulation on RPMI-washed CD4 T cells, while differences in CD137 upregulation were minimal between processing methods. The magnitude of the AIM+ CD8 T cell response was similar between processing methods but showed higher stimulation indices. Background frequencies of CD69+ CD8 T cells were increased in PBS-washed samples and were associated with higher baseline numbers of IFNγ-producing cells in the FluoroSpot assay. Slower braking in the RPMI+ method did not improve detection of SARS-CoV-2-specific T cells and caused longer processing times. Thus, the use of RPMI media with full centrifugation brakes during the wash steps of PBMC isolation was found to be most effective and efficient. Further studies are needed to elucidate the pathways involved in RPMI-mediated preservation of downstream T cell activity.

Keywords: Centrifugation brakes; Flow cytometry; FluoroSpot; Processing; T cell; Wash media.


Figures

Fig. 1
Fig. 1
Comparison of AIM+ CD4 T cell responses to the SARS-CoV-2 spike protein between the PBS, RPMI, and RPMI+ processing methods. (A) A representation of the differences in AIM+ CD4 T cells, defined as OX40+CD137+, between the different processing methods for each stimulation condition is presented. Numbers are the percentage AIM+ of total CD4 T cells. Comparisons of AIM+ CD4 T cells between processing methods are shown for the (B) DMSO- and (C) PHA-stimulated conditions. The (D) magnitudes and (E) stimulation indices of Spike MP-stimulated AIM+ CD4 T cells are also compared between processing methods. All bars are at the median of each group. (F) An example of the differences in memory subsets of AIM+ CD4 T cells by processing method is shown. Numbers are the percentage of each subset in AIM+ CD4 T cells; black color corresponds to the bulk CD4 T cell population while red corresponds to the AIM+ CD4 population. (G) Changes in each AIM+ CD4 memory subset are compared between the different processing methods. Boxes are at the median and 1st and 3rd quartiles, and whiskers are at the minimum and maximum. Statistical differences between groups were calculated using the Wilcoxon signed-rank test. Data is from 8 independent experiments. (For interpretation of the references to color in this figure legend, the reader is referred to the web version of this article.)
Fig. 2
Fig. 2
Differences in the single expression of OX40 or CD137 on CD4 T cells between the PBS, RPMI, and RPMI+ processing methods. Representative samples of singular (A) OX40 or (B) CD137 expression on CD4 T cells following DMSO, Spike MP, and PHA stimulation for each processing method are shown. Numbers are percentage OX40+ or CD137+ of total CD4 T cells. Comparisons of the proportions of OX40+ CD4 T cells between processing methods for the (C) DMSO- and (D) PHA-stimulated conditions are presented, followed by the (E) magnitudes and (F) stimulation indices of OX40 expression following Spike MP stimulation. For CD137+ CD4 T cells, proportions are compared between processing methods for the (G) DMSO- and (H) PHA-stimulated conditions, as well as for (I) the magnitudes and (J) stimulation indices of CD137 expression following Spike MP stimulation. All bars are at the median. Statistical differences between groups were calculated using the Wilcoxon signed-rank test. Data is from 8 independent experiments.
Fig. 3
Fig. 3
Comparison of AIM+ CD8 T cell responses to the SARS-CoV-2 spike protein between the PBS, RPMI, and RPMI+ processing methods. AIM+ CD8 T cells were defined as CD69+CD137+, and (A) an example of differences in the background, spike-specific, and PHA-stimulated AIM+ CD8 responses between the different processing methods is presented. Numbers are the percentage AIM+ of total CD8 T cells. Comparisons of the proportions of AIM+ CD8 T cells between processing methods are shown for the (B) DMSO- and (C) PHA-stimulated conditions. The (D) magnitudes and (E) stimulation indices of Spike MP-stimulated AIM+ CD8 T cells are also compared between processing methods. All bars are at the median. (F) An example of the differences in AIM+ CD8 T cell memory subsets by processing method is shown. Numbers are the percentage of each subset in AIM+ CD8 T cells; black color corresponds to the bulk CD8 T cell population while blue corresponds to the AIM+ CD8 population. (G) The shifts in each AIM+ CD8 memory subset between the different processing methods are presented. Boxes represent the median and 1st and 3rd quartiles while whiskers are at the minimum and maximum. Statistical differences between groups were calculated using the Wilcoxon signed-rank test. Data is from 8 independent experiments. (For interpretation of the references to color in this figure legend, the reader is referred to the web version of this article.)
Fig. 4
Fig. 4
Differences in the single expression of CD69 or CD137 on CD8 T cells between the PBS, RPMI, and RPMI+ processing methods. Representative samples of singular (A) CD69 or (B) CD137 expression on CD8 T cells following DMSO, Spike MP, and PHA stimulation compared between the different processing methods are shown. Numbers are the percentage CD69+ or CD137+ of total CD8 T cells. Comparisons of CD69+ CD8 T cells between processing methods are presented for the (C) DMSO- and (D) PHA-stimulated conditions. The (E) magnitudes and (F) stimulation indices of Spike MP-induced CD69 expression are also compared between processing methods. For CD137+ CD8 T cells, differences in CD137 expression between processing methods for the (G) DMSO- and (H) PHA-stimulated conditions and changes in the (I) magnitudes and (J) stimulation indices following Spike MP stimulation are presented. All bars at the median. Statistical differences between groups were calculated using the Wilcoxon signed-rank test. Data is from 8 independent experiments.
Fig. 5
Fig. 5
Comparison of SARS-CoV-2 spike-induced IFNγ production by T cells processed using the PBS, RPMI, and RPMI+ methods. (A) An example of the differences in the numbers of IFNγ spot forming cells (SFC)/2.5 × 105 PBMC for each stimulation condition between processing methods is shown. Numbers to the bottom right of each well are the number of SFC per well. Comparisons in the numbers of IFNγ SFC/106 PBMC between the different processing methods are shown for the (B) DMSO- and (C) PHA-stimulated conditions. The (D) magnitudes and (E) stimulation indices for IFNγ SFC/106 PBMC are compared between processing methods. All bars are at the median. Statistical differences between groups were calculated using the Wilcoxon signed-rank test. All conditions were run in triplicate. Data is from 9 independent experiments.

References

    1. Bull M., Lee D., Stucky J., Chiu Y.-L., Rubin A., Horton H., McElrath M.J. Defining blood processing parameters for optimal detection of cryopreserved antigen-specific responses for HIV vaccine trials. J. Immunol. Methods. 2007;322:57–69. doi: 10.1016/j.jim.2007.02.003. - DOI - PMC - PubMed
    1. Carr E.L., Kelman A., Wu G.S., Gopaul R., Senkevitch E., Aghvanyan A., Turay A.M., Frauwirth K.A. Glutamine uptake and metabolism are coordinately regulated by ERK/MAPK during T lymphocyte activation. J. Immunol. 2010;185:1037–1044. doi: 10.4049/jimmunol.0903586. - DOI - PMC - PubMed
    1. Cytiva . 2020. HyClone Classical Media Formulation - RPMI-1640 Medium - Liquid Media.
    1. Dan J.M., Mateus J., Kato Y., Hastie K.M., Yu E.D., Faliti C.E., Grifoni A., Ramirez S.I., Haupt S., Frazier A., Nakao C., Rayaprolu V., Rawlings S.A., Peters B., Krammer F., Simon V., Saphire E.O., Smith D.M., Weiskopf D., Sette A., Crotty S. Immunological memory to SARS-CoV-2 assessed for up to 8 months after infection. Science. 2021;371:eabf4063. doi: 10.1126/science.abf4063. - DOI - PMC - PubMed
    1. Gautam A., Donohue D., Hoke A., Miller S.A., Srinivasan S., Sowe B., Detwiler L., Lynch J., Levangie M., Hammamieh R., Jett M. Investigating gene expression profiles of whole blood and peripheral blood mononuclear cells using multiple collection and processing methods. PLoS One. 2019;14 doi: 10.1371/journal.pone.0225137. - DOI - PMC - PubMed

Publication types