. 2023 Jun 30;14(1):3885.
doi: 10.1038/s41467-023-39537-8.

Multinuclear 1D and 2D NMR with 19F-Photo-CIDNP hyperpolarization in a microfluidic chip with untuned microcoil

Affiliations

Multinuclear 1D and 2D NMR with 19F-Photo-CIDNP hyperpolarization in a microfluidic chip with untuned microcoil

M Victoria Gomez et al. Nat Commun. .

Abstract

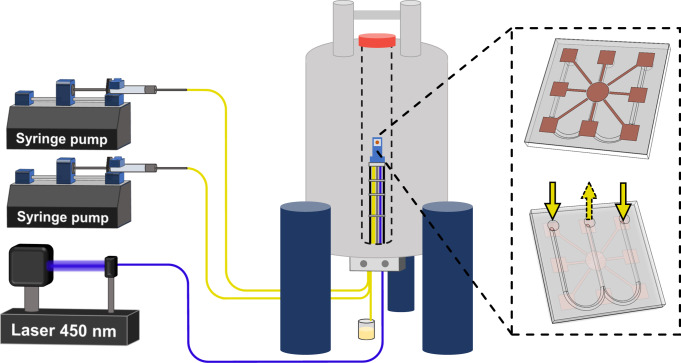
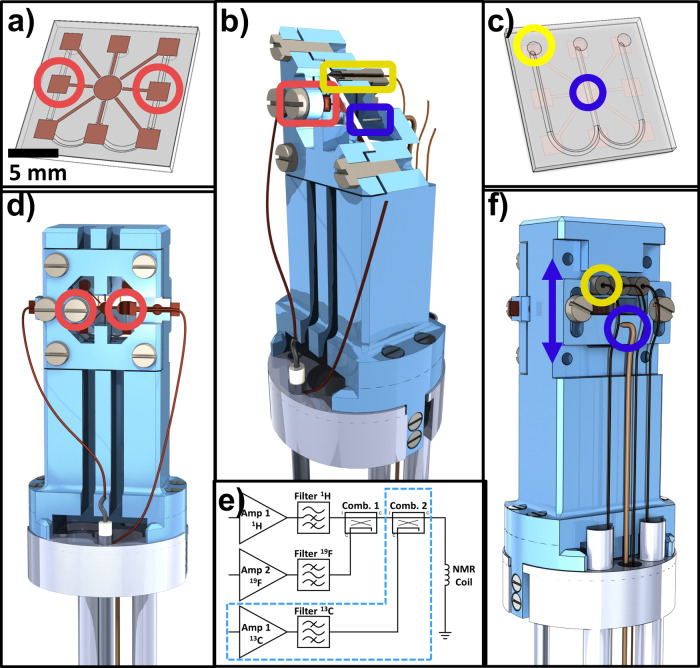
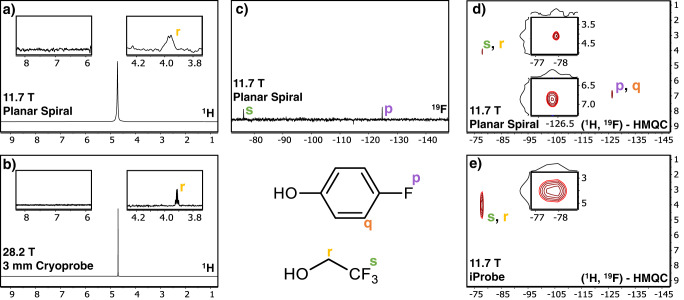
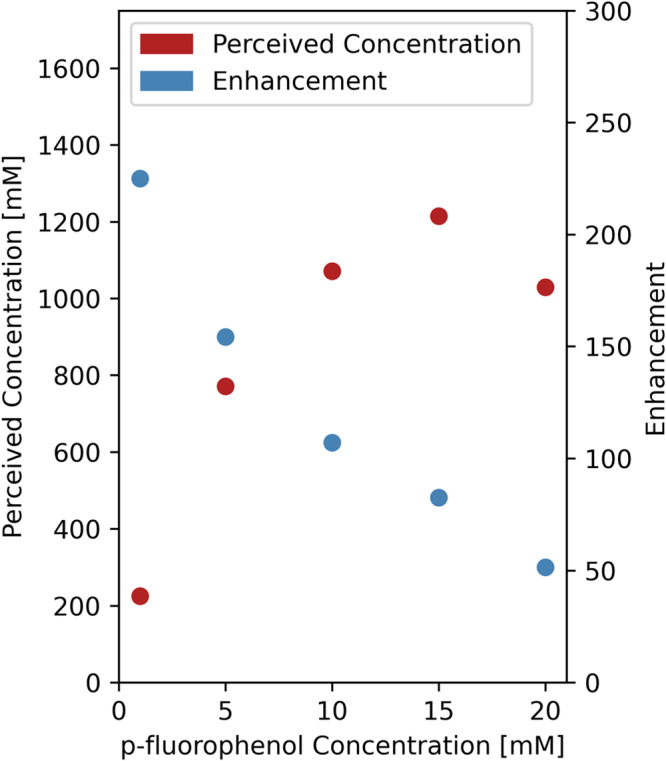
Nuclear Magnetic Resonance (NMR) spectroscopy is a most powerful molecular characterization and quantification technique, yet two major persistent factors limit its more wide-spread applications: poor sensitivity, and intricate complex and expensive hardware required for sophisticated experiments. Here we show NMR with a single planar-spiral microcoil in an untuned circuit with hyperpolarization option and capability to execute complex experiments addressing simultaneously up to three different nuclides. A microfluidic NMR-chip in which the 25 nL detection volume can be efficiently illuminated with laser-diode light enhances the sensitivity by orders of magnitude via photochemically induced dynamic nuclear polarization (photo-CIDNP), allowing rapid detection of samples in the lower picomole range (normalized limit of detection at 600 MHz, nLODf,600, of 0.01 nmol Hz1/2). The chip is equipped with a single planar microcoil operating in an untuned circuit that allows different Larmor frequencies to be addressed simultaneously, permitting advanced hetero-, di- and trinuclear, 1D and 2D NMR experiments. Here we show NMR chips with photo-CIDNP and broadband capabilities addressing two of the major limiting factors of NMR, by enhancing sensitivity as well as reducing cost and hardware complexity; the performance is compared to state-of-the-art instruments.


Conflict of interest statement

The authors declare no competing interests.

Figures

Fig. 1
Fig. 1. Overview of the microfluidic photo-CIDNP NMR setup.
Two syringe pumps allow on-flow mixing and rapid optimization of photosensitizer/target ratio. The syringes are connected to the NMR chip via fused-silica capillaries. A third (outlet) capillary is connected to a waste container underneath the NMR magnet. A 450 nm fiber-coupled laser diode is used to illuminate in situ the sample volume under the planar spiral microcoil. On top of a probe base tube with RF transmission lines and CNC connectors at the bottom, a 3D-printed chip holder is mounted (blue), holding the chip in position (gray square).
Fig. 2
Fig. 2. Scheme of the NMR chip holder for planar spiral NMR-on-a-Chip.
Please note that the color coding of the highlighted features is chosen such to be consistent in the different figures: red for electrical, yellow for fluidic, and purple for optical fiber connections. a Top view of the microfluidic chip, where the planar spiral coil is displayed as a copper disc. Red circles indicate the contact pads which are connected to the microcoil central and outer conductor. b Detailed section view of the NMR chip holder. It consists of the main holder and a top clamp, which holds the chip in place. The ferrule system that connects the fused silica capillary to the microfluidic inlet/outlet is indicated by the yellow box. The red box indicates the M3 screw that pushes the copper contact clamp strip onto the NMR chip contact patch. The optical fiber bare end is directed toward the NMR chip (purple box). c Back view of the microfluidic NMR chip, showing the inlet/outlet (yellow circle). The sample can be illuminated from this side of the chip for Photo-CIDNP experiments (purple circle). d Front view of the NMR chip holder. Copper wires connect the chip to the transmission line (left wire) and probe body ground (right wire). The outer, central screw pushes the copper wires onto the contact clamp strip. The right side of the top clamp has a section view cut-out, showing the copper wire on the contact clamp strip. With these clamps any soldering on the chip is avoided. e Electrical diagram for the multinuclear transmit and receive setup with three amplifiers. 1H RF signals are passed through a high pass filter, 19F and 13C through their respective bandpass filters. The 1H and 19F signal paths are combined and connected to the probe. In the case of trinuclear experiments, a second combiner is introduced to feed the 13 C RF signals to the probe as well (blue dashed box). f Back view of the NMR chip holder. One of the three capillary connections is indicated in yellow. The fiber optic can be seen below the microfluidic ferrules (purple circle). The optical fiber is mounted in a slider, that can be moved up and down (purple arrow) to align the illumination spot with the NMR detection area.
Fig. 3
Fig. 3. Photodegradation of stopped-flow sample and optimization of the laser power.
a Collection of photo-CIDNP 19F-NMR spectra (from 0.4 to 4.7 minutes) of 100 mM of p-fluorophenol in the presence of 20 mM of FMN as photosensitizer under stopped-flow conditions. Spectrum 1 corresponds to the (control) experiment in the absence of light. The experiment time for each spectrum is 26 seconds (16 scans) and the vertical axis indicates total experiment time in minutes. b Collection of photo-CIDNP 19F-NMR spectra of 100 mM of p-fluorophenol in the presence of 20 mM of FMN as photosensitizer under continuous flow conditions at a flow rate of 2 µL/min and with an increasing light intensity (from 100 mA to 700 mA). The output power (mW) out of the optical fiber is indicated in the vertical panel for the different light intensities. Only the absolute intensity spectra are shown; the commonly used difference spectra (light-dark) in photo-CIDNP experiments are not applicable here as in the dark practically no signal is observed.
Fig. 4
Fig. 4. Optimization of the p-fluorophenol-FMN concentration ratio.
a Scheme representing the backside of the NMR chip and the two inlets (yellow and blue arrows) from the two pumps placed outside the NMR magnet and one outlet (green arrow) (Figs. 1, 2). The blue arrow represents the inlet were FMN was present. The total flow rate was 2 µL/min (represented by the constant size of the green arrow), varying it from 0 to 2 for each syringe (represented by the different lengths for the yellow and blue arrows). b Collection of 1H NMR spectra for different p-fluorophenol—FMN ratio when changing flow rates for the two pumps; the integral values of both standards TFE and TFP were used to calculate the p-fluorophenol-FMN concentration ratio for d. c Photo-CIDNP 19F NMR spectra for the same conditions as in b. The purple rectangle indicates the spectra with a highest p-fluorophenol signal intensity. d Data points extracted from spectra shown in c for the integral value of p-fluorophenol as a function of the p-fluorophenol-FMN concentration ratio; The internal standard integral for TFE was taken as 100 units and the p-fluorophenol relative integral as a measure for photo-CIDNP efficiency.
Fig. 5
Fig. 5. 1D {1H}19F-NMR and {19F}1H-NMR and 2D 19F-1H-NMR with the untuned microcoil.
Left: (top) single-scan 19F-NMR spectra of neat TFE on the 25 nL spiral planar microcoil (342 nanomole) a proton-coupled and b proton decoupled, and (bottom) 1H-NMR spectra c fluorine coupled and d fluorine decoupled. e 2D 19F-1H HMQC NMR on a mixture of TFE and TFP (1:1).
Fig. 6
Fig. 6. Overlapped 19F-13C HMQC and 19F-13C HMBC on neat TFE (green crosspeaks in main spectrum).
The inserts show the 1H decoupled mode in a, c and without 1H decoupled mode in c, d. The inserts are aligned with the two blow-ups of the 1D spectrum on the main spectrum top, indicating the position of the 13C coupled and decoupled crosspeaks. a Shows {1H}19F-13C HMBC, b shows 19F13C-HMBC, c shows {1H}19F-13C HMQC, and d shows 19F-13C HMQC. The 1JCF, 1JCH, 2JCF, 3JHF coupling constants values are shown, illustrating the good resolution of the spectra. 19F-13C HMBC (b) shows a characteristic skewed doublet -triplet pattern caused by 1JCH, 2JCF, 3JHF as previously reported. The illustrative {1H}19F-13C HMBC experiment (a) eliminates the 3JHF coupling pattern. Similarly, 19F-13C HMQC (d) shows the 3JHF coupling pattern in both correlation peaks, and the related 19F-projection, whilst the {1H}19F -13C HMQC (c) efficiently eliminates it. Note that we measured in neat TFE, so no lock is used, nor referencing to internal standards is done. The coupling constants are nevertheless field independent and can be determined from these spectra.
Fig. 7
Fig. 7. Comparison of the photo-CIDNP broadband planar spiral microcoil setup with commercial 500 MHz probe and with a 1200 MHz NMR system.
a Single-scan 500 MHz 1H spectrum of 325 picomole (13 mM) of p-fluorophenol, 7.5 nanomole (300 mM) of TFE and 28 picomole (1.1 mM) of FMN in H2O (nLODf,600 1.0 nmol Hz1/2), in the planar spiral microcoil. In the right inset the TFE quartet is visible (yellow r), but p-fluorophenol (left inset) is not observed. b 1200 MHz 1H spectrum with the same amount of TFE and p-fluorophenol as in a dissolved in 200 µL D2O on a 3 mm cryoprobe. Also here, only the TFE quartet is observed after 1 scan (nLODf,600 1.1 nmol Hz1/2). c 19F photo-CIDNP spectrum of 13 mM of p-fluorophenol, where the 300 mM TFE signal (green, s) is observed as well as the p-fluorophenol signal (purple, p) observed because of the hyperpolarization of the 19F nucleus in 1 scan ((nLODf,600 2.9 nmol Hz1/2 for the thermally polarized TFE and an nLODf,600 of 0.01 nmol Hz1/2 for the hyperpolarized p-fluorophenol). d 2D photo-CIDNP 19F HMQC spectrum at 2 µL/min of 13 mM of p-fluorophenol as in c using the untuned NMR chip. The 19F-1H cross-peak of p-fluorophenol (p, q) as well as TFE’s (s, r) are revealed in 32 scans. e Same amount of sample and experiment (19F-1H HMQC) as in d, but without photo-CIDNP, on a 500 MHz Bruker NMR system equipped with an iProbe. A similar NMR acquisition time does not render the corresponding p-fluorophenol peak, only the TFE can be detected. Note that all photo-CIDNP experiments were carried out in continuous light irradiation mode, simplifying the typical 2D photo-CIDNP pulse sequences, in combination with a continuous flow regime to avoid loss of signal because of the accumulation of photodegraded photosensitizer in the detection volume.
Fig. 8
Fig. 8. The relation between the p-fluorophenol concentration and the perceived concentration as a result of photo-CIDNP enhancement.
Perceived concentration of the photo-CIDNP enhanced p-fluorophenol signal (red dots) as well as the enhancement factor (perceived concentration divided by the real concentration), showing a clear trend of higher enhancement at lower p-fluorophenol concentrations, and an optimum for maximum signal at 15 mM of p-fluorophenol. See supporting info for the raw data and normalization against the internal reference. Source data are provided as a Source Data file.

References

    1. Giunta, C. J. & Mainz, V. V. Discovery of Nuclear Magnetic Resonance: Rabi, Purcell, and Bloch. in ACS Symposium Series (eds. Strom, E. T. & Mainz, V. V.) vol. 1349 3–20 (American Chemical Society, 2020).
    1. Ernst RR. Nuclear magnetic resonance fourier transform spectroscopy (nobel lecture) Angew. Chem. Int. Ed. Engl. 1992;31:805–823. doi: 10.1002/anie.199208053. - DOI - PubMed
    1. Wüthrich K. NMR studies of structure and function of biological macromolecules (nobel lecture) Angew. Chem. Int. Ed. 2003;42:3340–3363. doi: 10.1002/anie.200300595. - DOI - PubMed
    1. Lauterbur PC. All science is interdisciplinary—from magnetic moments to molecules to men (nobel lecture) Angew. Chem. Int. Ed. 2005;44:1004–1011. doi: 10.1002/anie.200462400. - DOI - PubMed
    1. Mansfield P. Snapshot magnetic resonance imaging (Nobel Lecture) Angew. Chem. Int. Ed. 2004;43:5456–5464. doi: 10.1002/anie.200460078. - DOI - PubMed