. 2023 Jun 30;14(1):3870.
doi: 10.1038/s41467-023-39593-0.

Single cell transcriptomics identifies distinct profiles in pediatric acute respiratory distress syndrome

Affiliations

Single cell transcriptomics identifies distinct profiles in pediatric acute respiratory distress syndrome

Tim Flerlage et al. Nat Commun. .

Abstract

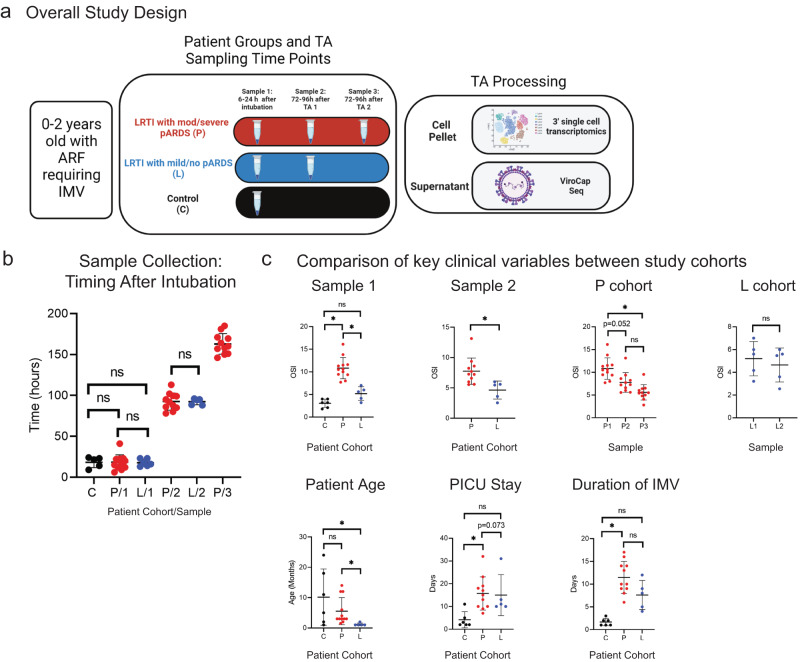
Acute respiratory distress syndrome (ARDS), termed pediatric ARDS (pARDS) in children, is a severe form of acute respiratory failure (ARF). Pathologic immune responses are implicated in pARDS pathogenesis. Here, we present a description of microbial sequencing and single cell gene expression in tracheal aspirates (TAs) obtained longitudinally from infants with ARF. We show reduced interferon stimulated gene (ISG) expression, altered mononuclear phagocyte (MNP) transcriptional programs, and progressive airway neutrophilia associated with unique transcriptional profiles in patients with moderate to severe pARDS compared to those with no or mild pARDS. We additionally show that an innate immune cell product, Folate Receptor 3 (FOLR3), is enriched in moderate or severe pARDS. Our findings demonstrate distinct inflammatory responses in pARDS that are dependent upon etiology and severity and specifically implicate reduced ISG expression, altered macrophage repair-associated transcriptional programs, and accumulation of aged neutrophils in the pathogenesis of moderate to severe pARDS caused by RSV.


Conflict of interest statement

The authors declare no competing interests.

Figures

Fig. 1
Fig. 1. Overview of Study Design and Patient Population.
a Representation of the study population, study design, and primary assays conducted on tracheal aspirate samples. Created with BioRender.com. 3’ single cell transcriptomics library preparation was performed using 10X Genomics. b Plot of the number of hours elapsed since endotracheal intubation at the time of sample collection for each patient group (n = 6 patients for C-cohort, n = 12 patients for P/1 and 11 for P/2 and P/3, and n = 5 patients for L/1 and L/2). A Kruskal-Wallis test followed by a post-hoc (Dunn’s multiple comparison test) was used to test for statistically significant differences between groups at each time point. Error bars represent the mean value for the group +/− SD. Source Data are provided as a Source Data File C, Select clinical data abstracted from the electronic medical record (EMR). (n = 6 patients for C-cohort, n = 12 patients for P-cohort Sample 1 and patient age, n = 11 patients for P-cohort Sample 2 and 3 as well as PICU stay and duration of IMV, and n = 5 patients for L-cohort). Statistical testing was performed using a two-sided Wilcoxon Rank Sum Test (for statistical testing between two groups) or a Kruskall–Wallis test followed by a post-hoc Dunn’s multiple comparison test (for statistical testing between more than two patient groups). Significant differences (p-value < 0.05) between groups following post-hoc testing are noted in the plots with an asterisk (Day 1 OSI: P_v_L p = 0.041, P_v_C p = 0.0002, L_v_C p = 0.7367; Day 4 OSI: P_v_L p = 0.0053; P-cohort OSI: P1_v_P2 p = 0.052, P1_v_P3 p < 0.0001, P2_v_P3 p = 0.113; L-cohort OSI: L1_v_L2 p = 0.5159; Subject age: P_v_L p = 0.0176, P_v_C p > 0.999, L_v_C p = 0.02; PICU LOS P_v_L p > 0.999, P_v_C p = 0.0082, L_v_C p = 0.073; Duration IMV: P_v_L p = 0.469, P_v_C p = 0.0004, L_v_C p = 0.157). Error bars represent the mean value for the group +/− SD. Source Data are provided as a Source Data File. OSI Oxygen Saturation Index, IMV Invasive Mechanical Ventilation.
Fig. 2
Fig. 2. ViroCap sequencing in tracheal aspirate supernatant confirms and supplements clinical microbiology testing.
a Proportion of total viral reads mapping to individual viruses in ViroCap sequencing performed on RNA extracted from TA supernatant. Source Data are provided as a Source Data File. b Proportion of total bacterial reads mapping to Haemophilus influenzae (H. flu), Moraxella catarrhalis (M. cat), and Streptococcus pneumoniae (S. pneumoniae) in ViroCap sequencing performed on DNA extracted from TA supernatant. Black “a” in bars indicate that the patient was receiving antibiotics at the time of sample collection. Black asterisk below the x-axis indicate that no bacterial culture was obtained from the patient for routine clinical testing. Source Data are provided as a Source Data File. c Schematic demonstrating how Patient groups were created for single cell gene expression (scGEX) analyses from initially enrolled cohorts. Created with BioRender.com. d Select clinical data abstracted from the EMR for each Patient group (n = 6 patients for C group, n = 5 patients for RSVneg group Sample 1 and patient age, n = 4 patients for RSVneg group Sample 2 and 3 as well as PICU stay and duration of IMV, n = 7 patients for RSVposP, and n = 5 patients for RSVposL). Statistical testing was performed between groups using a Kruskall-Wallis test followed by a post-hoc Dunn’s multiple comparison test. Significant differences between groups following post-hoc testing are noted with an asterisk (Sample 1: C_v_RSVneg p = 0.0068, C_v_RSVpos p = 0.0014, C_v_RSVposL p > 0.999, C_v_RSVposL p > 0.999, RSVneg_v_RSVposL p = 0.269, RSVposP_v_RSVposL p = 0.13; Sample 2: RSVneg_v_RSVposP p = 0.699, RSVneg_v_RSVposL p = 0.454, RSVposP_v_RSVposL p = 0.011; P-cohort OSI: RSVneg1_v_RSVposP1 p > 0.999, RSVneg2_v_RSVposP2 p > 0.999, RSVneg3_v_RSVposP3 p > 0.999, RSVneg1_v_RSVneg2 p = 0.788, RSVneg1_v_RSVneg3 p = 0.064, RSVposP1_v_RSVposP2 p > 0.999, RSVposP1_v_RSVposP3 p > 0.0073, RSVposP2_v_RSVposP3 p = 0.775, RSVneg2_v_RSVneg3 p > 0.999; PICU stay: C_v_RSVneg p = 0.0033, C_v_RSVposP p = 0.271, C_v_RSVposL p = 0.145, RSVneg_v_RSVposP p = 0.4499, RSVneg_v_RSVposL p > 0.999, RSVposP_v_RSVposL p > 0.999; Duration of IMV: C_v_RSVneg p = 0.0014, C_v_RSVposP p = 0.0144, C_v_RSVposL p = 0.315, RSVneg_v_RSVposP p > 0.999, RSVneg_v_RSVposL p = 0.439, RSVposP_v_RSVposL p > 0.999; Patient Age: C_v_RSVneg p > 0.999, C_v_RSVposP p > 0.999, C_v_RSVposL p = 0.041, RSVneg_v_RSVposP p = 0.716, RSVneg_v_RSVposL p = 0.0095, RSVposP_v_RSVposL p = 0.381). Error bars represent the mean value for the group +/− SD. Source Data are provided as a Source Data File. OSI Oxygen Saturation Index, IMV Invasive Mechanical Ventilation, PICU Pediatric Intensive Care Unit.
Fig. 3
Fig. 3. Single cell transcriptomics identifies illness severity and etiology-dependent differences in gene expression.
a Uniform manifold approximation and projection (UMAP) of all cells included in the final data set. b (Top) Dot plot of differentially expressed genes that identify individual cell populations as labeled in Fig. 3a. The size of the dot indicates percent of cells within an individual cluster expressing a particular transcript, and the color indicates the average expression of the transcript within the cell population. (Bottom) Feature plots (UMAP as in Fig. 3a) demonstrating percent RSV (left) and percent mitochondrial (right) gene expression. c Pie charts demonstrating percentages of cells from each patient group in aggregate single cell data at each Sample timepoint. Source Data are provided as a Source Data File. d Bar plot of proportional abundance of cells from each Patient group within each cell population as labeled in Fig. 3a at each Sample timepoint. Statistical testing was performed using a pairwise comparison of proportions with p-value adjustment using the Bonferroni correction. Lines above bars in the plot indicate significant differences in proportions between groups. A significance threshold of padj < 0.05 was used to identify statistical differences. Source Data are provided as a Source Data File.
Fig. 4
Fig. 4. Reduced ISG and cytokine signaling in epithelial cells from patients with moderate to severe pARDS.
a UMAP of epithelial cell populations subclustered from the aggregate data set and labeled by putative cell type based on gene expression. b Dot plot of differentially expressed genes that define individual cell populations within subclustered epithelial cells. Cell populations are labeled as in Fig. 4a. The size of the dot indicates percent of cells within an individual cluster expressing a particular transcript, and the color indicates the average expression of the transcript within the cell population. c (Left) Pie charts of the proportion of RSV infected and bystander epithelial cells from each patient group (Left, top) and bar plot of the proportion of all epithelial cells from each group that are RSV-infected or bystander populations (Left, bottom; n = 1125 RSV infected cells, n = 2207 bystander cells, and n = 3332 total epithelial cells). Statistical testing was performed using pairwise comparison of proportions with p-value adjustment for multiple comparisons using the Bonferroni correction. Lines above bars in the plot indicate when a significant difference in proportions between groups was found using a significance threshold of padj < 0.05; (Middle) Violin plots of RSV transcript expression levels within all epithelial cells (Middle, top) and within subsetted RSV-infected epithelial cells (Middle, bottom); (Right) Box plots of percentage of the cellular transcriptome occupied by RSV within RSV infected epithelial cells and percentage of the cellular transcriptome occupied by mitochondrial transcripts within RSV-infected epithelial cells. Testing for statistically significant differences between groups was performed using two-sided pairwise Wilcoxon rank sum testing with p-value adjustment using the Bonferroni correction. Significant differences (at a threshold of padj < 0.05) between groups are denoted with a bar and labeled as not significant (“ns”) as appropriate for comparisons of primary interest (All epis RSV expression: RSVposL_v_RSVposP p_adj = 9.9e-34; RSV infected epis RSV expression: RSVposL_v_RSVposP p_adj = 1; Percent mitochondrial: RSVpos_v_C p_adj = 0.015, RSVposL_v_RSVneg p_adj = 3.2e-7, RSVposLvRSVposP p_adj = 1.2e-13; Percent RSV: RSVposL_v_RSVposP p = 0.369). The upper whisker extends from the hinge to the highest value that is within 1.5*IQR of the hinge, where IQR is the inter-quartile range, or distance between the first and third quartiles. The lower whisker extends from the hinge to the lowest value within 1.5*IQR of the hinge. Data beyond the end of the whiskers are outliers and plotted as points (as specified by Tukey). Source Data are provided as a Source Data File. d Box plot of RSV read counts in RSVposP and RSVposL TA supernatant (n = 7 patients for RSVposP and n = 5 patients for RSVposL). The upper whisker extends from the hinge to the highest value that is within 1.5*IQR of the hinge, where IQR is the inter-quartile range, or distance between the first and third quartiles. The lower whisker extends from the hinge to the lowest value within 1.5*IQR of the hinge. Data beyond the end of the whiskers are outliers and plotted as points (as specified by Tukey). Source Data are provided as a Source Data File. e Violin plot of ISG (with the addition of IFI6) module usage by all epithelial cells from each patient group. Testing for differences between groups was performed using a Kruskal Wallis Test as well as a pairwise Wilcoxon Rank Sum Test with p-value adjustment using the Benjamini & Hochberg approach. Significant differences between groups (padj <0.05) are denoted using lines and median module usage is denoted with a bar in the violin and further annotated numerically above the violin. Source Data are provided as a Source Data File. f Bar plot of Hallmark gene set enrichment analysis (MSigDB Hallmark 2020) for pathways enriched in RSVposL compared to RSVposP epithelial cells. Differentially regulated pathways were identified using a two-sided Wilcoxon Rank Sum Test. g Receiver Operator Characteristic (ROC) curves for P and L cohort epithelial gene module differentiating between P and L cohort epithelial cells. AUC denotes Area Under the ROC curve. Source Data are provided as a Source Data File.
Fig. 5
Fig. 5. Identification of distinct etiology- and illness severity-specific MNP transcriptional programs.
a (Left) UMAP of subclustered MNPs from aggregate dataset, labeled by cluster number. (Right) Feature plots demonstrating expression levels of select transcripts within gene expression space, as indicated over each UMAP. b Dot plot of the expression level of select differentially expressed transcripts within MNP clusters. The size of the dot indicates percent of cells within an individual cluster expressing a particular transcript, and the color indicates the average expression of the transcript within the cell population. Clusters are labeled as in Fig. 5a. c Pie charts demonstrating the proportion of MNPs from each patient group at each Sample time point. Testing for significant differences between groups was performed using pairwise comparison of proportions with p-value adjustment using the Bonferroni correction (more than 2 groups being compared) and a chi-squared test with Yates continuity correction and p-value adjustment using the Bonferroni correction (two groups being compared). Source Data are provided as a Source Data File. d (Top) Volcano plot demonstrating DEGs between MNP cluster 11 and all other MNPs. DGE testing was performed using Seurat’s FindAllMarkers in default settings (Wilcoxon rank sum test with Bonferroni p-value adjustment) comparing cluster 11 to all other MNPs (a positive avg_log2FC indicates increased expression by cluster 11, and a negative avg_log2FC indicates increased expression by all other MNPs). (Bottom) Violin plot of cluster 11 module usage, grouped by Sample time point and split by patient group. Testing for statistical differences included Kruskal-Wallis and two-sided pairwise Wilcoxon rank sum testing followed by p-value adjustment using the Benjamini & Hochberg method (for comparisons between more than 2 groups) and an unpaired two-sided t test (for comparisons between two groups). Significant differences (below a threshold of padj < 0.05) between groups are indicated with a line and the median module usage for each group and sample is denoted with a bar in the violin and further annotated numerically above the violin. Source Data are provided as a Source Data File. e Feature plots demonstrating the usage of novel MNP gene modules in MNPs. f Bar plot of Hallmark gene set enrichment analysis (MSigDB Hallmark 2020) for pathways enriched in RSVposL compared to RSVposP MNPs. Differentially regulated pathways were identified using a two-sided Wilcoxon Rank Sum Test.
Fig. 6
Fig. 6. Accumulation of aged neutrophils with a unique transcriptional program in moderate to severe pARDS caused by RSV.
a (Left) UMAP of subsetted neutrophils from the aggregate data set, labeled according to putative age. (Right) Violin plots of CXCR2 and CXCR4 expression levels by neutrophil cell clusters. Cell clusters are colored and labeled as in Fig. 6a. Statistical testing for differences between groups was performed using a two-sided Wilcoxon Rank Sum Test with p-value adjustment using the Bonferroni correction. Significant differences (below a padj < 0.05) between groups is denoted with a bar (CXCR2 expression mature_v_intermediate p_adj = 5.9e-107, mature_v_aged p_adj = 0; CXCR4 expression aged_v_intermediate p_adj = 9.19e-202, aged_v_mature p_adj = 0, intermediate_v_mature p_adj = 2.7e-280). b Dot plot of transcripts differentially expressed within neutrophil cell clusters, which are labeled according to Fig. 6a. The size of the dot indicates percent of cells within an individual cluster expressing a particular transcript, and the color indicates the average expression of the transcript within the cell population. c Bar charts of proportional abundance of patient group cells within each neutrophil transcriptional cluster (labeled as in Fig. 6a). Testing for significant differences between groups was performed using pairwise proportion test with continuity correction and p-value adjustment using Bonferroni correction (more than two groups compared) and a proportion test (two groups compared). Significant differences (threshold padj < 0.05) between groups are labeled with a bar. Source Data are provided as a Source Data File. d Volcano plot demonstrating DEGs between RSVposP and all other patient groups within aged neutrophil populations. DGE testing was performed using Seurat’s FindAllMarkers in default settings (two-sided Wilcoxon rank sum test with Bonferroni p-value adjustment). A positive avg_log2FC indicates increased expression in RSVposP aged neutrophils relative to other patient groups. Source Data are provided as a Source Data File. e Violin plot of RSVposP aged neutrophil module usage, grouped by Sample time point and split by patient group. Testing for statistical differences included Kruskal-Wallis and pairwise two-sided Wilcoxon rank sum testing followed by p-value adjustment using the Benjamini & Hochberg method (for comparisons between more than 2 groups) and an unpaired two-sided t test (for comparisons between two groups). Significant differences (below a threshold of padj < 0.05) between groups are indicated with a line above the violin (Sample 1: RSVneg_v_C p_adj = 0.193, RSVposP_v_C p_adj = 0.0094, RSVposL_v_C p_adj = 0.139, RSVposP_v_RSVneg p_adj = 0.013, RSVposL_v_RSVneg p_adj = 7.5e-8, RSVposL_v_RSVposP p_adj<2e-16; Sample 2: RSVneg_v_RSVposP p_adj<2e-16, RSVneg_v_RSVposP p_adj<2e-16, RSVposP_v_RSVposL p_adj<2e-16; Sample 3: RSVneg_v_RSVposP p_adj<2e-16; Mature Sample1_v_Sample2 p_adj<2e-16, Sample1_v_Sample3 p_adj = 0.033, Sample2_v_Sample3 p_adj<2e-16; Intermediate Sample1_v_Sample2 p_adj = 8.6e-14, Sample1_v_Sample3 p_adj = 0.91, Sample2_v_Sample3 p_adj<2e-16; Aged Sample1_v_Sample2 p_adj = 1.1e-10, Sample1_v_Sample3 p_adj<2.2e-16, Sample2_v_Sample3 p_adj<2e-16) and median module usage is indicated with a bar in the violin and further annotated numerically above the violin. Source Data are provided as a Source Data File. f Receiver Operator Characteristic (ROC) curves for RSVposP aged neutrophil gene module differentiating between RSVposP and RSVposL group neutrophils. AUC denotes Area Under the ROC curve.
Fig. 7
Fig. 7. Identification of FOLR3 as a potential airway marker of severity in pARDS.
a UMAP plots of Sample 1 cells in aggregate split and colored by Patient cohort of origin. b Volcano plot demonstrating DEGs between P and L Patient cohort Sample 1 TA cells. DGE testing was performed using Seurat’s FindAllMarkers in default settings (Wilcoxon rank sum test with Bonferroni p-value adjustment) comparing Sample 1 P-cohort cells and Sample 1 L-cohort cells (a positive avg_log2FC indicates increased expression P-cohort cells and a negative avg_log2FC indicates increased expression in L-cohort cells). Source Data are provided as a Source Data File. c Dot plot of demonstrating expression of transcripts identified in Fig. 7b by each Patient cohort at the Sample 1 time point. The size of the dot indicates percent of cells from an individual patient cohort expressing a particular transcript, and the color indicates the average expression of the transcript within the cell population. d Dot plot demonstrating expression of transcripts identified in Fig. 7b by each cell population at the Sample 1 time point. The size of the dot indicates percent of cells from an individual cell population expressing a particular transcript, and the color indicates the average expression of the transcript within the cell population. e Concentrations of select analytes measured in tracheal aspirate samples from patients enrolled in another study at a different institution (n = 4 patients for Mod_Severe, n = 7 patients for No_Mild analytes measured by ELISA and n = 8 for analytes measured by Luminex). Statistical testing was performed between groups using an unpaired two-tailed t-test. P-values for statistical comparisons between groups are noted in the plots. Source Data are provided as a Source Data File.

References

    1. Khemani RG, et al. Paediatric acute respiratory distress syndrome incidence and epidemiology (PARDIE): an international, observational study. Lancet Respir. Med. 2019;7:115–128. doi: 10.1016/S2213-2600(18)30344-8. - DOI - PMC - PubMed
    1. Thompson BT, Chambers RC, Liu KD. Acute respiratory distress syndrome. N. Engl. J. Med. 2017;377:562–572. doi: 10.1056/NEJMra1608077. - DOI - PubMed
    1. Bellingan GJ. The pulmonary physician in critical care * 6: the pathogenesis of ALI/ARDS. Thorax. 2002;57:540–546. doi: 10.1136/thorax.57.6.540. - DOI - PMC - PubMed
    1. Rosseau S, et al. Phenotypic characterization of alveolar monocyte recruitment in acute respiratory distress syndrome. Am. J. Physiol. Lung Cell. Mol. Physiol. 2000;279:L25–L35. doi: 10.1152/ajplung.2000.279.1.L25. - DOI - PubMed
    1. Schütte H, et al. Bronchoalveolar and systemic cytokine profiles in patients with ARDS, severe pneumonia and cardiogenic pulmonary oedema. Eur. Respir. J. 1996;9:1858–1867. doi: 10.1183/09031936.96.09091858. - DOI - PubMed

Publication types