. 2023 Jun 30;14(1):3868.
doi: 10.1038/s41467-023-39368-7.

Full thermoelectric characterization of a single molecule

Affiliations

Full thermoelectric characterization of a single molecule

Andrea Gemma et al. Nat Commun. .

Abstract

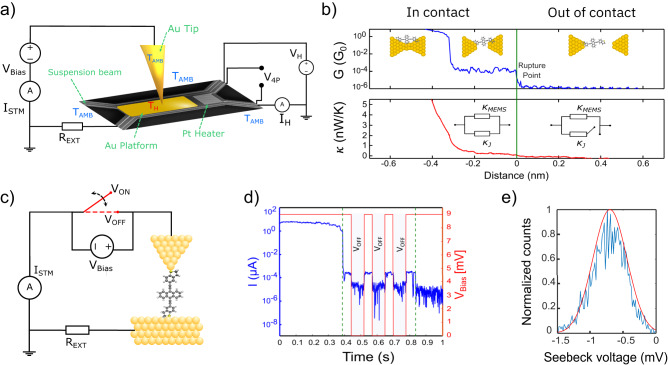
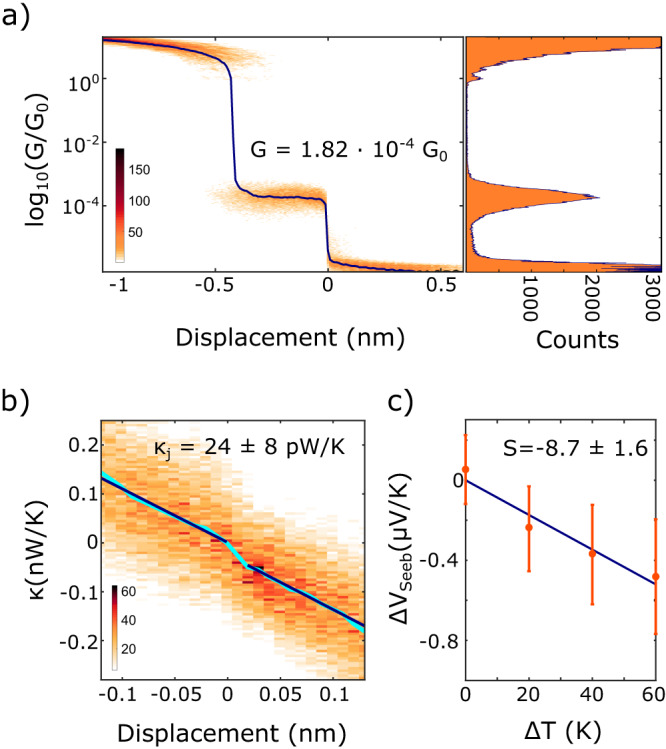
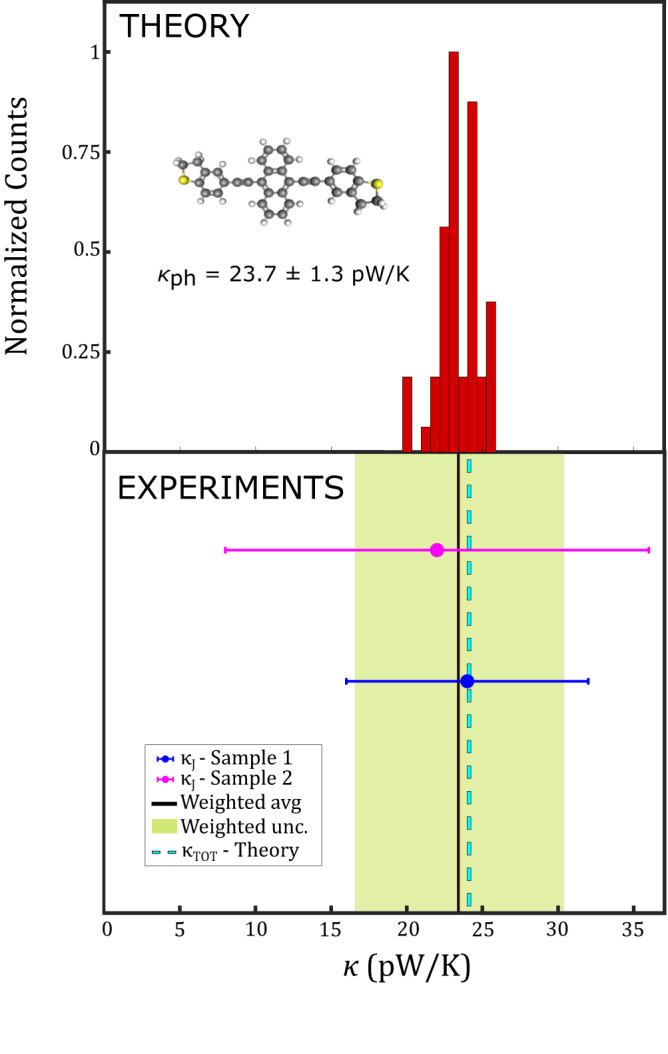
Molecules are predicted to be chemically tunable towards high thermoelectric efficiencies and they could outperform existing materials in the field of energy conversion. However, their capabilities at the more technologically relevant temperature of 300 K are yet to be demonstrated. A possible reason could be the lack of a comprehensive technique able to measure the thermal and (thermo)electrical properties, including the role of phonon conduction. Here, by combining the break junction technique with a suspended heat-flux sensor, we measured the total thermal and electrical conductance of a single molecule, at room temperature, together with its Seebeck coefficient. We used this method to extract the figure of merit zT of a tailor-made oligo(phenyleneethynylene)-9,10-anthracenyl molecule with dihydrobenzo[b]thiophene anchoring groups (DHBT-OPE3-An), bridged between gold electrodes. The result is in excellent agreement with predictions from density functional theory and molecular dynamics. This work represents the first measurement, within the same setup, of experimental zT of a single molecule at room temperature and opens new opportunities for the screening of several possible molecules in the light of future thermoelectric applications. The protocol is verified using SAc-OPE3, for which individual measurements for its transport properties exist in the literature.


Conflict of interest statement

The authors declare no competing interests.

Figures

Fig. 1
Fig. 1. Experimental setup and measurement protocol.
a Schematic representation of the MEMS structure used in the differential measurement of the junction thermal conductance κJ. b The electrical conductance, G, is used as reference (green vertical line) to find the rupture point of the molecular plateau. The thermal conductance is then obtained as the difference between the values before and after the rupture point. c Schematic representation of the technique used for the thermoelectric characterization of a single molecule junction. The red switch represents the biasing status of the tip. When no electrical bias is applied, the measured current consists of only the thermoelectric contribution; d typical example of an opening trace: I(t) and VBias(t) for a single-molecule junction. The green-dashed lines represent the breaking points for the single atom and single-molecule junctions, respectively; e typical Seebeck voltage measured across the junction when VBias = 0, here at ΔT = 40 K. The width of the distribution is given by the different configurations the molecule can assume inside the junction.
Fig. 2
Fig. 2. Experimental thermoelectric characterization for a single DHBT-OPE3-An junction obtained at room temperature.
a Left side: 2D histogram of the electrical conductance G vs. displacement (opening trace), obtained from 297 traces. The dark blue line is the median of the histogram (logarithmic binning). Right side: 1D histogram of the electrical conductance for the same molecule. The maximum of the molecular peak is located at 1.82×10⁴ G0. b 2D histogram of the thermal conductance κ vs. displacement (opening trace), measured with ΔT = 20 K. The pale blue line is the median of the 2D histogram. The dark blue lines are the two fits before and after the molecular rupture point. c Seebeck voltage vs. applied temperature differences ΔT. The slope of the blue line is the Seebeck coefficient (also called thermopower), the error bars indicate the width of the Seebeck voltage distribution for the given ΔT. a and c are adapted from ref. , with permission from the Royal Society of Chemistry.
Fig. 3
Fig. 3. Histogram of the theoretical phononic contribution κph to the total thermal conductance of the junction (top) vs. experimental total thermal conductance κJ (bottom).
In the top panel, the results obtained from MD simulations for the phononic thermal conductance of the DHBT-OPE3-An molecule are represented in the form of a histogram. The structure of the DHBT-OPE3-An molecule is also shown (carbon atoms in gray, hydrogen atoms in white, sulfur atoms in yellow). In the bottom panel, the black solid line is the weighted average (avg) between the two experiments, represented here by the two circles (sample 1, sample 2), each with their own uncertainty. The green shaded area, instead, represents the uncertainty (unc.) on the weighted average. For comparison with the experimental values, the cyan dashed line represents the total predicted thermal conductance κTOT obtained as a sum of the theoretical phonon conductance κph (i.e., the average of the theoretical histogram on top) plus the theoretical electronic contribution κel predicted by means of density functional theory.

References

    1. Gotsmann B, Gemma A, Segal D. Quantum phonon transport through channels and molecules—a perspective. Appl. Phys. Lett. 2022;120:160503. doi: 10.1063/5.0088460. - DOI
    1. Cui L, Miao R, Jiang C, Meyhofer E, Reddy P. Perspective: Thermal and thermoelectric transport in molecular junctions. J. Chem. Phys. 2017;146:092201. doi: 10.1063/1.4976982. - DOI
    1. Tao, N. J. Electron transport in molecular junctions. Nanosci. Technol. 185–193, 10.1142/9789814287005_0019 (2009).
    1. Mosso N, et al. Thermal transport through single-molecule junctions. Nano Lett. 2019;19:7614–7622. doi: 10.1021/acs.nanolett.9b02089. - DOI - PubMed
    1. Cui L, et al. Thermal conductance of single-molecule junctions. Nature. 2019;572:628–633. doi: 10.1038/s41586-019-1420-z. - DOI - PubMed