. 2023 Jun 30;14(1):3878.
doi: 10.1038/s41467-023-39484-4.

Differentiation of IL-26+ TH17 intermediates into IL-17A producers via epithelial crosstalk in psoriasis

Affiliations

Differentiation of IL-26+ TH17 intermediates into IL-17A producers via epithelial crosstalk in psoriasis

Anissa Fries et al. Nat Commun. .

Abstract

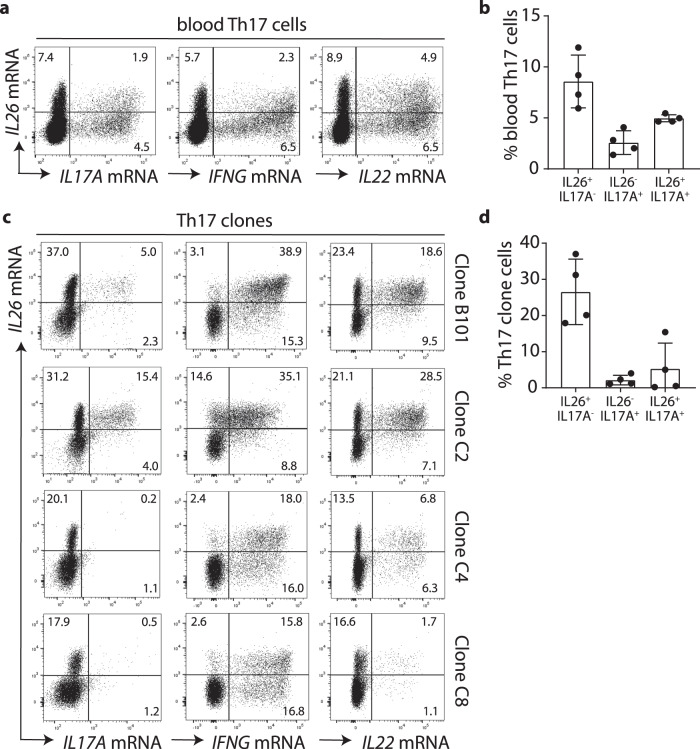
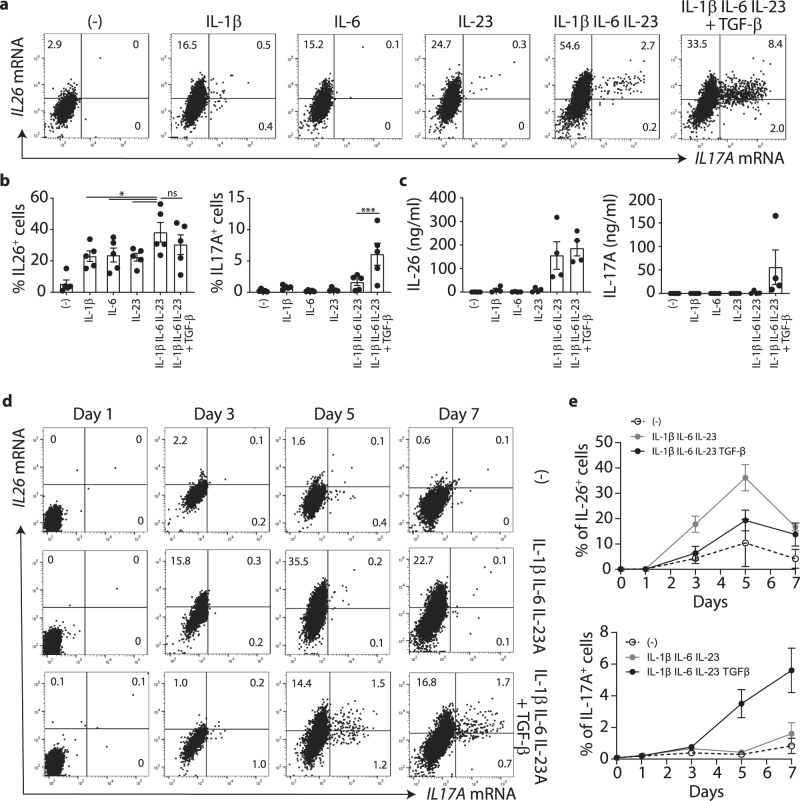
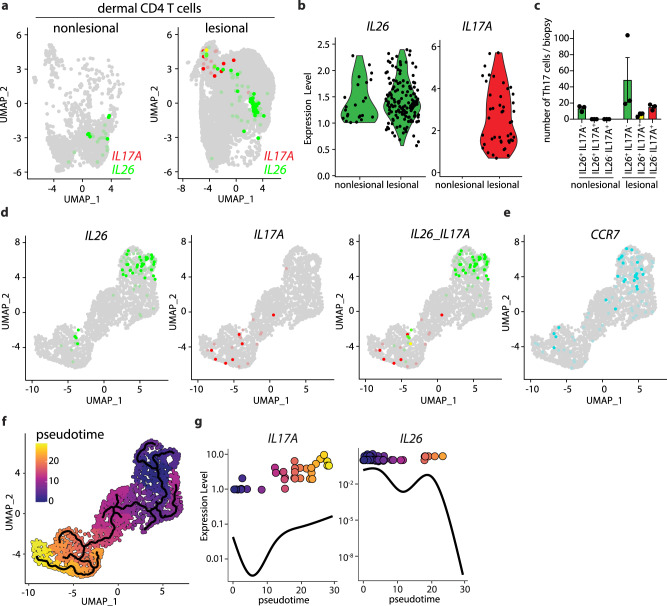
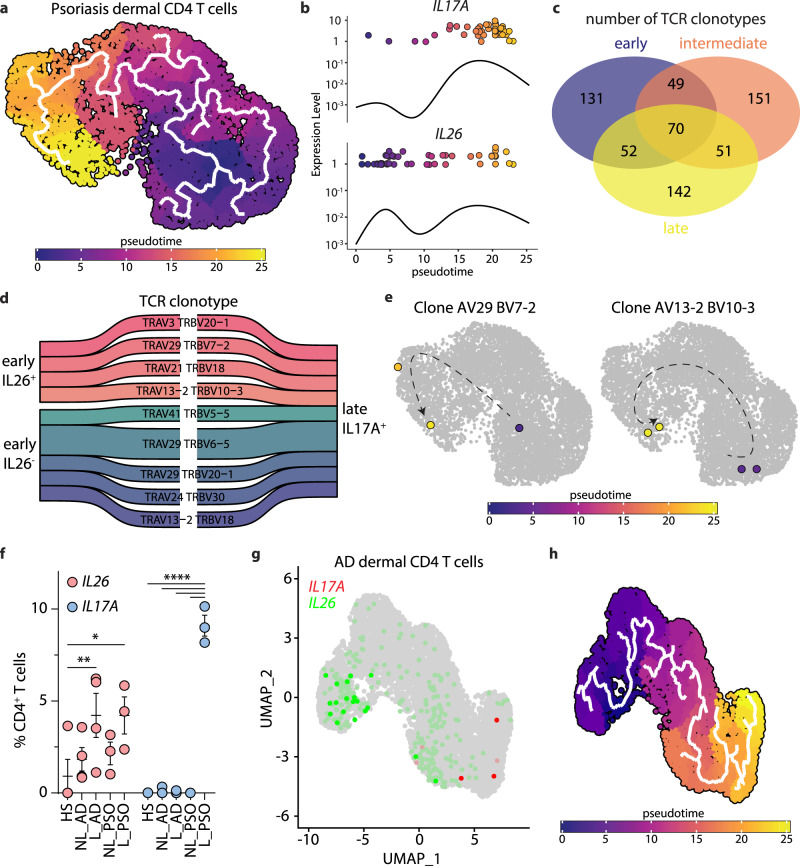
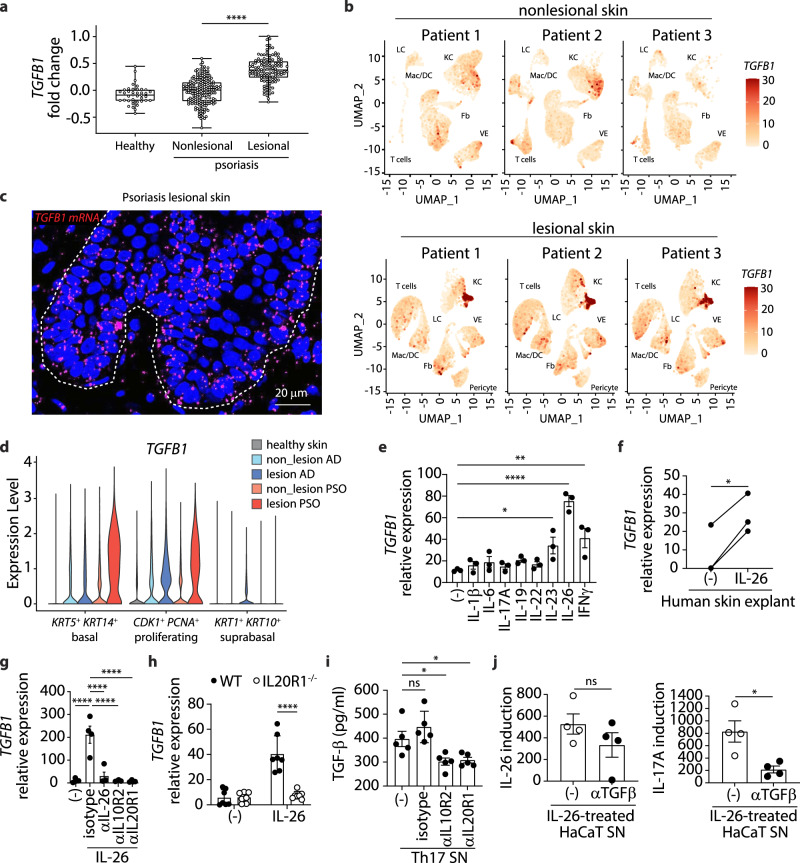
Interleukin (IL)-26 is a TH17 cytokine with known antimicrobial and pro-inflammatory functions. However, the precise role of IL-26 in the context of pathogenic TH17 responses is unknown. Here we identify a population of blood TH17 intermediates that produce high levels of IL-26 and differentiate into IL-17A-producing TH17 cells upon TGF-β1 exposure. By combining single cell RNA sequencing, TCR sequencing and spatial transcriptomics we show that this process occurs in psoriatic skin. In fact, IL-26+ TH17 intermediates infiltrating psoriatic skin induce TGF-β1 expression in basal keratinocytes and thereby promote their own differentiation into IL-17A-producing cells. Thus, our study identifies IL-26-producing cells as an early differentiation stage of TH17 cells that infiltrates psoriatic skin and controls its own maturation into IL17A-producing TH17 cells, via epithelial crosstalk involving paracrine production of TGF-β1.


Conflict of interest statement

J.D.D. and M.G. are inventors of a patent entitled “IL-26 inhibitors” (WO2017009392A1). R.G. declares ownership in Ozette Technologies. The remaining authors declare no competing interests.

Figures

Fig. 1
Fig. 1. Circulating TH17 cells contain a large cell population expressing IL26 but not IL17A.
a Flow-FISH analysis of IL-26, IL-17A, IFN-γ, and IL-22 mRNA expression in memory TH17 cells isolated from peripheral blood. Data shown are from one representative donor. b Frequencies of IL26 and IL17A single producing T cells and IL26/IL17A double producers among blood memory TH17 cells. Data represent the mean ± SD (n = 4 independent donors). c Flow-FISH analysis of IL-26, IL-17A, IFNγ, and IL-22 mRNA expression in four independent TH17 cell clones (B101, C2, C4, and C8). d Frequencies of IL26 and IL17A single-positive cells, and IL26/IL17A double positive cells among TH17 cell clones Data are mean ± SD (n = 4). Source data are provided as a Source Data file.
Fig. 2
Fig. 2. Rapid TGF-β1 independent differentiation of IL26+ but not IL17A+ TH17 cells.
a Flow-FISH analysis of IL-26 and IL-17A mRNA expression in naive CD4 T cells stimulated for 7 days in the presence of either single cytokines or a mix of the TH17 polarizing cytokines IL-1β, IL-6, IL-23, with or without TGF-β1. Data from one representative donor are shown. b Percentages of IL26+ and IL17A+ T cells in cultures described in (a). Data are mean + SEM of 5 independent donors. Data were statistically analyzed using one-way ANOVA followed by Tukey’s multiple comparisons test. *p = 0.0255; ***p = 0.0003. c ELISA measurement of secreted IL-26 and IL−17A by T cells obtained by a 7-day stimulation of naive CD4 T cells as in (a). Data are mean ± SEM of 4 independent donors. d Flow-FISH analysis of the expression kinetics of IL-26 and IL-17A mRNA in naive CD4 T cells stimulated for 7 days either alone, or in the presence of TH17 polarizing cytokines IL-1β, IL-6, IL-23, with or without TGF-β1. Data from one representative donor are shown. e Percentages of IL26+ and IL17A+ T cells cultured as in (d). Data are mean ± SD of 3 independent donors. Source data are provided as a Source Data file.
Fig. 3
Fig. 3. IL26+ TH17 cells differentiate into IL-17A producers in the presence of TGF-β1.
a Flow-FISH analysis of IL-26 and IL-17A mRNA expression in blood memory TH17 cells re-stimulated with anti-CD3/CD28 for 7 days in the presence of TGF-β1. Data from one representative donor is shown. b Percentages of IL26 and IL17A single-positive cells, and IL26/IL17A double positive cells among blood TH17 cells stimulated as in (a). Data are mean ± SD of 3 independent donors. c ELISA measurement of IL-26 and IL-17A secretion by TH17 cells stimulated for 7 days with or without addition of TGF-β1. Data are mean ± SEM of 4 independent donors. Data were statistically analyzed using two-tailed unpaired Student’s t-test. **p = 0.0065. Source data are provided as a Source Data file.
Fig. 4
Fig. 4. Psoriatic skin contain IL26+ T cells that differentiate into TGF-β–imprinted IL17A+ T cells.
a UMAP projection of the single-cell transcriptomes of dermal CD4 T cells from nonlesional (left) and lesional (right) skin of 3 psoriasis patients colored according to the expression level of IL-26 (green) and IL-17A (red). b Expression level of IL-26 and IL-17A in dermal CD4 T cells as in (a). c Number of IL26 and IL17A single-positive, and IL26/IL17A double positive dermal CD4 T cells in nonlesional and lesional skin of psoriasis patients. Data represent the mean ± SEM of 3 independent patient samples. d, e UMAP projection of the single-cell transcriptomes of cytokine-producing dermal CD4 T cells from lesional skin colored according to the expression level of IL26 (green), IL17A (red), and CCR7 (blue). f UMAP projection of the single-cell transcriptomes of dermal CD4 T cells as in (a) colored according to the inferred pseudotime. Solid lines are trajectories of gene expression changes learned by Monocle 3. g Dynamics of IL17A and IL26 gene expression in dermal CD4 T cells over pseudotime. Solid lines show the expression average. Source data are provided as a Source Data file.
Fig. 5
Fig. 5. IL26+ cells differentiate into IL-17A-producing cells at the clone level.
a UMAP projection of the single-cell transcriptomes of nonlesional and lesional psoriatic skin CD4 T cells from two merged datasets colored according to the inferred pseudotime. b Dynamics of IL17A and IL26 gene expression in skin CD4 T cells over pseudotime. Solid lines show the expression average. c Venn diagram of the number of shared TCR clonotypes between CD4 T cells at early (<10), intermediate, and late (>15) pseudotime. d Sankey diagram of the shared TCR clonotypes between late IL17A+ CD4 T cells and early IL26+ or IL26 CD4 T cells. e UMAP projection of the single-cell transcriptomes of two different TCR clones colored according to the inferred pseudotime. f Percentages of IL26+ and IL17A+ cells among CD4+ T cells from healthy (HS), nonlesional (NL), and lesional (L) skin of atopic dermatitis (AD) and psoriasis (PSO) patients. Data were statistically analyzed using two-way ANOVA followed by Tukey’s multiple comparisons test. *p = 0.0181, **p = 0.0094, ****p < 0.0001. Data represent the mean ± SEM of 3 independent patient samples. g UMAP projection of the single-cell transcriptomes of dermal CD4 T cells from AD lesional skin colored according to the expression level of IL26 (green), and IL17A (red). h UMAP projection of the single-cell transcriptomes of dermal CD4 T cells as in (g) colored according to the inferred pseudotime. Solid lines are trajectories of gene expression changes learned by Monocle 3. Source data are provided as a Source Data file.
Fig. 6
Fig. 6. Increased TGF-β1 expression by psoriatic keratinocytes induced by IL-26.
a Expression fold change of TGFB1 in healthy skin (n = 40) and nonlesional (n = 199) and lesional (n = 120) skin from psoriasis patients using the SSF Bioinformatics hub. Data are represented as a box plot which bounds extends from the 25th to 75th percentiles, a middle line is plotted at the median, and whiskers go from the minimal to maximal value Data were statistically analyzed using one-way ANOVA followed by Tukey’s multiple comparisons test. ****p < 0.0001. b UMAP projection of the single-cell transcriptomes of total cells from nonlesional (top) and lesional (bottom) skin of 3 psoriasis patients colored according to the expression level of TGFB1. LC Langherans cells, KC keratinocytes, Mac/DC macrophages and dendritic cells, Fb fibroblasts, VE vascular endothelial cells. c Confocal microscopy image of lesional psoriatic skin representative of 5 patients stained for TGF-β mRNA. Dashed line delineates the dermo-epidermal junction. d Violin plots of TGFB1 expression by basal (KRT5+, KRT14+), proliferating (CDK1+, PCNA+), and differentiated suprabrasal (KRT1+, KRT10+) keratinocytes using single-cell RNAseq data from nonlesional and lesional skin of atopic dermatitis and psoriasis patients. e, Expression of TGFB1 in NHEK cells treated with different cytokines for 16 h. Data represent mean ± SEM of 3 biological replicates from one representative donor. Data were statistically analyzed using one-way ANOVA followed by Tukey’s multiple comparisons test. *p = 0.036; **p = 0.0063, ****p < 0.0001. f Expression of TGFB1 in healthy skin treated with IL-26 for 4 h. Data represent 3 independent donors. Data were statistically analyzed using two-tailed paired Student’s t-test. *p = 0.0122. g Expression of TGFB1 in NHEK cells treated overnight with IL-26 in the presence of blocking antibodies against IL-26, IL10R2, and IL20R1. Data represent mean ± SEM of 4 biological replicates from one donor. Data were statistically analyzed using one-way ANOVA followed by Tukey’s multiple comparisons test. ****p < 0.0001. h Expression of TGFB1 in WT or IL20R1−/− HaCaT cells treated overnight with IL-26. Data represent mean ± SEM of 7 biological replicates. Data were statistically analyzed using one-way ANOVA followed by Tukey’s multiple comparisons test. ****p < 0.0001. i, Amounts of TGF-β1 produced by HaCaT cells treated overnight with TH17 cell supernatants (from 5 independent donors) in the presence of blocking antibodies against IL10R2 and IL20R1, or control isotype. Data represent mean ± SEM. Data were statistically analyzed using one-way ANOVA followed by Tukey’s multiple comparisons test. *p = 0.0124 (aIL10R2), *p = 0.018 (aIL20R1). j Amounts of IL-26 (left) and IL-17A (right) produced by blood TH17 cells (from 4 independent donors) treated for 7 days with IL-26-treated HaCaT cell supernatants in the presence of blocking antibodies against TGF-β. Data represent mean ± SEM. Data were statistically analyzed using two-tailed unpaired Student’s t-test. *p = 0.014. eh Expression values measured by RT-qPCR were normalized to the reference gene GAPDH. Source data are provided as a Source Data file.
Fig. 7
Fig. 7. Spatial vicinity of IL26+ T cells with TGF-β1 expressing keratinocytes in psoriatic skin lesions.
a Spatial mapping of TGFB1 and IL26 expression in the lesional skin of a psoriasis patient. White circles show IL26+TGFB1+ double positive spots. b Expression level of CXCL8, IL1B, IL33, and CCL20 in IL26+ spots (n = 32) in one representative patient sample. Data represent mean ± SEM. c Percentages of IL26+ spots that are single-positive or double positive for CXCL8, IL1B, IL33, and CCL20. d Density distribution and e Empirical Cumulative Distribution Function (ECDF) of the shortest distance between spots containing IL26- or IFNG-positive T cells and spots containing TGFB1-expressing keratinocytes. The D and p values of two-sided two-sample Kolmogorov–Smirnov distance test are shown. f Confocal microscopy images of lesional psoriatic skin representative of 5 patients stained for CD3 (green), IL-26 (red), and TGF-β1 (orange). Dashed line delineates the dermo-epidermal junction. g Spatial mapping of IL26+ (green) and IL17A+ (red) spots in the lesional skin of an atopic dermatitis (left) and psoriasis (middle) patient. Spots over the dermis (gray) and epidermis (blue) are colored differently. Quantification of IL26+ and IL17A+ spots in contact or not with the epidermis in atopic dermatitis (n = 2 skin sections of 5 patients) and psoriasis (n = 2 skin sections of 3 patients) patient skin samples (right) is shown. Data are mean + SEM Data were statistically analyzed using two-way ANOVA followed by Sidak’s multiple comparisons test. ***p = 0.0006, ****p < 0.0001. Source data are provided as a Source Data file.

References

    1. Harrington LE, et al. Interleukin 17-producing CD4+ effector T cells develop via a lineage distinct from the T helper type 1 and 2 lineages. Nat. Immunol. 2005;6:1123–1132. doi: 10.1038/ni1254. - DOI - PubMed
    1. Park H, et al. A distinct lineage of CD4 T cells regulates tissue inflammation by producing interleukin 17. Nat. Immunol. 2005;6:1133–1141. doi: 10.1038/ni1261. - DOI - PMC - PubMed
    1. Korn T, Bettelli E, Oukka M, Kuchroo VK. IL-17 and Th17 Cells. Ann. Rev. Immunol. 2009;27:485–517. doi: 10.1146/annurev.immunol.021908.132710. - DOI - PubMed
    1. Brembilla NC, Senra L, Boehncke WH. The IL-17 family of cytokines in psoriasis: IL-17A and beyond. Front. Immunol. 2018;9:1682. doi: 10.3389/fimmu.2018.01682. - DOI - PMC - PubMed
    1. Meller S, et al. T(H)17 cells promote microbial killing and innate immune sensing of DNA via interleukin 26. Nat. Immunol. 2015;16:970–979. doi: 10.1038/ni.3211. - DOI - PMC - PubMed

Publication types

Substances