. 2023 Jun 30;14(1):3877.
doi: 10.1038/s41467-023-39607-x.

Ultrasound-responsive low-dose doxorubicin liposomes trigger mitochondrial DNA release and activate cGAS-STING-mediated antitumour immunity

Affiliations

Ultrasound-responsive low-dose doxorubicin liposomes trigger mitochondrial DNA release and activate cGAS-STING-mediated antitumour immunity

Chaoyu Wang et al. Nat Commun. .

Abstract

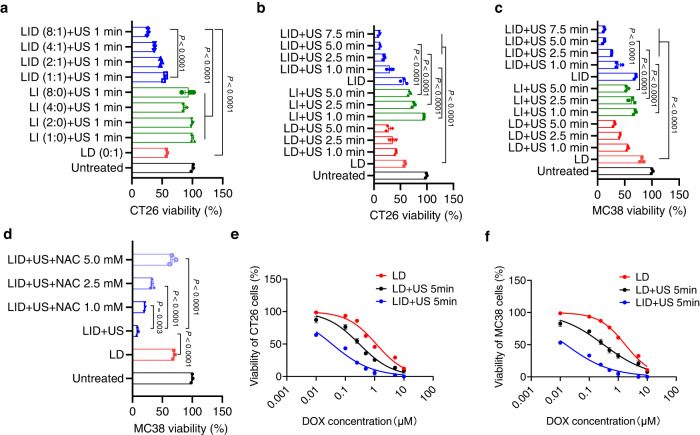
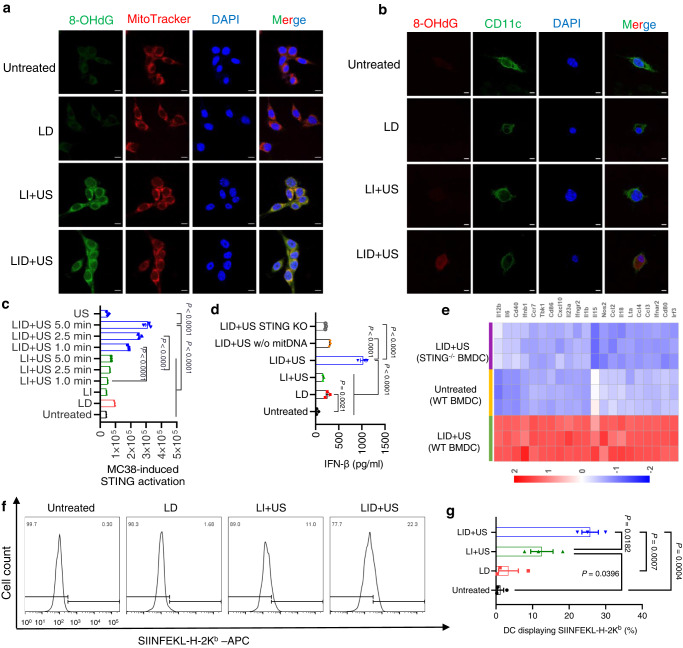
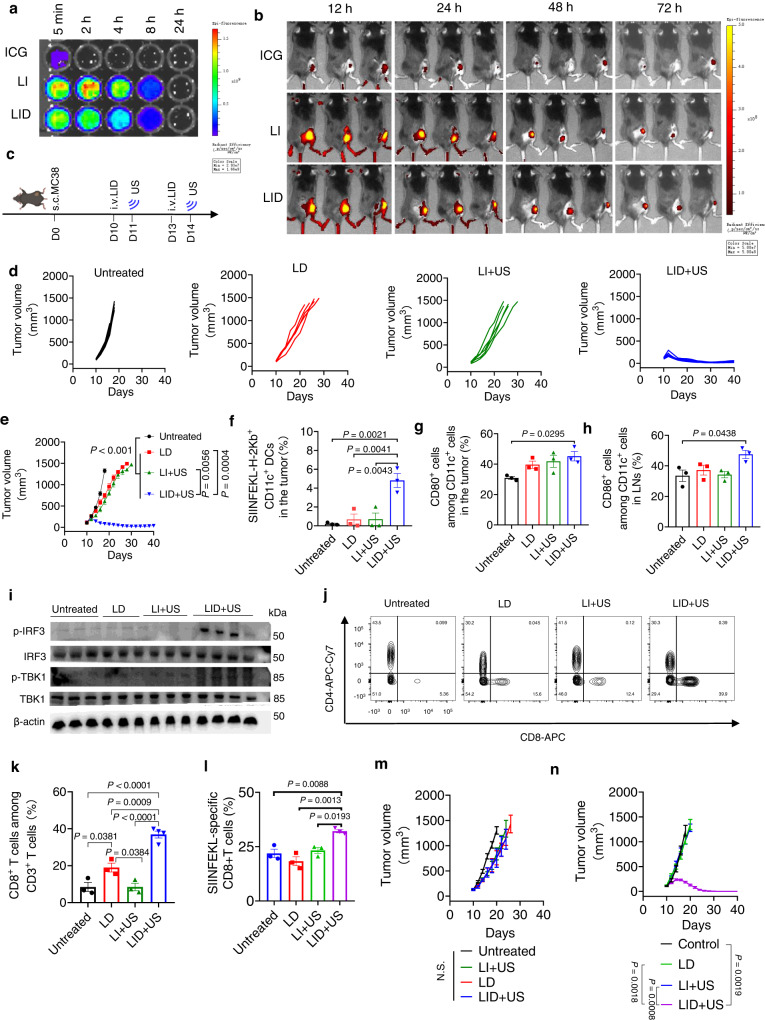
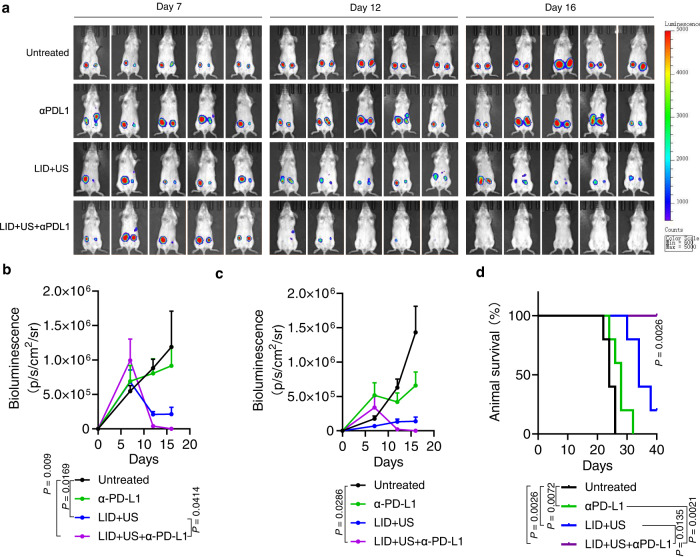
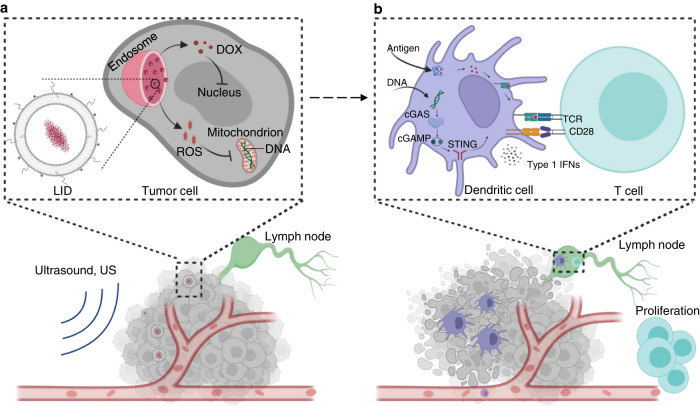
DNA derived from chemotherapeutics-killed tumor cells is one of the most important damage-associated molecular patterns that can activate the cGAS-STING (cyclic GMP-AMP synthase-stimulator of interferon genes) pathway in antigen-presenting cells (APCs) and promote antitumor immunity. However, conventional chemotherapy displays limited tumor cell killing and ineffective transfer of stable tumor DNA to APCs. Here we show that liposomes loaded with an optimized ratio of indocyanine green and doxorubicin, denoted as LID, efficiently generate reactive oxygen species upon exposure to ultrasound. LID plus ultrasound enhance the nuclear delivery of doxorubicin, induce tumor mitochondrial DNA oxidation, and promote oxidized tumor mitochondrial DNA transfer to APCs for effective activation of cGAS-STING signaling. Depleting tumor mitochondrial DNA or knocking out STING in APCs compromises the activation of APCs. Furthermore, systemic injection of LID plus ultrasound over the tumor lead to targeted cytotoxicity and STING activation, eliciting potent antitumor T cell immunity, which upon the combination with immune checkpoint blockade leads to regression of bilateral MC38, CT26, and orthotopic 4T1 tumors in female mice. Our study sheds light on the importance of oxidized tumor mitochondrial DNA in STING-mediated antitumor immunity and may inspire the development of more effective strategies for cancer immunotherapy.


Conflict of interest statement

A patent application (202210306460.1) has been filed based on the ultrasound responsive chemotherapeutics for STING activation, with R.K., C.W., R.Z., and J.H. as inventors. J.M.K. and R.K. hold equity and consult for Corner Therapeutics, a company that has licensed IP generated by J.M.K. and R.K. that may benefit financially if the IP is further validated. J.M.K. has been a paid consultant and or equity holder for multiple biotechnology companies (listed here https://www.karplab.net/team/jeff-karp). The interests of JMK were reviewed and are subject to a management plan overseen by his institutions in accordance with its conflict of interest policies. The remaining authors declare no competing interests.

Figures

Fig. 1
Fig. 1. Preparation and characterization of liposomal ICG/DOX (LID).
a Schematic showing the preparation of LID. Blank liposomes were prepared with 250 mM (NH4)2SO4, followed by removal of external (NH4)2SO4 using size exclusion chromatography to establish the transmembrane gradient. DOX was incubated with the blank liposomes at 55°C to enable drug loading. When NH3 escaped liposomes, one H+ was produced and retained in the liposome, resulting in an acidic core. When DOX diffused into the liposome, it became protonated and trapped within the liposome. As DOX loading into the liposome transiently increased the internal pH, it further increased the level of ammonia and created more H+, allowing more DOX to be loaded into the liposome. Ultimately, DOX forms a crystalline precipitate due to the presence of sulfate anions inside the liposome. ICG was covalently attached to DOPE before incubation with DOX-loaded liposomes such that DOPE could anchor ICG onto liposomes. b The absorption spectrum of LID. c representative size distribution of LID measured by dynamic laser scattering (DLS). d Cryo-electron microscopy (cryo-EM) of LID, scale bar = 100 nm. White arrows indicate low-dose DOX nanocrystals. The data are representative of two independent experiments (bd). Source data are provided as a Source Data file.
Fig. 2
Fig. 2. LID + US efficiently generated ROS and promoted DOX delivery to the nuclei of tumor cells.
a ROS generation in CT26 cells induced by indicated formulations with or without ultrasound (US). The data were analyzed by one-way analysis of variance (ANOVA) with Tukey’s multiple comparisons post test. Data represent mean ± SEM (n = 3 experimental replicates per group). b Confocal images showing ROS generation in CT26 tumor cells induced by indicated formulations with or without ultrasound (US). Scale bars, 10 μm. c MC38 tumor cells were incubated with indicated formulations for 24 h, and then ultrasound (US) was applied to selected groups. After another 24 h, intracellular delivery of DOX was imaged by confocal microscopy. Scale bars, 10 μm. The data are representative of two independent experiments (b, c). Source data are provided as a Source Data file.
Fig. 3
Fig. 3. Ultrasound responsive chemotherapeutics exhibited potent tumor cell killing in vitro in an ultrasound dependent manner.
a CT26 tumor cells were treated with indicated formulations containing different concentrations of ICG/DOX for 24 h, and then ultrasound (1 min) was applied to selected groups. After 24 h, the cell viability was measured by the cell counting kit. Numbers in the parenthesis indicate the weight ratio of ICG and DOX (n = 3 experimental replicates per group). b, c Viability of CT26 or MC38 tumor cells treated with indicated formulations with or without ultrasound. ICG was fixed at 3 μM, DOX was fixed at 0.5 μM, and ultrasound exposure time was between 1 min and 7.5 min (n = 3 experimental replicates per group). d Effect of ROS scavenger NAC on the viability of MC38 cells treated with indicated formulations (n = 3 experimental replicates per group). e, f IC50 of DOX in CT26 or MC38 tumor cells for indicated formulations (n = 3 experimental replicates per group). The data represent mean ± SEM. af Data were analyzed by one-way analysis of variance (ANOVA) with Tukey’s multiple comparisons post test. Source data are provided as a Source Data file.
Fig. 4
Fig. 4. Tumor cells killed by ultrasound-responsive chemotherapeutics triggered STING activation and antigen presentation.
a CT26 tumor cells were treated with indicated formulations for 24 h. Ultrasound (2 W/cm2, 50% duty cycle, 5 min) was applied to selected groups. After 24 h, the cells were stained by an anti-8OHdG antibody and MitoTracker to label oxidized tumor DNA and mitochondria before confocal microscopy. Scale bars, 10 μm. b MC38 tumor cells were treated with indicated formulations for 24 h. Ultrasound (2 W/cm2, 50% duty cycle, 5 min) was applied to selected groups. After 24 h, BMDCs were added and co-cultured for another 24 h, followed by staining with anti-8OHdG and CD11c antibodies before confocal microscopy. Scale bars, 5 μm. The data are representative of two independent experiments (a, b). c MC38-OVA tumor cells were treated with indicated formulations for 24 h. Different lengths of ultrasound (2 W/cm2, 50% duty cycle) were applied to selected groups. After 24 h, RAW-luciaTM ISG reporter cells were added and co-cultured for another 24 h, followed by measuring the luminescence signal from RAW-luciaTM ISG reporter cells (n = 3 experimental replicates per group). d MC38 tumor cells with mitochondria DNA depleted by using dideoxycytidine (ddC) were treated with indicated formulations for 24 h. Ultrasound (2 W/cm2, 50% duty cycle, 5 min) was applied to selected groups. After 24 h, BMDCs were added and co-cultured for another 24 h, followed by measuring IFNβ using the ELISA kit (n = 3 experimental replicates per group). e MC38 tumor cells were treated with indicated formulations. After 24 h, WT BMDC or STING-/- BMDC were added to tumor cells and co-cultured for another 24 h, followed by RNA-seq of BMDC (n = 3 experimental replicates per group). f, g MC38-OVA cells were treated with indicated formulations for 24 h. Then ultrasound (2 W/cm2, 50% duty cycle, 5 min) was applied to selected groups. After 24 h, BMDCs were added and co-cultured for 24 h before antigen presentation on BMDCs was measured by flow cytometry. Shown are (f) representative histograms of antigen presentation on BMDCs and (g) percentages of BMDCs presenting the antigen epitopes (n = 3 experimental replicates per group). The data represent mean ± SEM (c, d, g). Data were analyzed by one-way analysis of variance (ANOVA) with Tukey’s multiple comparisons post test. Source data are provided as a Source Data file.
Fig. 5
Fig. 5. Ultrasound responsive chemotherapeutics potently inhibited tumor growth in vivo and induced strong antitumor immunity.
a C57BL/6 mice were intravenously injected with indicated formulations and the blood samples were collected at indicated time points and imaged by the IVIS optical imaging system. Shown are fluorescent images of blood samples at indicated time points (n = 3 mice per group). b MC38 tumor-bearing mice were intravenously injected with indicated formulations and the animals were imaged by the IVIS optical imaging system at indicated time points (n = 3 mice per group). c C57BL/6 mice were subcutaneously injected with 500,000 MC38 cells on day 0. On days 10 and 13, tumor-bearing mice were i.v. injected of LID (DOX 0.5 mg/kg, ICG 4 mg/kg) or control formulations. On days 11 and 14, ultrasound (2 W/cm2, 50%, 1 MHz, 5 min) was performed for selected groups. d, e Individual and average tumor growth curves for MC38 tumor-bearing mice treated with indicated formulations (n = 5 mice per group). fh Antigen presentation and DC activation in MC38-OVA tumor-bearing mice two days after ultrasound treatment (n = 3 mice per group). i Activation of STING pathway-related markers (phosphorylation of IRF3 and TBK1) in the tumor on day 18 following treatment with indicated groups (n = 4 mice for LID + US and n = 3 mice for all other groups). j, k Percent of CD8 + T cells among CD3 + T cells in the tumor microenvironment on day 18 post tumor inoculation in MC38 tumor-bearing mice (n = 4 mice for LID + US and n = 3 mice for all other groups). l Percent of SIINFEKL-specific CD8 + T cells among CD3 + T cells in the tumor on day 18 post tumor inoculation in MC38-OVA tumor-bearing mice (n = 3 mice per group). m STING KO C57BL/6 mice were subcutaneously injected with 500,000 MC38 cells on day 0 and treated as described in d. n C57BL/6 mice were subcutaneously injected with 500,000 STING KO MC38 cells on day 0 and treated as described in d. Shown are the average tumor growth curves for indicated groups (n = 3 mice per group). The data represent mean ± SEM (eh, kn). Data were analyzed by one-way ANOVA (fh, k, l) or two-way ANOVA (e, m, n) with Tukey’s multiple comparisons post test. N.S., non-statistically significant. Source data are provided as a Source Data file.
Fig. 6
Fig. 6. Ultrasound responsive chemotherapeutics sensitized checkpoint inhibitors on animals with MC38 bilateral tumors.
a C57BL/6 mice were subcutaneously injected with 500,000 MC38 cells on the right flank (primary tumor) and 250,000 MC38 cells on the left flank (distant tumor) on day 0. On days 10 and 13, tumor-bearing mice were i.v. injected with LID (DOX 0.5 mg/kg, ICG 4 mg/kg) or control formulations. On days 11 and 14, ultrasound (2 W/cm2, 50%, 1 MHz, 5 min) was applied to the primary tumor for indicated groups (the distant tumor was not exposed to ultrasound). On days 10, 13, and 16, the PD-L1 antibody (75 μg/dose) was i.p. injected for indicated groups. b, c The average and individual tumor growth curves for primary tumors (exposed to ultrasound) (n = 8 mice per group). d, e The average and individual tumor growth curves for distant tumors (not exposed to ultrasound) (n = 8 mice per group). CR = complete regression. f, g Percent of CD8 + T cells among CD3 + T cells in the primary tumor on day 18 post tumor inoculation. h, i Percent of CD8 + T cells among CD3 + T cells in the distant tumor on day 18 post tumor inoculation (n = 3). The data represent mean ± SEM (b, d, g, i). Data were analyzed by one-way ANOVA (g, i) or two-way ANOVA (b, d) with Tukey’s multiple comparisons post test. Source data are provided as a Source Data file.
Fig. 7
Fig. 7. Ultrasound responsive chemotherapeutics sensitized checkpoint inhibitors on animals with orthotopic 4T1 tumors.
a Balb/c mice were injected with 500,000 4T1-Luciferase cells in the right mammary fat pads (primary tumor) and 250,000 4T1-Luciferase cells on the left mammary fat pads (distant tumor) on day 0. On days 7, 10, and 13, tumor-bearing mice were i.v. injected with LID (DOX 0.5 mg/kg, ICG 4 mg/kg) or control formulations. On days 8, 11, and 14, ultrasound (2 W/cm2, 50%, 1 MHz, 5 min) was applied to primary tumors for selected groups (distant tumors were not exposed to ultrasound). On days 7, 10, and 13, the PD-L1 antibody (75 μg/dose) was i.p. injected for indicated groups. b, c The bioluminescence from primary tumors (b) and distant tumors (c) (n = 5 mice per group). d Survival of animals treated with indicated formulations. Data were analyzed by two-way ANOVA with Tukey’s multiple comparisons post test (b, c) or log rank (Mantel-Cox) test (d). The data represent mean ± SEM (b, c). Source data are provided as a Source Data file.
Fig. 8
Fig. 8. Ultrasound responsive chemotherapeutics for elicitation of potent antitumor T cell immunity.
(a) In the first phase, LID accumulates in the tumor tissue through the enhanced permeability and retention effect (EPR effect). Once the accumulation of LID in the tumor reaches plateau, ultrasound (US) was applied to the tumor region to activate LID to generate ROS, which can significantly enhance DOX delivery to nuclei at the subcellular level and can functionally synergize with DOX to kill tumor cells. Moreover, ROS can also oxidize tumor DNA (especially mitochondrial DNA) to make it more resistant to nuclease. (b) In the second phase, efficient tumor killing induced by LID + US facilitates the transport of tumor antigens and oxidized tumor mitochondrial DNA to tumor infiltrating antigen-presenting cells such as dendritic cells, resulting in enhanced tumor antigen presentation and STING activation, and ultimately activation of potent antitumor T cell immunity that can eliminate remaining tumor cells (not killed during the first phase) and prevent metastasis and relapse.

References

    1. Kroemer G, Galluzzi L, Kepp O, Zitvogel L. Immunogenic cell death in cancer therapy. Annu. Rev. Immunol. 2013;31:51–72. doi: 10.1146/annurev-immunol-032712-100008. - DOI - PubMed
    1. Obeid M, et al. Calreticulin exposure dictates the immunogenicity of cancer cell death. Nat. Med. 2007;13:54–61. doi: 10.1038/nm1523. - DOI - PubMed
    1. Green DR, Ferguson T, Zitvogel L, Kroemer G. Immunogenic and tolerogenic cell death. Nat. Rev. Immunol. 2009;9:353–363. doi: 10.1038/nri2545. - DOI - PMC - PubMed
    1. Yum S, Li M, Chen ZJ. Old dogs, new trick: classic cancer therapies activate cGAS. Cell Res. 2020;30:639–648. doi: 10.1038/s41422-020-0346-1. - DOI - PMC - PubMed
    1. Krysko DV, et al. Immunogenic cell death and DAMPs in cancer therapy. Nat. Rev. Cancer. 2012;12:860–875. doi: 10.1038/nrc3380. - DOI - PubMed

Publication types