. 2023 Jun 30;14(1):3866.
doi: 10.1038/s41467-023-39627-7.

Single-cell profiling of lncRNA expression during Ebola virus infection in rhesus macaques

Affiliations

Single-cell profiling of lncRNA expression during Ebola virus infection in rhesus macaques

Luisa Santus et al. Nat Commun. .

Abstract

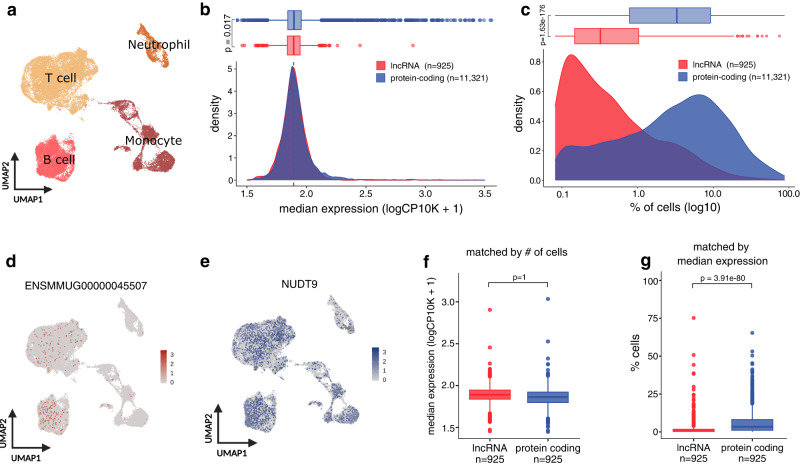
Long non-coding RNAs (lncRNAs) are involved in numerous biological processes and are pivotal mediators of the immune response, yet little is known about their properties at the single-cell level. Here, we generate a multi-tissue bulk RNAseq dataset from Ebola virus (EBOV) infected and not-infected rhesus macaques and identified 3979 novel lncRNAs. To profile lncRNA expression dynamics in immune circulating single-cells during EBOV infection, we design a metric, Upsilon, to estimate cell-type specificity. Our analysis reveals that lncRNAs are expressed in fewer cells than protein-coding genes, but they are not expressed at lower levels nor are they more cell-type specific when expressed in the same number of cells. In addition, we observe that lncRNAs exhibit similar changes in expression patterns to those of protein-coding genes during EBOV infection, and are often co-expressed with known immune regulators. A few lncRNAs change expression specifically upon EBOV entry in the cell. This study sheds light on the differential features of lncRNAs and protein-coding genes and paves the way for future single-cell lncRNA studies.


Conflict of interest statement

SAB Biotherapeutics, Inc. provided the study materials from the study by Luke et al. None of the authors of this study has financial interest in SAB Biotherapeutics, Inc. company. P.C.S. is a co-founder of, shareholder in, and advisor to Sherlock Biosciences, Inc.; a board member of and shareholder in the Danaher Corporation; and a co-founder of and shareholder in Delve Bio. The other authors declare no competing interests.

Figures

Fig. 1
Fig. 1. Novel lncRNAs resemble annotated lncRNAs and significantly expand the current macaque lncRNA annotation.
a Samples used for de novo transcriptome assembly. CSF: cerebrospinal fluid. b LncRNA discovery pipeline. N corresponds to the number of transcripts. c Number of novel and annotated lncRNAs and protein-coding genes in the macaque and human annotation (Ensembl release 100). d Distribution of transcript length and e exon length. f Distribution of Tau specificity scores of macaque novel and annotated lncRNA (red) and protein-coding genes (blue). Mann–Whitney U test. g Percentage of ubiquitous (Tau < 0.3), intermediate (0.3 ≤ Tau ≤ 0.7), and tissue-specific (Tau > 0.7) lncRNAs and protein-coding genes. Labels indicate the number of genes within each category. h Distribution of average expression (log10TPM) in the tissue with the highest expression of tissue-specific, intermediate, and ubiquitous lncRNAs and protein-coding genes. Mann–Whitney U test. N corresponds to the sample size of each category. All boxplots display the median and the first and third quartiles of the data. The whiskers extend to the highest and lowest values within 1.5 times the interquartile range (IQR) of the data.
Fig. 2
Fig. 2. Expression patterns of lncRNAs and protein-coding genes at single-cell resolution.
a UMAP embedding of 38,067 cells. Cell types are indicated by the different colors. b Distribution of median gene expression levels (log(CP10K + 1)) and c percentage of cells (log10) in which lncRNA (red) and protein-coding (blue) genes are expressed. Mann–Whitney U test. d UMAP embedding showing the expression levels of a lncRNA (ENSMMUG00000045507) and e a protein-coding gene (NUDT9), with the same median expression level but expressed in a different number of cells. f Distribution of median expression levels of lncRNA (red) and protein-coding genes (blue) when matched by the percentage of cells in which they were expressed. g Percentage of cells in which lncRNA (red) and protein-coding (blue) genes were expressed when matched by median expression levels. One-side Wilcoxon signed-rank test. All boxplots display the median and the first and third quartiles (the 25th and 75th percentiles) of the data. The whiskers extend to the highest and lowest values within 1.5 times the interquartile range (IQR) of the data.
Fig. 3
Fig. 3. Identification of cell-type specific lncRNAs.
a Distribution of Tau (green) and Upsilon (yellow) cell-type specificity scores for housekeeping (left) and maker (right) genes. Wilcoxon signed-rank test. b Bar plot showing the number of ubiquitous (Upsilon < 0.3), intermediate (0.3 ≤ Upsilon ≤ 0.7), and cell-type specific lncRNAs (Upsilon > 0.7). c Distribution of tissue-specificity Tau scores of ubiquitous, intermediate, and specific lncRNAs. d Distribution of cell-type specificity scores of lncRNA (red) and protein-coding (blue) genes. Cell-type marker genes are highlighted in green, housekeeping genes in purple. UMAP embeddings of cell-type specific and ubiquitously expressed lncRNA (red) and protein-coding (blue) genes are shown as examples. Mann–Whitney U test. e Distribution of Upsilon cell-type specificity scores of lncRNA and protein-coding genes when matched by the percentage of cells in which they were expressed. Wilcoxon signed-rank test. f UMAP embedding shows the expression pattern of the cell-type-specific lncRNA MSTRG.205441 (Upsilon = 0.9) (top) and the protein-coding gene RORA (Upsilon = 0.89) (bottom) which were matched by the percentage of cells in which they are expressed. All boxplots display the median and the first and third quartiles (the 25th and 75th percentiles) of the data. The whiskers extend to the highest and lowest values within 1.5 times the interquartile range (IQR) of the data.
Fig. 4
Fig. 4. LncRNA expression changes upon EBOV infection are cell-type specific.
a Schematic overview of the in vivo experiment design. b UMAP embedding of 38,067 cells from the in vivo dataset, colored by day post-infection (DPI). c Heatmaps display lncRNAs DE in monocytes, T cells, and B cells in at least one infection stage—early (E), middle (M), or late (L)—as compared to baseline (b). Cells are colored according to the fold changes (log2) in expression values between baseline and the corresponding infection stage. Only lncRNAs with a human ortholog have the name displayed. The numbers of DE lncRNAs in each cell type are depicted at the bottom of the heatmap. d Number of DE lncRNAs (left) and protein-coding genes (right) ubiquitously expressed (Upsilon <0.3), with intermediate cell-type specificity score (0.3 ≤ Upsilon ≤ 0.7) or cell-type specific (Upsilon > 0.7) in B cells, Monocytes and T cells. e NEAT1 expression pattern at different stages of infection in monocytes. N corresponds to the number of cells in each reported infection stage. Dots’ sizes represent the percentage of cells in which the gene was expressed. Dots’ centers represent the mean. Error bars indicate the 95% confidence interval around the mean, calculated using the standard error of the mean (SEM). f Upset plots showing the overlap of DE lncRNAs across cell types (g) and infection stages.
Fig. 5
Fig. 5. In silico functional characterization of lncRNAs and protein-coding genes upon EBOV infection in monocytes.
a Regulatory network of lncRNAs (circles) and protein-coding (squares) DE. Vertices’ colors represent up- or downregulated genes (left) or whether a gene has the strongest fold-change compared to baseline in early (yellow), middle (orange), or late (red) stages of infection (right). Modules with significant enrichments are circled in gray and their description summarizes top enriched terms. b UMAP embedding of 56,317 cells from the ex vivo dataset. The magnified UMAP shows the viral load in monocytes. c Number of lncRNAs correlated with viral load in monocytes. d Expression of the lncRNA ENSMMUG00000064224 in monocytes in baseline, bystander, and infected cells (24 h). Dots’ centers represent the mean. Error bars indicate the 95% confidence interval around the mean, calculated using the standard error of the mean. Dots’sizes represent the percentage of cells expressing the gene. N corresponds to the number of cells in each infection stage. e Expression of ENSMMUG00000064224 and ISGs versus viral load. The shaded area around the smoothed line represents the 95% confidence interval (loess smoothing method). f, g Same as (d, e) for the lncRNA MSTRG.181870.

References

    1. Delás MJ, Hannon GJ. lncRNAs in development and disease: from functions to mechanisms. Open Biol. 2017;7:170121. doi: 10.1098/rsob.170121. - DOI - PMC - PubMed
    1. Necsulea A, et al. The evolution of lncRNA repertoires and expression patterns in tetrapods. Nature. 2014;505:635–640. doi: 10.1038/nature12943. - DOI - PubMed
    1. de Goede OM, et al. Population-scale tissue transcriptomics maps long non-coding RNAs to complex disease. Cell. 2021;184:2633–2648.e19. doi: 10.1016/j.cell.2021.03.050. - DOI - PMC - PubMed
    1. Nicholas W, Mathy X-MC. Long non-coding RNAs (lncRNAs) and their transcriptional control of inflammatory responses. J. Biol. Chem. 2017;292:12375–12382. doi: 10.1074/jbc.R116.760884. - DOI - PMC - PubMed
    1. Wang KC, Chang HY. Molecular mechanisms of long noncoding RNAs. Mol. Cell. 2011;43:904–914. doi: 10.1016/j.molcel.2011.08.018. - DOI - PMC - PubMed

Publication types

Substances