. 2023 Jun 30;80(7):193.
doi: 10.1007/s00018-023-04841-5.

Differential intracellular trafficking of extracellular vesicles in microglia and astrocytes

Affiliations

Differential intracellular trafficking of extracellular vesicles in microglia and astrocytes

Marina Pantazopoulou et al. Cell Mol Life Sci. .

Abstract

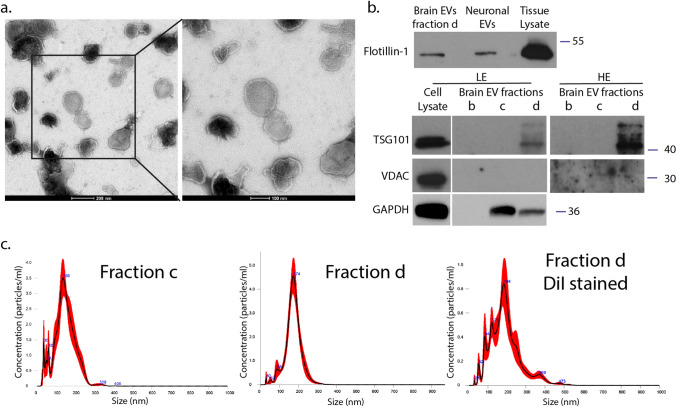
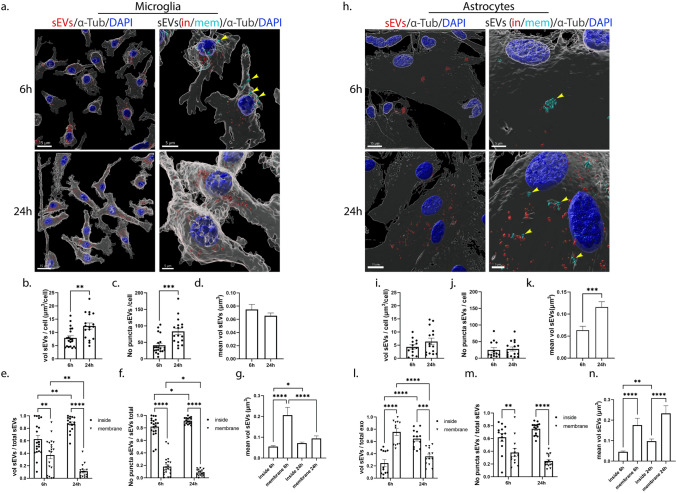
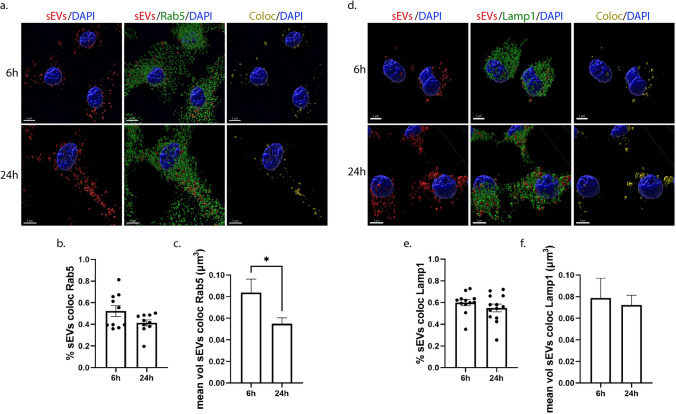
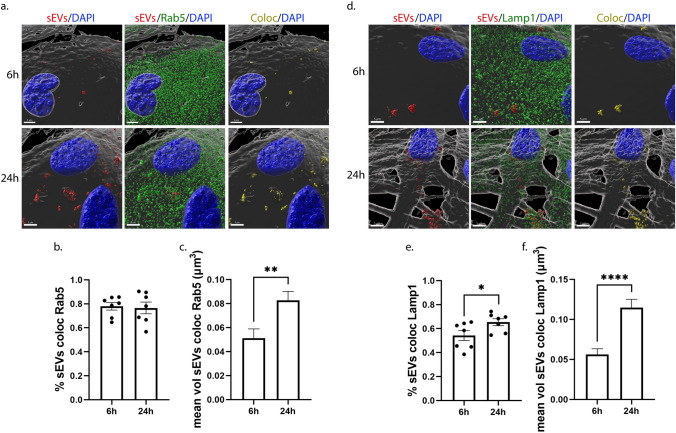
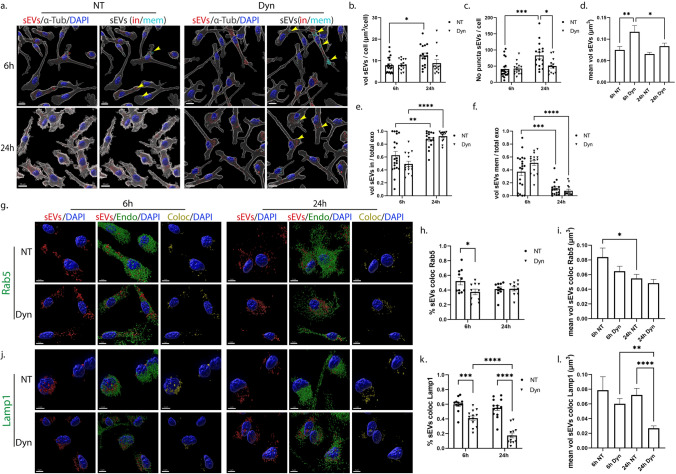
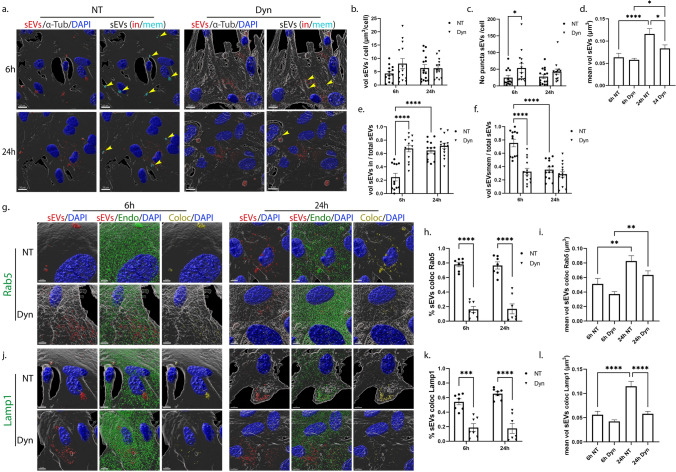
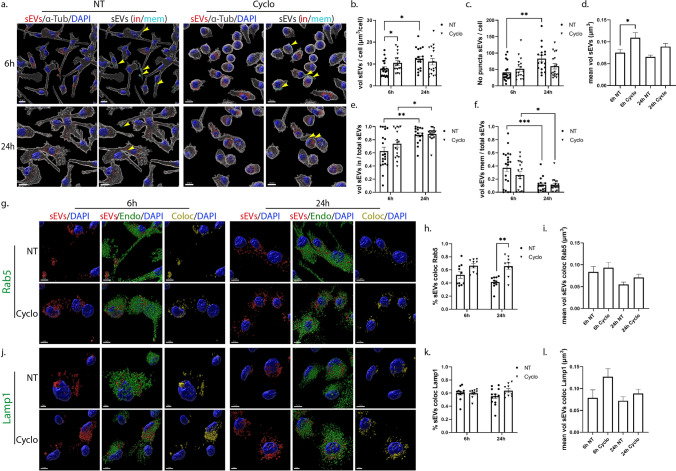
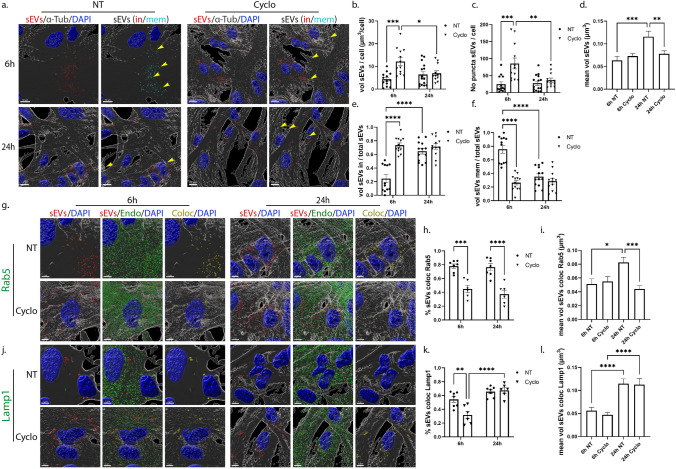
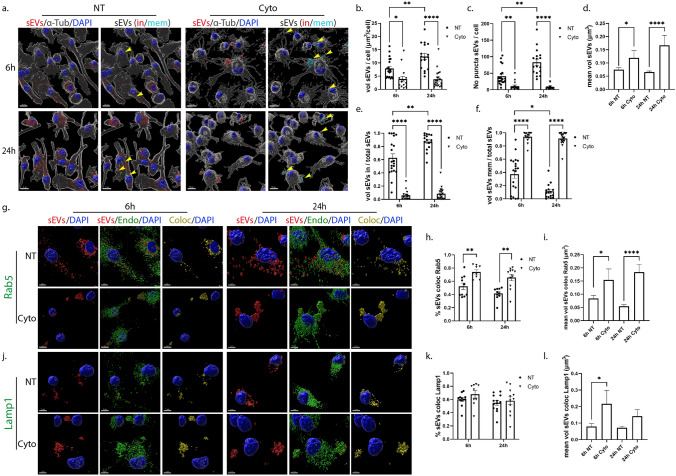
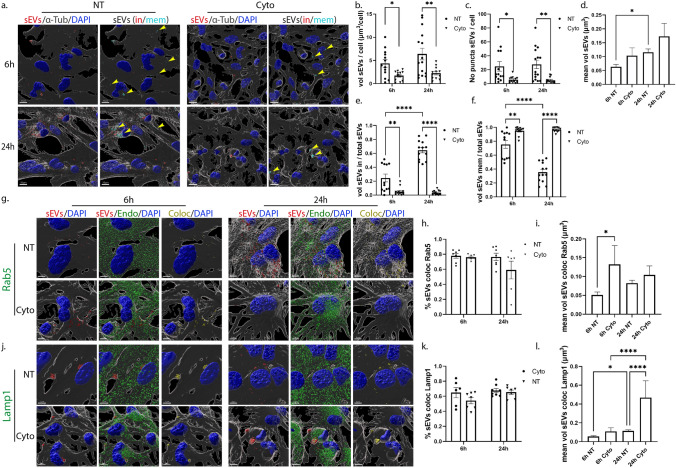
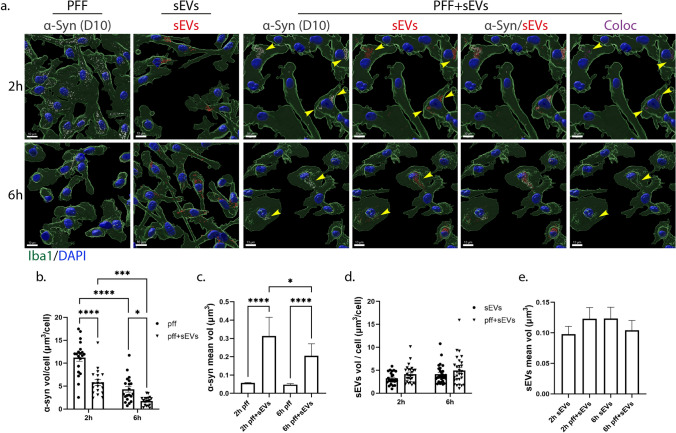
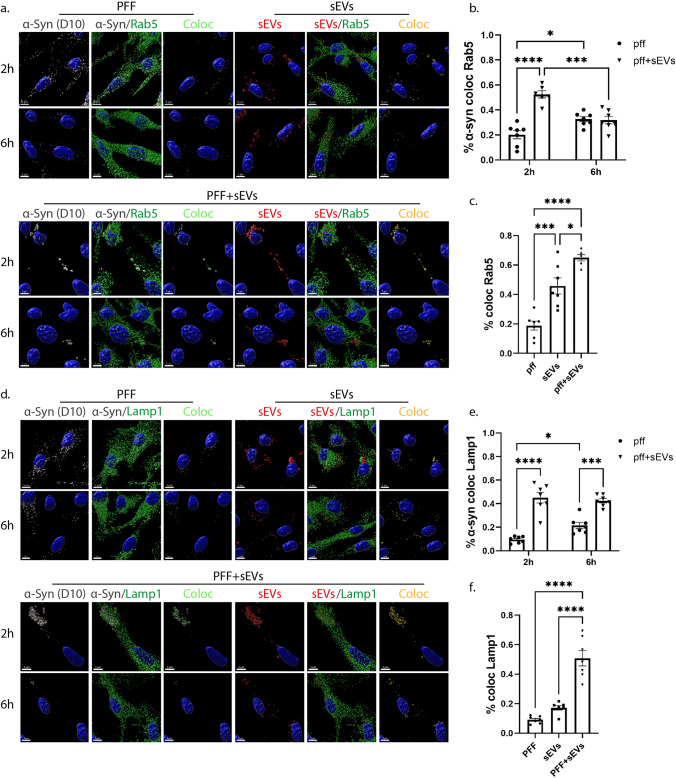
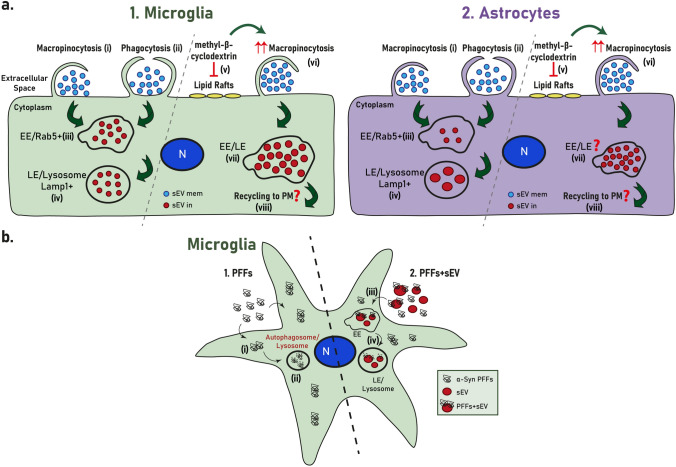
Extracellular vesicles (EVs) have emerged as key players in cell-to-cell communication in both physiological and pathological processes in the Central Nervous System. Thus far, the intracellular pathways involved in uptake and trafficking of EVs within different cell types of the brain are poorly understood. In our study, the endocytic processes and subcellular sorting of EVs were investigated in primary glial cells, particularly linked with the EV-associated α-synuclein (α-syn) transmission. Mouse microglia and astrocytic primary cultures were incubated with DiI-stained mouse brain-derived EVs. The internalization and trafficking pathways were analyzed in cells treated with pharmacological reagents that block the major endocytic pathways. Brain-derived EVs were internalized by both glial cell types; however, uptake was more efficient in microglia than in astrocytes. Colocalization of EVs with early and late endocytic markers (Rab5, Lamp1) indicated that EVs are sorted to endo-lysosomes for subsequent processing. Blocking actin-dependent phagocytosis and/or macropinocytosis with Cytochalasin D or EIPA inhibited EV entry into glial cells, whereas treatment with inhibitors that strip cholesterol off the plasma membrane, induced uptake, however differentially altered endosomal sorting. EV-associated fibrillar α-Syn was efficiently internalized and detected in Rab5- and Lamp1-positive compartments within microglia. Our study strongly suggests that EVs enter glial cells through phagocytosis and/or macropinocytosis and are sorted to endo-lysosomes for subsequent processing. Further, brain-derived EVs serve as scavengers and mediate cell-to-glia transfer of pathological α-Syn which is also targeted to the endolysosomal pathway, suggesting a beneficial role in microglia-mediated clearance of toxic protein aggregates, present in numerous neurodegenerative diseases.

Keywords: Alpha-synuclein; Astrocytes; Endocytosis; Endolysosomal pathway; Lysosome; Microglia; Small extracellular vesicles (sEVs).


Conflict of interest statement

The authors declare that they have no competing interests.

Figures

Fig. 1
Fig. 1
Characterization of mouse brain-derived EVs. α. Negatively stained TEM of EVs from fraction d. Scale bar 200 nm (left panel) and 100 nm (right panel). b. Western blotting of brain-derived EVs isolated from fraction d (lane 1), EVs derived from primary neuronal culture (lane 2), and brain tissue lysate (lane 3) (upper panel). 15 μg total protein loaded. Western blotting of different fractions (b, c, d) against TSG101, VDAC, and GAPDH. Cell lysate from HEK-293 cells was used as a positive control (LE: low exposure; HE: high exposure). 30 μg total protein loaded. f. Representative NTA distribution profile of EVs (fraction c and d, as well as DiI-stained fraction d), including size distribution plots and mean size of each peak
Fig. 2
Fig. 2
Brain-derived sEVs are internalized in primary microglia and astrocytes. Primary cells were incubated with Dil-stained brain-derived sEVs (depicted in red) for 6 h and 24 h. Cells were washed, and internalization of sEVs was monitored 6 h and 24 h post-incubation. Cells were fixed and immunostained with an antibody against α-Tubulin (α-Tub) (gray), while cell nuclei were stained with DAPI (blue). Confocal images were deconvolved and analyzed with the Imaris Imaging software. sEVs were defined as cytoplasmic (sEVs in, red) or membranous (sEVs mem, cyan blue) using the ‘’Distance transformation’’ module of the Imaris Imaging software, computing the distance of the sEV puncta from the ‘’α-Tubulin’’ surface. Representative Imaris images depict the internalization of sEVs masked with the α-Tubulin surface (left panel, scale bar 15 μm) and in/mem sEVs (right panel, scale bar 5 μm) in microglia (a) and astrocytes (h), 6 h and 24 h post-addition. ‘’sEVs mem’’ were depicted with arrowheads. Graphs show the total volume of internalized sEVs per cell (b, i), the number of puncta per cell (c, j), the mean volume of sEVs (d, k), the ratio of the volume of sEVs (in/mem) per total volume (e, l), the ratio of the number of puncta (in/mem) per total number (f, m), and the mean volume of sEVs (in/mem) (g, n), in microglia and astrocytes, respectively. Data are presented as the mean ± SEM of minimum three independent cell preparations, with at least two replicates per assay; Student's t test was used for (b), (d), (i), and (k), Mann–Whitney test for (c) and (j), one-way ANOVA with Tukey’s correction for (g) and (n), two-way ANOVA with Tukey’s correction for (e) and (m), and multiple t test for (f) and (m). Statistical significance was set as *p < 0.05, **p < 0.01, ***p < 0.001, ****p < 0.0001
Fig. 3
Fig. 3
sEVs when uptaken by primary microglia follow the endocytic pathway and are colocalized with Rab5 (early endosomes-EE) and Lamp1 (late endosomes-LE/Lysosomes). Microglia cells were incubated with Dil-labeled sEVs (red), for 6 h and 24 h. Colocalization of sEVs with Rab5 and Lamp1 was monitored at 6 h and 24 h post-treatment. Cells were fixed and immunolabeled for Rab5 or Lamp1 (green), α-Tubulin (α-Tub) (gray), and DAPI (blue), detecting cell nuclei. Representative Imaris images depict colocalization between internalized sEVs and the endocytic markers, Rab5 (ac) and Lamp1 (df), after 6 h and 24 h of incubation. The colocalization channel and surface (yellow) were built using the Imaris imaging software. Scale bar 5 μm. Graphs show colocalization between sEVs and Rab5/Lamp1 (Manders’ colocalization coefficient) after 6 h and 24 h (b and e) of treatment as well as the mean volume of puncta colocalized with Rab5 (c) and Lamp1 (f) at the different time points. Data are presented as the mean ± SEM of minimum three independent cell preparations, with more than 80 cells measured; Student's t test was used, and statistical significance was set as *p < 0.05, **p < 0.01, ***p < 0.001, ****p < 0.0001
Fig. 4
Fig. 4
sEVs are targeted to the endocytic pathway and are colocalized with Rab5 (EE) and Lamp1 (LE/Lysosomes) following addition on primary astrocytes. Cells were incubated with Dil-stained sEVs (red) for 6 h and 24 h, and colocalization of sEVs with Rab5 and Lamp1 was measured 6 h and 24 h post-treatment. Cells were fixed and immunostained for Rab5 and Lamp1 (green), α-Tubulin (α-Tub) (gray), and DAPI (blue). Representative Imaris images depict colocalization between internalized sEVs and the endocytic markers, Rab5 (ac) and Lamp1 (df), after 6 h and 24 h of treatment. The colocalization surface is depicted in yellow. Scale bar 5 μm. Graphs show the colocalization between sEVs and Rab5/Lamp1 (Manders’ colocalization coefficient) after 6 h and 24 h (b and e) of treatment as well as the mean volume of puncta colocalized with Rab5 (c) and Lamp1 (f). Data are presented as the mean ± SEM of minimum three independent cell preparations, with more than 60 cells measured; Student's t test was used, and statistical significance was set as *p < 0.05, **p < 0.01, ***p < 0.001, ****p < 0.0001
Fig. 5
Fig. 5
Uptake and endocytic trafficking of sEVs in primary microglia following inhibition of the dynamin-dependent endocytic pathway. Cells were incubated with Dil-labeled sEVs (red), in the absence (NT) or presence of Dynasore (Dyn) for 6 h and 24 h. Cells were fixed and immunostained against α-Tubulin (α-Tub) (gray) and DAPI (blue). Representative Imaris images depict the internalization of sEVs masked with the α-Tubulin surface and in/mem sEVs without (NT) or with Dynasore (Dyn) at 6 h and 24 h (a) of incubation with sEVs. Scale bar 10 μm. Graphs show the total volume of internalized sEVs per cell (b), the number of sEV puncta per cell (c), the mean volume of internalized sEVs (d), the percentage of sEV volume, inside (e) or on the membrane (f) per total volume of sEVs. The endocytic trafficking of sEVs was evaluated by measuring the colocalization of sEVs with Rab5 (gi) and Lamp1 (jl). ‘’sEVs mem’’ were depicted with arrowheads. Scale bar 5 μm. Graphs show colocalization between sEVs and Rab5 (h) or Lamp1 (k) and the mean volume of colocalized puncta (i and l, respectively) at different time points. Data are presented as the mean ± SEM of minimum three independent cell preparations, with at least two replicates per assay; one-way ANOVA with Tukey’s correction was used for (d), (i), and (l), two-way ANOVA with Tukey’s correction for (b), (e), (f), (h), and (k) and multiple t test for (c). Statistical significance was set as *p < 0.05, **p < 0.01, ***p < 0.001, ****p < 0.0001
Fig. 6
Fig. 6
Internalization and endocytic trafficking of sEVs in primary astrocytes following Dynasore treatment. Cells, incubated with Dil-labeled sEVs (red), in the absence (NT) or presence of Dynasore (Dyn) for 6 h and 24 h, were fixed and immunostained against α-Tubulin (α-Tub) (gray) and DAPI (blue). Representative Imaris images depict the internalization of sEVs masked with the α-Tub surface and in/mem sEVs in cells treated without or with Dyn at 6 h and 24 h (a). ‘’sEVs mem’’ were depicted with arrowheads. Scale bar 10 μm. Graphs show the total volume of internalized sEVs per cell (b), the number of sEV puncta per cell (c), the mean volume of internalized sEVs (d), the percentage of sEV volume, inside (e) or membrane (f) per total volume, after 6 h and 24 h of treatment. The endocytic trafficking of sEVs was monitored by measuring the colocalization of sEVs with Rab5 (gi) and Lamp1 (jl). Scale bar 5 μm. Graphs show the colocalization between sEVs and Rab5 (h) or Lamp1 (k) and the mean volume of colocalized puncta (i and l, respectively) at different time points. Data are presented as the mean ± SEM of minimum three independent cell preparations, with at least two replicates per assay; one-way ANOVA with Tukey’s correction was used for (d), (i), and (l), two-way ANOVA with Tukey’s correction for (b), (e), (f), (h), and (k) and multiple t test for (c). Statistical significance was set as *p < 0.05, **p < .01, ***p < 0.001, ****p < .0001
Fig. 7
Fig. 7
Uptake and endocytic trafficking of sEVs in primary microglia upon depletion of cholesterol with methyl-β-cyclodextrin. Cells, treated with Dil-labeled sEVs (red), in the absence (NT) or presence of methyl-β-cyclodextrin (Cyclo) for 6 h and 24 h, were fixed and immunostained against α-Tubulin (α-Tub) (gray) and DAPI (blue). Representative Imaris images depict the internalization of sEVs and in/mem sEVs without or with methyl-β-cyclodextrin at 6 h and 24 h (a) of incubation. ‘’sEVs mem’’ were depicted with arrowheads. Scale bar 10 μm. Graphs show the total volume of internalized sEVs per cell (b), the number of sEV puncta per cell (c), the mean volume of internalized sEVs (d), the percentage of sEV volume, inside (e) or membrane (f) per total volume, 6 h and 24 h post-incubation. Colocalization of sEVs with Rab5 (gi) and Lamp1 (jl) was measured. Scale bar 5 μm. Graphs show colocalization between sEVs and Rab5 (h) or Lamp1 (k) and the mean volume of colocalized puncta (i and l, respectively) at different time points, with or without methyl-β-cyclodextrin. Data are presented as the mean ± SEM of minimum three independent cell preparations, with at least two replicates per assay; one-way ANOVA with Tukey’s correction was used for (d), (i), and (l), two-way ANOVA with Tukey’s correction for (e), (f), (h), and (k) and multiple t test for (b) and (c). Statistical significance was set as *p < 0.05, **p < 0.01, ***p < 0.001, ****p < 0.0001
Fig. 8
Fig. 8
Internalization and endocytic trafficking of sEVs in primary astrocytes upon methyl-β-cyclodextrin treatment. Cells, treated with Dil-labeled sEVs (red), in the absence (NT) or presence of methyl-β-cyclodextrin (Cyclo) for 6 h and 24 h, were fixed and immunostained against α-Tubulin (α-Tub) (gray) and DAPI (blue). Representative Imaris images show the internalization of sEVs and in/mem sEVs without or with methyl-β-cyclodextrin 6 h and 24 h (a) post-treatment. ‘’sEVs mem’’ were depicted with arrowheads. Scale bar 10 μm. Graphs present the total volume of internalized sEVs per cell (b), the number of sEV puncta per cell (c), the mean volume of internalized sEVs (d), the percentage of sEV volume, inside (e) or membrane (f) per total volume, 6 h and 24 h post-incubation. Colocalization of sEVs with Rab5 (gi) and Lamp1 (jl) was monitored. Scale bar 5 μm. Graphs show colocalization between sEVs and Rab5 (h) or Lamp1 (k) and the mean volume of colocalized puncta (i and l) at different time points, with or without methyl-β-cyclodextrin. Data are presented as the mean ± SEM of minimum three independent cell preparations, with at least two replicates per assay; one-way ANOVA with Tukey’s correction was used for (d), (i) and (l), two-way ANOVA with Tukey’s correction for (b), (e), (f), (h), and (k) and multiple t test for (c). Statistical significance was set as *p < 0.05, **p < 0.01, ***p < 0.001, ****p < 0.0001
Fig. 9
Fig. 9
Internalization of sEVs in primary microglia following inhibition of the actin-dependent endocytic pathway. Cells were incubated with Dil-labeled sEVs (red), in the absence or presence of Cytochalasin D (Cyto) for 6 h and 24 h. Cells were fixed and immunostained against α-Tubulin (α-Tub) (gray) and nuclei were stained with DAPI (blue). Representative Imaris images show the internalization of sEVs and in/mem sEVs without or with Cyto, 6 h and 24 h (a) post-treatment. ‘’sEVs mem’’ were depicted with arrowheads. Scale bar 10 μm. Graphs present the total volume of internalized sEVs per cell (b), the number of sEV puncta per cell (c), the mean volume of internalized sEVs (d), the percentage of sEV volume, inside (e) or membrane (f), per total volume, 6 h and 24 h post-incubation. Colocalization of sEVs with Rab5 (gi) and Lamp1 (jl) was monitored. Scale bar 5 μm. Graphs show colocalization between sEVs and Rab5 (h) or Lamp1 (k) and the mean volume of colocalized puncta (i and l, respectively) at different time points, with or without Cyto. Data are presented as the mean ± SEM of minimum three independent cell preparations, with at least two replicates per assay; one-way ANOVA with Tukey’s correction was used for (d), (i), and (l), two-way ANOVA with Tukey’s correction for (h) and (k) and multiple t test for (b), (c), (e), and (f). Statistical significance was set as *p < 0.05, **p < 0.01, ***p < 0.001, ****p < 0.0001
Fig. 10
Fig. 10
Uptake of sEVs in primary astrocytes through the actin-dependent endocytic pathway. Cells, incubated with Dil-labeled sEVs (red), in the absence or presence of Cytochalasin D (Cyto) for 6 h and 24 h, were fixed and immunolabeled against α-Tubulin (α-Tub) (gray) and nuclei were stained with DAPI (blue). Representative Imaris images show the internalization of sEVs and in/mem sEVs without or with Cyto, 6 h and 24 h (a) post-treatment. ‘’sEVs mem’’ was depicted with arrowheads. Scale bar 10 μm. Graphs present the total volume of internalized sEVs per cell (b), the number of sEV puncta per cell (c), the mean volume of internalized sEVs (d), the percentage of sEV volume, inside (e) or membrane (f) per total volume, 6 h and 24 h post-incubation. Colocalization of sEVs with Rab5 (gi) and Lamp1 (jl) was evaluated. Scale bar 5 μm. Graphs show colocalization between sEVs and Rab5 (h) or Lamp1 (k) and the mean volume of colocalized puncta (i and l, respectively) at different time points, with or without Cyto. Data are presented as the mean ± SEM of minimum three independent cell preparations, with at least two replicates per assay; one-way ANOVA with Tukey’s correction was used for (d), (i) and (l), two-way ANOVA with Tukey’s correction for (e), (f), (h), and (k) and multiple t test for (b) and (c). Statistical significance was set as *p < 0.05, **p < 0.01, ***p < .001, ****p < 0.0001
Fig. 11
Fig. 11
sEV-dependent α-Syn transmission in primary microglia. a. α-Syn pre-formed fibrils (PFF) were pre-incubated with sEVs derived from SNCA KO mouse brains (PFF + sEVs), for 20 h at 37 oC. Microglia cells were treated with PFFs or sEVs alone or PFF + sEVs for 2 h. Uptake of α-Syn and sEVs were monitored 2 h and 6 h post-addition. Cells were fixed and immunostained against α-Syn (D10, light gray) and Iba1 (green). Cell nuclei were stained with DAPI (blue). Representative Imaris images show the uptake of α-Syn and sEVs in all three conditions (PFFs, sEVs, and PFF + sEVs) 2 h and 6 h post-treatment. Arrowheads depict PFF colocalization with sEVs. Colocalization of α-Syn with sEVs is depicted in magenta. Scale bar 10 μm. Graphs present the total volume of α-Syn per cell (b), the mean volume of α-Syn individual puncta (c), the total volume of sEVs per cell (d), and the mean volume of sEV puncta (e) under the different conditions. Data are presented as the mean ± SEM of minimum three independent cell preparations, with at least two replicates per assay; one-way ANOVA with Tukey’s correction was used for (c) and (e), two-way ANOVA with Tukey’s correction for (d), and multiple t test for (b). Statistical significance was set as *p < 0.05, **p < 0.01, ***p < 0.001, ****p < 0.0001
Fig. 12
Fig. 12
sEV-dependent α-Syn intracellular trafficking in primary microglia. α-Syn pre-formed fibrils (PFF) were pre-incubated with sEVs derived from SNCA KO mouse brains (PFF + sEVs), for 20 h at 37 oC. Microglia cells were treated with PFFs or sEVs alone or PFF + sEVs for 2 h. Intracellular trafficking of α-Syn and sEVs were monitored 2 h and 6 h post-addition. The endocytic trafficking was monitored by measuring colocalization of α-Syn (depicted in light green) and sEVs (depicted in yellow) with Rab5 (ac) and Lamp1 (df), at the different treatments (PFFs, sEVs and PFF + sEVs). Scale bar 5 μm. Graphs show colocalization of α-Syn with Rab5 (b) and Lamp1 (e) in the different conditions (PFFs, sEVs, PFF + sEVs), as well as colocalization of α-Syn/sEV colocalized puncta with Rab5 (c) and Lamp1(f), in the PFF + sEVs compared to the PFF or sEVs alone treatments, 2 h post-incubation. Data are presented as the mean ± SEM of minimum three independent cell preparations, with at least two replicates per assay; one-way ANOVA with Tukey’s correction was used for (c) and (f), and two-way ANOVA with Tukey’s correction for (b) and (e). Statistical significance was set as *p < 0.05, **p < 0.01, ***p < 0.001, ****p < .0001
Fig. 13
Fig. 13
a Internalization processes and endocytic trafficking of brain-derived sEVs in microglia (1) and astrocytes (2). Brain-derived sEVs are taken up by both glial cell types; however, microglia demonstrate a more efficient internalization rate compared to astrocytes. Both cell types utilize the actin-dependent pathways, macropinocytosis (i) and/or phagocytosis (ii), for the transfer of sEVs within the cells and subsequently target them to the endolysosomal pathway (iii, iv) for further processing. Cholesterol depletion (v) induces sEV internalization in both microglia and astrocytes, possibly through induction of macropinocytosis (vi), exhibiting though a differential impact on sEV endosomal trafficking between the two cell types (vii). Cholesterol’s contribution to the interplay between endosomal recycling to the plasma membrane and/or lysosomal sorting requires further investigation (viii). b. sEV-dependent α-Syn transmission in microglia. Fibrillar α-Syn-associated sEVs (PFFs + sEVs) (2) are internalized (iii), enter the endosomal pathway (EE and LE), and are targeted to the lysosome (iv) for subsequent degradation. In the absence of sEVs (1), α-Syn-PFFs fail to enter the endosomal pathway, accumulate in the cytoplasm (i), and are cleared from the cells, possibly through autophagy (ii) [79]

References

    1. Lizarraga-Valderrama LR, Sheridan GK. Extracellular vesicles and intercellular communication in the central nervous system. FEBS Lett. 2021;595:1391–1410. doi: 10.1002/1873-3468.14074. - DOI - PubMed
    1. EL Andaloussi S, Mäger I, Breakefield XO, et al. Extracellular vesicles: biology and emerging therapeutic opportunities. Nat Rev Drug Discov 2013; 12: 347–357. doi:10.1038/nrd3978 - PubMed
    1. Théry C, Witwer KW, Aikawa E, et al. Minimal information for studies of extracellular vesicles 2018 (MISEV2018): a position statement of the International Society for Extracellular Vesicles and update of the MISEV2014 guidelines. J Extracell Vesicles. 2018;7:1535750. doi: 10.1080/20013078.2018.1535750. - DOI - PMC - PubMed
    1. Skotland T, Hessvik NP, Sandvig K, et al. Exosomal lipid composition and the role of ether lipids and phosphoinositides in exosome biology. J Lipid Res. 2019;60:9–18. doi: 10.1194/jlr.R084343. - DOI - PMC - PubMed
    1. Andreu Z, Yáñez-Mó M. Tetraspanins in Extracellular Vesicle Formation and Function. Frontiers in Immunology 2014; 5 - PMC - PubMed