. 2023 Oct;17(10):1578-1588.
doi: 10.1038/s41396-023-01464-3. Epub 2023 Jun 30.

Prey preference in a kleptoplastic dinoflagellate is linked to photosynthetic performance

Affiliations

Prey preference in a kleptoplastic dinoflagellate is linked to photosynthetic performance

Norico Yamada et al. ISME J. 2023 Oct.

Abstract

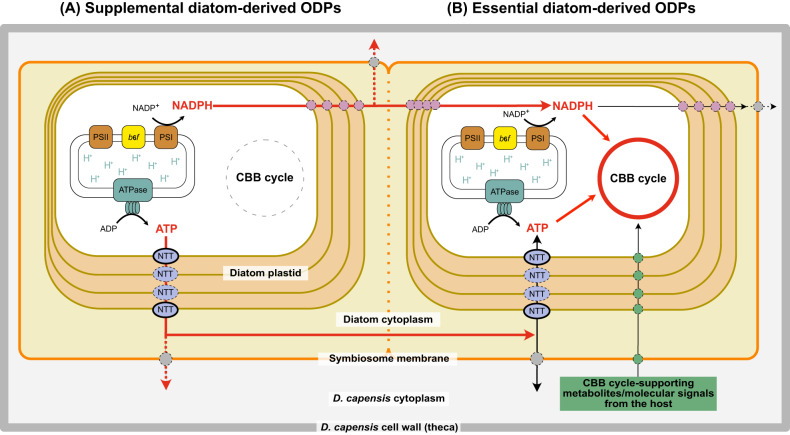
Dinoflagellates of the family Kryptoperidiniaceae, known as "dinotoms", possess diatom-derived endosymbionts and contain individuals at three successive evolutionary stages: a transiently maintained kleptoplastic stage; a stage containing multiple permanently maintained diatom endosymbionts; and a further permanent stage containing a single diatom endosymbiont. Kleptoplastic dinotoms were discovered only recently, in Durinskia capensis; until now it has not been investigated kleptoplastic behavior and the metabolic and genetic integration of host and prey. Here, we show D. capensis is able to use various diatom species as kleptoplastids and exhibits different photosynthetic capacities depending on the diatom species. This is in contrast with the prey diatoms in their free-living stage, as there are no differences in their photosynthetic capacities. Complete photosynthesis including both the light reactions and the Calvin cycle remain active only when D. capensis feeds on its habitual associate, the "essential" diatom Nitzschia captiva. The organelles of another edible diatom, N. inconspicua, are preserved intact after ingestion by D. capensis and expresses the psbC gene of the photosynthetic light reaction, while RuBisCO gene expression is lost. Our results indicate that edible but non-essential, "supplemental" diatoms are used by D. capensis for producing ATP and NADPH, but not for carbon fixation. D. capensis has established a species-specifically designed metabolic system allowing carbon fixation to be performed only by its essential diatoms. The ability of D. capensis to ingest supplemental diatoms as kleptoplastids may be a flexible ecological strategy, to use these diatoms as "emergency supplies" while no essential diatoms are available.


Conflict of interest statement

The authors declare no competing financial interests.

Figures

Fig. 1
Fig. 1. Feeding experiment of D. capensis with thirteen diatom species.
A D. capensis co-cultured with thirteen species of diatoms respectively. The essential diatom N. captiva was the most influential diatom for D. capensis growth; however, the other ten diatoms were also able to increase D. capensis numbers, with the exception of two diatoms in Group 3. B Detail of (A) showing growth of D. capensis co-cultured with non-essential diatoms. Except for two diatom species in Group 3, N. cf. pusilla and Simonsenia medliniae, all diatoms used in this study positively influenced D. capensis growth. C D. capensis co-cultured with N. captiva, N. inconspicua (strain IRTA-CC-1) or Psammodictyon sp. (strain NY099), respectively, or co-cultured with these three diatoms together. Co-culturing with three species had the biggest impact on the D. capensis growth. Orange line with black circle = D. capensis co-cultured with N. captiva, Purple line with cross = D. capensis mono-cultured in the absence of any free-living diatoms, Black line = D. capensis co-cultured with diatoms of Group 1, Broken line = D. capensis co-cultured diatoms of Group 2, Dotted line = D. capensis co-cultured with diatoms of Group 3, Black line with white circle = D. capensis co-cultured with N. inconspicua (IRTA-CC-1), Black line with white double circle = D. capensis co-cultured with Psammodictyon sp. (NY099), Red line with square = D. capensis co-cultured with N. captiva, N. inconspicua (IRTA-CC−1), and Psammodictyon sp. (NY099) together.
Fig. 2
Fig. 2. Chl a concentration (pg cell−1) in the different cultures.
Free-living N. captiva (sample a; black bar); free-living N. inconspicua (sample b, gray bar); D. capensis co-cultured with N. captiva (sample c, orange bar); and D. capensis co-cultured with N. captiva and N. inconspicua (sample d, red bar).
Fig. 3
Fig. 3. Relative photosynthetic electron transport rates (rETRs) of the free-living and ingested diatoms.
A rETR values of free-living N. captiva (sample a) and free-living N. inconspicua (sample b). B rETR values of free-living N. captiva (sample a), of D. capensis co-cultured with N. captiva (sample c), and of D. capensis co-cultured with N. captiva and N. inconspicua together (sample d). C Qphar-normalized rETR values of free-living N. captiva before ingestion (sample a), of D. capensis co-cultured with N. captiva (sample c) and of D. capensis co-cultured with N. captiva and N. inconspicua (sample d). Black line with black circle = sample a, Black line with white circle = sample b, Orange line with black circle = sample c, Red line with square = sample d.
Fig. 4
Fig. 4. Relative gene expression, rbcL protein expression and organelle retention of diatoms before and after ingestion.
A Free-living N. inconspicua expressing GFP. The GFP was observed in the cytoplasm (A1), but not in the plastids (A2). Green = GFP fluorescence. Red = Chl a autofluorescence. B Free-living N. inconspicua expressing GFP in the nucleus (arrows) and the cytoplasm. C D. capensis maintained the GFP-expressing cytoplasm of N. inconspicua. The cytoplasm was located next to the plastids. C1 = A merged photo of GFP fluorescence and Chl a autofluorescence. C2 = A merged photo of GFP fluorescence, Chl a autofluorescence and bright filed. D D. capensis maintained the GFP-expressing two nuclei (arrow) of N. inconspicua. The nuclei were also located near to the plastids. D1 = A merged photo of GFP fluorescence and Chl a autofluorescence. D2 = A merged photo of GFP fluorescence, Chl a autofluorescence and bright filed. E Two D. capensis cells maintained either of the GFP-expressing N. captiva plastids or the wild-type N. inconspicua plastids. Plastids derived from N. captiva and N. inconspicua were impossible to distinguish by their shapes or by their Chl a autofluorescence (E1), but became distinguishable by the GFP fluorescence of N. captiva plastids (E2 and E3). E1 = Chl a autofluorescence photo. E2 = GFP fluorescence photo. E3 = A merged photo of Chl a autofluorescence, GFP fluorescence and bright filed. FH N. inconspicua-derived ODPs inside a D. capensis cell. F The symbiosome membrane (SYM), which separates diatom cytoplasm (DiaC) and dinoflagellate cytoplasm (DinoC) was visible surrounding the diatom plastids (PI). cERM = the outermost membrane of diatom plastids. G and H Diatom plastidial membranes were preserved intact inside of the SYM, comprising the innermost membrane (iEM), the second innermost membrane (oEM), the second outermost membrane (PPM), and the cERM. Arrow = SYM, DiaM = Diatom mitochondria, DinoM = Dinoflagellate mitochondria. I Relative expression levels of plastid-encoded psbC and rbcL of N. captiva and N. inconspicua before (sample a and b) and after ingestion under the starving condition of D. capensis (sample d). All gene expressions were normalized with the psbC gene of N. captiva. Both genes were expressed stably in N. captiva before and after ingestion. In N. inconspicua; however, only the psbC gene expressed after ingestion, although both psbC and rbcL genes expressed when N. inconspicua was free-living. The psbC of N. inconspicua became undetectable from Day 7 after the starvation (S-Day 7). Orange line with black circle = psbC gene of N. captiva, Yellow line with triangle = rbcL gene of N. captiva, Red line with white circle = psbC gene of N. inconspicua, Blue square = rbcL gene of N. inconspicua, Broken line = 18 S gene of D. capensis. J RbcL protein expression levels of N. captiva before (sample a) and after ingestion (sample c). N. captiva produced rbcL protein in both samples. A = 1 μg of Chl a of sample volume; B = 0.5 μg of Chl a of sample volume; C = 0.25 μg of Chl a of sample volume.
Fig. 5
Fig. 5. Diagram of ATP and NADPH usages in D. capensis containing supplemental and essential diatoms.
We hypothesize that ODPs from essential diatom and those from supplemental diatom are kept in the same symbiosome compartment in a single D. capensis cell, based on an observation that ODPs derived from different diatom species can be preserved at the same time in a single D. capensis cell (Supplementary Fig. 2). This is indicated by a broken symbiosome membrane. A Supplemental diatom ODPs. The linear electron flow in the photosystems still works, while the CBB cycle loses activity. ATP and NADPH produced in the supplemental ODPs are therefore transported into the diatom cytoplasm via ATP and NADPH transporters/transporting systems on the diatom four plastidial membranes. After then, they are further transported into the D. capensis cytoplasm (red broken line) via unknown transporters on the symbiosome membrane, or into the CBB cycle of essential diatom-derived plastids (red smooth line) via ATP and NADPH transporters on the four plastidial membranes of essential diatoms. Two of the ATP transporters on the plastidial membranes (NTT: nucleotide translocators; with black smooth line) so far have been identified [49, 50] in free-living diatoms. The transporters indicated with the dotted lines have not yet been identified. B Essential diatom ODPs. So far, only two diatoms, N. captiva and its undescribed close relative have been found as essential diatoms of D. capensis. Both the photosystems and the CBB cycle are ideally functional as with free-living essential diatoms, because of the result of species-specific metabolic support from D. capensis (green circle).

References

    1. Archibald JM. Endosymbiosis and eukaryotic cell evolution. Curr Biol. 2015;25:911–21. doi: 10.1016/j.cub.2015.07.055. - DOI - PubMed
    1. Sagan (Margulis) L. On the origin of mitosing cells. J Theoretic Biol. 1967;14:225–74. doi: 10.1016/0022-5193(67)90079-3. - DOI - PubMed
    1. Cavalier-Smith T, Lee JJ. Protozoa as hosts for endosymbiosis and the conversion of symbionts into organelles. J Protozool. 1985;32:376–9. doi: 10.1111/j.1550-7408.1985.tb04031.x. - DOI
    1. Larkum AWD, Lockhart PJ, Howe CJ. Shopping for plastids. Trends Plant Sci. 2007;12:189–95. doi: 10.1016/j.tplants.2007.03.011. - DOI - PubMed
    1. Keeling PJ. The number, speed, and impact of plastid endosymbiosis in eukaryotic evolution. Annu Rev Plant Biol. 2013;64:583–607. doi: 10.1146/annurev-arplant-050312-120144. - DOI - PubMed

Publication types