. 2023 Jun 30;25(1):79.
doi: 10.1186/s13058-023-01668-7.

MRI-based breast cancer radiogenomics using RNA profiling: association with subtypes in a single-center prospective study

Affiliations

MRI-based breast cancer radiogenomics using RNA profiling: association with subtypes in a single-center prospective study

Ah Young Park et al. Breast Cancer Res. .

Abstract

Background: There are few prospective studies on the correlations between MRI features and whole RNA-sequencing data in breast cancer according to molecular subtypes. The purpose of our study was to explore the association between genetic profiles and MRI phenotypes of breast cancer and to identify imaging markers that influences the prognosis and treatment according to subtypes.

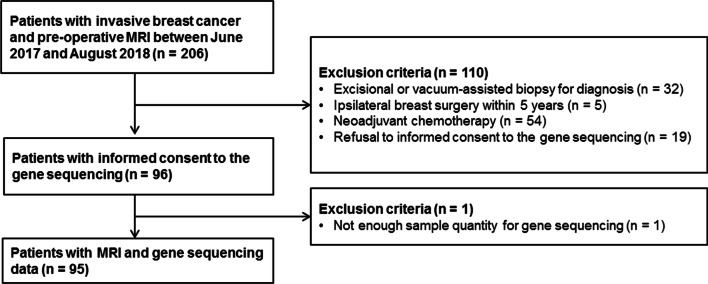
Methods: From June 2017 to August 2018, MRIs of 95 women with invasive breast cancer were prospectively analyzed, using the breast imaging-reporting and data system and texture analysis. Whole RNA obtained from surgical specimens was analyzed using next-generation sequencing. The association between MRI features and gene expression profiles was analyzed in the entire tumor and subtypes. Gene networks, enriched functions, and canonical pathways were analyzed using Ingenuity Pathway Analysis. The P value for differential expression was obtained using a parametric F test comparing nested linear models and adjusted for multiple testing by reporting Q value.

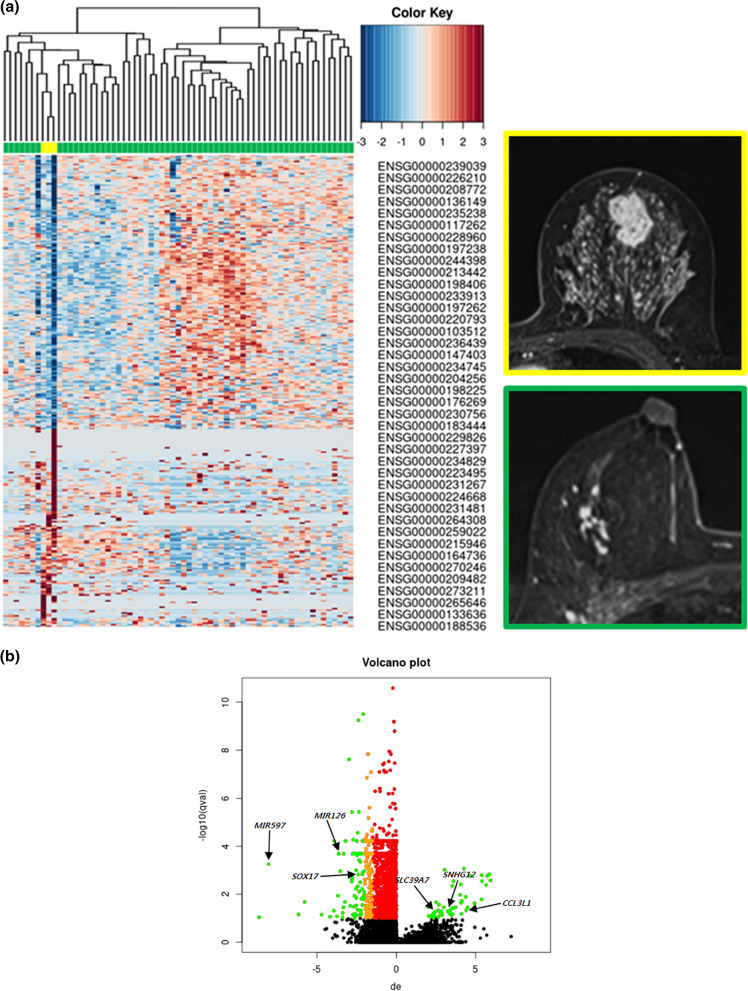
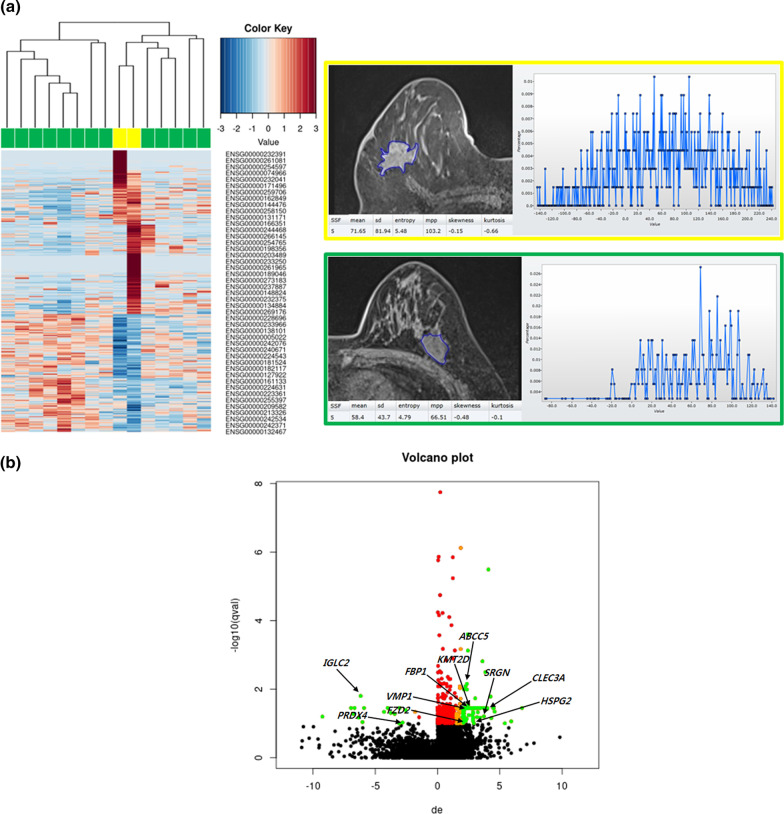
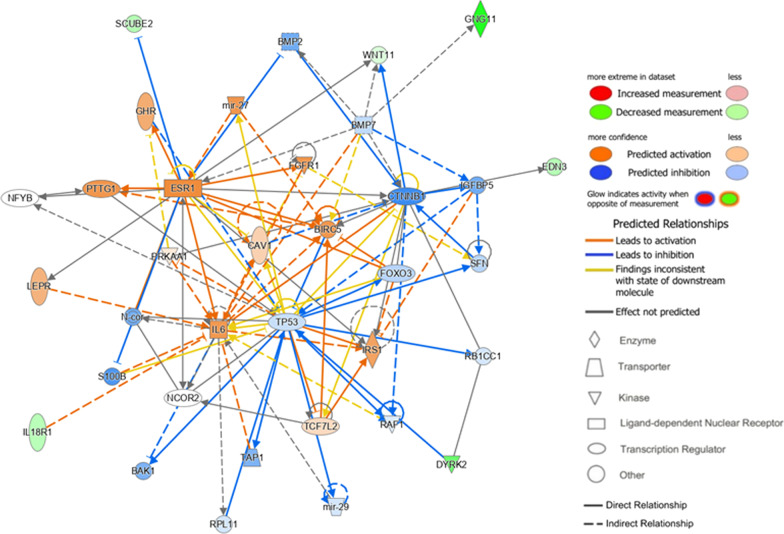
Results: In 95 participants (mean age, 53 years ± 11 [standard deviation]), mass lesion type was associated with upregulation of CCL3L1 (sevenfold) and irregular mass shape was associated with downregulation of MIR421 (sixfold). In estrogen receptor-positive cancer with mass lesion type, CCL3L1 (21-fold), SNHG12 (11-fold), and MIR206 (sevenfold) were upregulated, and MIR597 (265-fold), MIR126 (12-fold), and SOX17 (fivefold) were downregulated. In triple-negative breast cancer with increased standard deviation of texture analysis on precontrast T1-weighted imaging, CLEC3A (23-fold), SRGN (13-fold), HSPG2 (sevenfold), KMT2D (fivefold), and VMP1 (fivefold) were upregulated, and IGLC2 (73-fold) and PRDX4 (sevenfold) were downregulated (all, P < 0.05 and Q < 0.1). Gene network and functional analysis showed that mass type estrogen receptor-positive cancers were associated with cell growth, anti-estrogen resistance, and poor survival.

Conclusion: MRI characteristics are associated with the different expressions of genes related to metastasis, anti-drug resistance, and prognosis, depending on the molecular subtypes of breast cancer.

Keywords: Breast cancer; Magnetic resonance imaging; Molecular subtype; Radiogenomics; Texture analysis.


Conflict of interest statement

The authors have declared no competing interests.

Figures

Fig. 1
Fig. 1
Flowchart of study participants
Fig. 2
Fig. 2
Invasive ductal carcinoma in a 61-year-old-woman. A Tumor morphology assessments were performed on T2-weighted MRI, and pre-and postcontrast T1-weighted MRI using the BI-RADS lexicon. An irregularly shaped, marginated, and heterogeneous enhancing mass (arrows) is seen. B Texture analysis was performed within a region of interest using SSFs of 0 (unfiltered texture), 2 (fine-filtered texture), and 5 (coarse-filtered texture)
Fig. 3
Fig. 3
Radiogenomic correlations according to the lesion type in 65 participants with ER-positive breast cancer. A A heat map image demonstrates 320 differentially expressed genes according to the lesion type (P < 0.05 and log2FC > 2.0 or < − 2.0). Columns represent 320 individual differentially expressed genes (Ensemble Gene ID). The color key indicates the degree of differential gene expression in either direction to upregulation (red) or downregulation (blue). A MRI image framed in yellow shows breast cancer with mass type in a 36-year-old woman. The mass shows irregular shape, irregular margin, and heterogeneous enhancement. A MRI image framed in green shows breast cancer with non-mass enhancement type in a 52-year-old woman. This lesion shows focal homogenous non-mass enhancement. B A volcano plot demonstrates the differentially expressed genes in breast cancers with mass type compared with those with non-mass enhancement (Q < 0.1). The x-axis represents the degree of differential gene expression (log2FC) of individual genes, and the y-axis represents the negative logarithm of their Q value to base 10. Positive log2FC values represent upregulation in cancers with mass type compared with those with non-mass enhancement, and negative values represent downregulation. Green circles represent differentially expressed genes between cancers with lesion type mass and cancers with non-mass enhancement with Q < 0.1 and log2FC > 2.0 or < − 2.0
Fig. 4
Fig. 4
Radiogenomic correlations according to SD on PrecontrastT1 at SSF5 in 15 participants with TNBC. A A heat map image demonstrates 536 differentially expressed genes according to the lesion type (P < 0.05 and log2FC > 2.0 or < − 2.0). Columns represent 536 individual differentially expressed genes (Ensemble Gene ID). The color key indicates the degree of differential gene expression in either direction to upregulation (red) or downregulation (blue). The MRI image and histogram framed in yellow shows breast cancer with increased SD on PrecontrastT1 at SSF5 (81.9, > mean value 63.9) in a 48-year-old woman. The MRI image and histogram framed in green shows breast cancer with decreased SD on PrecontrastT1 at SSF5 (43.7, ≤ mean value 63.9) in a 50-year-old woman. B A volcano plot demonstrates the differentially expressed genes in breast cancers with increased SD on PrecontrastT1 at SSF5 compared with those with decreased SD on PrecontrastT1 at SSF5 (Q < 0.1). The x-axis represents the degree of differential gene expression (log2FC) of individual genes, and the y-axis represents the negative logarithm of their Q value to base 10. Positive log2FC values represent upregulation in cancers with mass type compared with those with non-mass enhancement, and negative values represent downregulation. Green circles represent differentially expressed genes between cancers with increased SD on PrecontrastT1 at SSF5 and cancers with decreased SD on PrecontrastT1 at SSF5 with Q < 0.1 and log2FC > 2.0 or < − 2.0
Fig. 5
Fig. 5
The top network by Ingenuity Pathway Analysis using differentially expressed genes (Q < 0.1) according to the lesion type in ER-positive cancer. ESR1, BIRC5, CAV1, FGFR1, IL6, MIR27, and PTTG1 were upregulated with direct or indirect interactions between them. The top functions of this network included cell cycle, cellular growth and proliferation with a score of 11. The network is presented graphically by nodes (gene–gene products) and edges (biological interactions between nodes). The shape of the nodes indicates the functional class of the gene product, and the node color intensity indicates the degree of up- (red or orange) and down- (green or blue) regulation. ER = estrogen receptor, ESR = Estrogen Receptor 1, BIRC5 = Baculoviral IAP Repeat Containing 5, CAV1 = Caveolin 1, FGFR1 = Fibroblast Growth Factor Receptor 1, IL6 = Interleukin 6, MIR27 = MicroRNA 27a, PTTG1 = PTTG1 Regulator of Sister Chromatid Separation, Securin

References

    1. Low SK, Zembutsu H, Nakamura Y. Breast cancer: the translation of big genomic data to cancer precision medicine. Cancer Sci. 2018;109(3):497–506. - PMC - PubMed
    1. Grimm LJ, Zhang J, Mazurowski MA. Computational approach to radiogenomics of breast cancer: luminal A and luminal B molecular subtypes are associated with imaging features on routine breast MRI extracted using computer vision algorithms. J Magn Reson Imaging JMRI. 2015;42(4):902–907. - PubMed
    1. Leithner D, Horvat JV, Marino MA, Bernard-Davila B, Jochelson MS, Ochoa-Albiztegui RE, Martinez DF, Morris EA, Thakur S, Pinker K. Radiomic signatures with contrast-enhanced magnetic resonance imaging for the assessment of breast cancer receptor status and molecular subtypes: initial results. Breast Cancer Res BCR. 2019;21(1):106. - PMC - PubMed
    1. Tamimi RM, Baer HJ, Marotti J, Galan M, Galaburda L, Fu Y, Deitz AC, Connolly JL, Schnitt SJ, Colditz GA, et al. Comparison of molecular phenotypes of ductal carcinoma in situ and invasive breast cancer. Breast Cancer Res BCR. 2008;10(4):R67. - PMC - PubMed
    1. Kim C, Gao R, Sei E, Brandt R, Hartman J, Hatschek T, Crosetto N, Foukakis T, Navin NE. Chemoresistance evolution in triple-negative breast cancer delineated by single-cell sequencing. Cell. 2018;173(4):879–893.e813. - PMC - PubMed

Publication types