

Deconvolution of whole blood transcriptomics identifies changes in immune cell composition in patients with systemic lupus erythematosus (SLE) treated with mycophenolate mofetil
- PMID: 37391799
- PMCID: PMC10311871
- DOI: 10.1186/s13075-023-03089-5
Deconvolution of whole blood transcriptomics identifies changes in immune cell composition in patients with systemic lupus erythematosus (SLE) treated with mycophenolate mofetil
Erratum in
-
Correction: Deconvolution of whole blood transcriptomics identifies changes in immune cell composition in patients with systemic lupus erythematosus (SLE) treated with mycophenolate mofetil.Arthritis Res Ther. 2023 Sep 4;25(1):160. doi: 10.1186/s13075-023-03160-1. Arthritis Res Ther. 2023. PMID: 37667347 Free PMC article. No abstract available.
Abstract
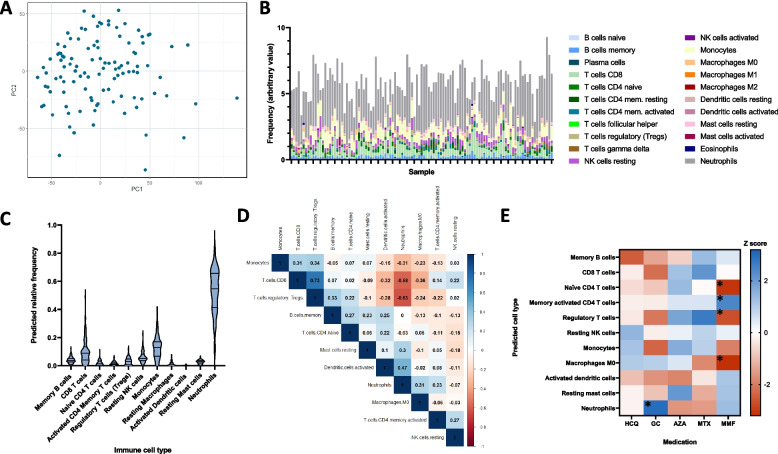
Background: Systemic lupus erythematosus (SLE) is a clinically and biologically heterogeneous autoimmune disease. We explored whether the deconvolution of whole blood transcriptomic data could identify differences in predicted immune cell frequency between active SLE patients, and whether these differences are associated with clinical features and/or medication use.
Methods: Patients with active SLE (BILAG-2004 Index) enrolled in the BILAG-Biologics Registry (BILAG-BR), prior to change in therapy, were studied as part of the MASTERPLANS Stratified Medicine consortium. Whole blood RNA-sequencing (RNA-seq) was conducted at enrolment into the registry. Data were deconvoluted using CIBERSORTx. Predicted immune cell frequencies were compared between active and inactive disease in the nine BILAG-2004 domains and according to immunosuppressant use (current and past).
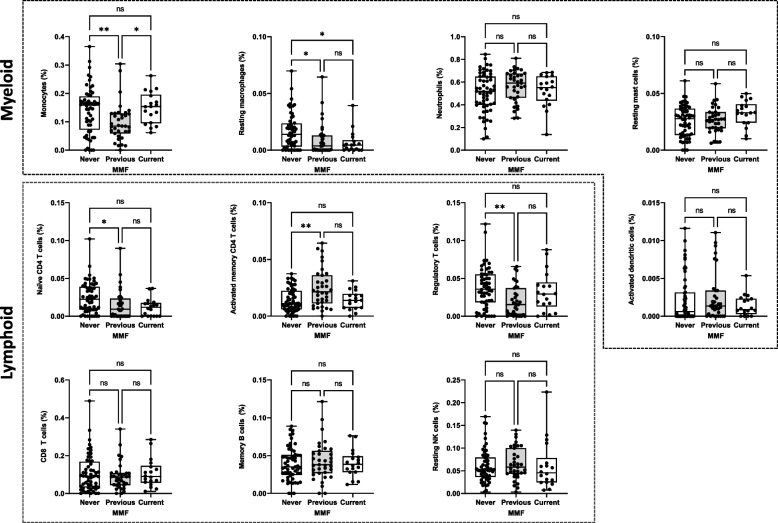
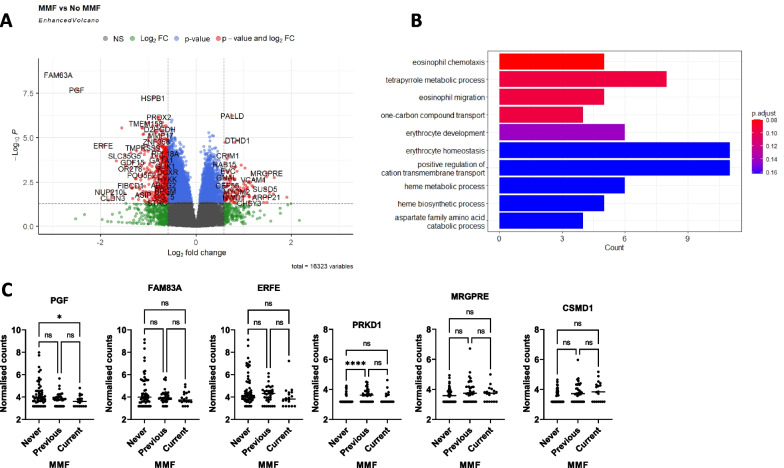
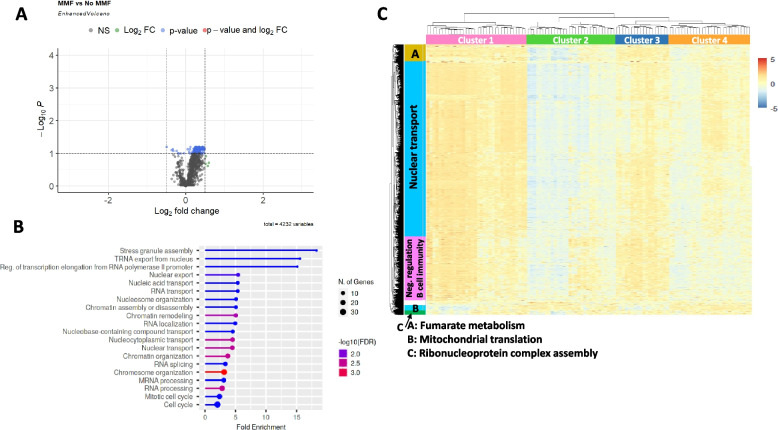
Results: Predicted cell frequency varied between 109 patients. Patients currently, or previously, exposed to mycophenolate mofetil (MMF) had fewer inactivated macrophages (0.435% vs 1.391%, p = 0.001), naïve CD4 T cells (0.961% vs 2.251%, p = 0.002), and regulatory T cells (1.858% vs 3.574%, p = 0.007), as well as a higher proportion of memory activated CD4 T cells (1.826% vs 1.113%, p = 0.015), compared to patients never exposed to MMF. These differences remained statistically significant after adjusting for age, gender, ethnicity, disease duration, renal disease, and corticosteroid use. There were 2607 differentially expressed genes (DEGs) in patients exposed to MMF with over-representation of pathways relating to eosinophil function and erythrocyte development and function. Within CD4 + T cells, there were fewer predicted DEGs related to MMF exposure. No significant differences were observed for the other conventional immunosuppressants nor between patients according disease activity in any of the nine organ domains.
Conclusion: MMF has a significant and persisting effect on the whole blood transcriptomic signature in patients with SLE. This highlights the need to adequately adjust for background medication use in future studies using whole blood transcriptomics.
Keywords: Deconvolution; Mycophenolate mofetil; Systemic lupus erythematosus; Transcriptomics.
© 2023. The Author(s).
Conflict of interest statement
INB has received grant/research support from Genzyme/Sanofi, GlaxoSmithKline, Roche, and UCB; received consulting fees from Eli Lilly, GlaxoSmithKline, ILTOO, Merck Serono, and UCB; and was a speaker for AstraZeneca, GlaxoSmithKline, and UCB. EMV has received consultancy fees from Roche, GSK, AstraZeneca, Aurinia Pharmaceuticals, Lilly and Novartis. All other authors have declared no competing interests.
Figures
References
-
- Panousis NI, Bertsias GK, Ongen H, Gergianaki I, Tektonidou MG, Trachana M, et al. Combined genetic and transcriptome analysis of patients with SLE: distinct, targetable signatures for susceptibility and severity. Ann Rheum Dis. 2019;78(8):1079–1089. doi: 10.1136/annrheumdis-2018-214379. - DOI - PMC - PubMed
Publication types
MeSH terms
Substances
Grants and funding
LinkOut - more resources
Full Text Sources
Medical
Research Materials
Miscellaneous
