. 2023 Nov;261(11):3165-3176.
doi: 10.1007/s00417-023-06145-7. Epub 2023 Jul 1.

The relationship of diabetic retinopathy severity scales with frequency and surface area of diabetic retinopathy lesions

Affiliations

The relationship of diabetic retinopathy severity scales with frequency and surface area of diabetic retinopathy lesions

Houri Esmaeilkhanian et al. Graefes Arch Clin Exp Ophthalmol. 2023 Nov.

Abstract

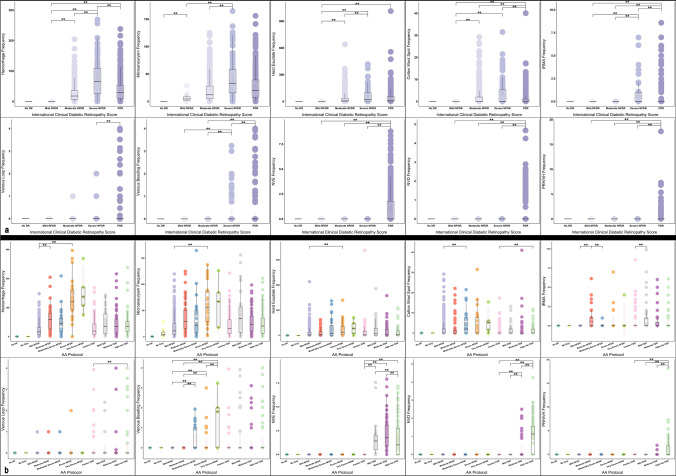
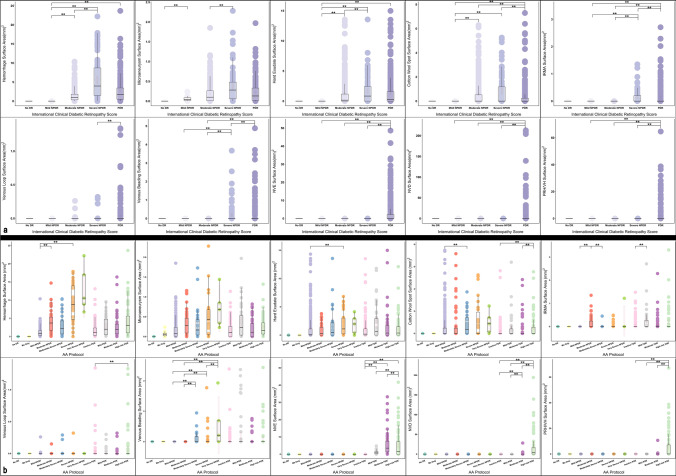
Purpose: To assess the relationship between qualitative diabetic retinopathy (DR) scales with the precise numbers and surface area of DR lesions within the Early Treatment Diabetic Retinopathy Study (ETDRS) standard seven field (S7F) region on ultrawide-field (UWF) color fundus images.

Methods: In this study, we collected UWF images from adult patients with diabetes. Poor-quality images and eyes with any pathology precluding assessment of DR severity were excluded. The DR lesions were manually segmented. DR severity was graded according to the International Clinical Diabetic Retinopathy (ICDR) and AA protocol by two masked graders within the ETDRS S7F. These lesions' numbers and surface area were computed and correlated against the DR scores using the Kruskal-Wallis H test. Cohen's Kappa was performed to determine the agreement between two graders.

Results: One thousand five hundred and twenty eyes of 869 patients (294 females, 756 right eyes) with a mean age of 58.7 years were included. 47.4% were graded as no DR, 2.2% as mild non-proliferative DR (NPDR), 24.0% as moderate NPDR, 6.3% as severe NPDR, and 20.1% as proliferative DR (PDR). The area and number of DR lesions generally increased as the ICDR level increased up to severe NPDR, but decreased from severe NPDR to PDR. There was perfect intergrader agreement on the DR severity.

Conclusion: A quantitative approach reveals that DR lesions' number and area generally correlate with ICDR-based categorical DR severity levels with an increasing trend in the number and area of DR lesions from mild to severe NPDR and a decrease from severe NPDR to PDR.

Keywords: Diabetic retinopathy; ETDRS; ICDR; NPDR; PDR; Protocol AA.


Conflict of interest statement

SriniVas Sadda- although the co-author is the editor of the journal, there was no involvement with the peer review process for this article.

Figures

Fig. 1
Fig. 1
a: GRADOR software; demonstrating the segmentation of the diabetic retinopathy (DR) lesions in an eye with severe non-proliferative diabetic retinopathy (NPDR) according to the International Clinical DR (ICDR) and moderate NPDR according to the DR Clinical Research Network (DRCR). The boundaries of lesions are first outlined and then filled with a particular pen color to designate each type of lesion. b: The ultra-wide field color fundus image with overlaid Early Treatment Diabetic Retinopathy Study (ETDRS) seven standard fields. Within the ETDRS seven standard fields in this particular case, the total number and area of hemorrhages were 78.9 and 4.1, of microaneurysms were 103.5 and 1.1, of cotton wool spots were 1.0 and 0.2, and of IRMAs were 3.0 and 0.9. There was no evidence of venous loop, venous beading, exudate, preretinal hemorrhage, NVE, and NVD in this case
Fig. 2
Fig. 2
Box and whisker plots demonstrating the frequency of diabetic retinopathy lesions within the Early Treatment Diabetic Retinopathy Study (ETDRS) seven standard fields according to the International Clinical Diabetic Retinopathy (ICDR) (a) and the Diabetic Retinopathy Clinical Research Network (DRCR) protocol AA (b). Statically significant comparisons are shown with the bars above the plots. The pairwise comparisons with the "No DR" level have not been shown since this level was significant with most of the others. Grey rectangle: confidence interval
Fig. 3
Fig. 3
Box and whisker plots demonstrating the surface area (mm2) of diabetic retinopathy lesions within the Early Treatment Diabetic Retinopathy Study (ETDRS) seven standard fields according to the International Clinical Diabetic Retinopathy (ICDR) (a) and the Diabetic Retinopathy Clinical Research Network (DRCR) protocol AA (b). Statically significant comparisons are shown with the bars above the plots. The pairwise comparisons with the "No DR" level have not been shown since this level was significant with most of the others. Grey rectangle: confidence interval, mm2: square millimeter

References

    1. Ogurtsova K, da Rocha Fernandes JD, Huang Y, et al. IDF diabetes atlas: global estimates for the prevalence of diabetes for 2015 and 2040. Diabetes Res Clin Pract. 2017;128:40–50. doi: 10.1016/j.diabres.2017.03.024. - DOI - PubMed
    1. Zhang Y, Yang R, Hou Y, et al. Association of cardiovascular health with diabetic complications, all-cause mortality, and life expectancy among people with type 2 diabetes. Diabetol Metab Syndr. 2022;14:158. doi: 10.1186/s13098-022-00934-6. - DOI - PMC - PubMed
    1. Yau JW, Rogers SL, Kawasaki R, et al. Global prevalence and major risk factors of diabetic retinopathy. Diabetes Care. 2012;35:556–564. doi: 10.2337/dc11-1909. - DOI - PMC - PubMed
    1. Chew EY, Ferris FL, 3rd, Csaky KG, et al. The long-term effects of laser photocoagulation treatment in patients with diabetic retinopathy: the early treatment diabetic retinopathy follow-up study. Ophthalmology. 2003;110:1683–1689. doi: 10.1016/s0161-6420(03)00579-7. - DOI - PubMed
    1. Ashraf M, Cavallerano JD, Sun JK et al (2021) Ultrawide field imaging in diabetic retinopathy: exploring the role of quantitative metrics. J Clin Med 10. 10.3390/jcm10153300 - PMC - PubMed