Zeb1 and Tle3 are trans-factors that differentially regulate the expression of myosin heavy chain-embryonic and skeletal muscle differentiation
- PMID: 37392376
- PMCID: PMC7615532
- DOI: 10.1096/fj.202201698RR
Zeb1 and Tle3 are trans-factors that differentially regulate the expression of myosin heavy chain-embryonic and skeletal muscle differentiation
Abstract
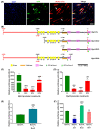
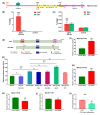
Myosin heavy chain-embryonic encoded by the Myh3 gene is a skeletal muscle-specific contractile protein expressed during mammalian development and regeneration, essential for proper myogenic differentiation and function. It is likely that multiple trans-factors are involved in this precise temporal regulation of Myh3 expression. We identify a 4230 bp promoter-enhancer region that drives Myh3 transcription in vitro during C2C12 myogenic differentiation and in vivo during muscle regeneration, including sequences both upstream and downstream of the Myh3 TATA-box that are necessary for complete Myh3 promoter activity. Using C2C12 mouse myogenic cells, we find that Zinc-finger E-box binding homeobox 1 (Zeb1) and Transducin-like Enhancer of Split 3 (Tle3) proteins are crucial trans-factors that interact and differentially regulate Myh3 expression. Loss of Zeb1 function results in earlier expression of myogenic differentiation genes and accelerated differentiation, whereas Tle3 depletion leads to reduced expression of myogenic differentiation genes and impaired differentiation. Tle3 knockdown resulted in downregulation of Zeb1, which could be mediated by increased expression of miR-200c, a microRNA that binds to Zeb1 transcript and degrades it. Tle3 functions upstream of Zeb1 in regulating myogenic differentiation since double knockdown of Zeb1 and Tle3 resulted in effects seen upon Tle3 depletion. We identify a novel E-box in the Myh3 distal promoter-enhancer region, where Zeb1 binds to repress Myh3 expression. In addition to regulation of myogenic differentiation at the transcriptional level, we uncover post-transcriptional regulation by Tle3 to regulate MyoG expression, mediated by the mRNA stabilizing Human antigen R (HuR) protein. Thus, Tle3 and Zeb1 are essential trans-factors that differentially regulate Myh3 expression and C2C12 cell myogenic differentiation in vitro.
Keywords: C2C12 cells; Tle3; Zeb1; mouse; myogenin; myosin heavy chain-embryonic; regeneration; skeletal muscle.
© 2023 Federation of American Societies for Experimental Biology.
Conflict of interest statement
The authors declare no conflicts of interest.
Figures


Similar articles
-
Myosin heavy chain-embryonic regulates skeletal muscle differentiation during mammalian development.Development. 2020 Apr 6;147(7):dev184507. doi: 10.1242/dev.184507. Development. 2020. PMID: 32094117 Free PMC article.
-
ZEB1 imposes a temporary stage-dependent inhibition of muscle gene expression and differentiation via CtBP-mediated transcriptional repression.Mol Cell Biol. 2013 Apr;33(7):1368-82. doi: 10.1128/MCB.01259-12. Epub 2013 Jan 22. Mol Cell Biol. 2013. PMID: 23339872 Free PMC article.
-
The transcriptional co-repressor TLE3 regulates myogenic differentiation by repressing the activity of the MyoD transcription factor.J Biol Chem. 2017 Aug 4;292(31):12885-12894. doi: 10.1074/jbc.M116.774570. Epub 2017 Jun 12. J Biol Chem. 2017. PMID: 28607151 Free PMC article.
-
MicroRNA-200C and -150 play an important role in endothelial cell differentiation and vasculogenesis by targeting transcription repressor ZEB1.Stem Cells. 2013 Sep;31(9):1749-62. doi: 10.1002/stem.1448. Stem Cells. 2013. PMID: 23765923
-
Expression of myosin heavy chain and of myogenic regulatory factor genes in fast or slow rabbit muscle satellite cell cultures.J Muscle Res Cell Motil. 1995 Dec;16(6):619-28. doi: 10.1007/BF00130243. J Muscle Res Cell Motil. 1995. PMID: 8750233
Cited by
-
Crosstalk among canonical Wnt and Hippo pathway members in skeletal muscle and at the neuromuscular junction.Neural Regen Res. 2025 Sep 1;20(9):2464-2479. doi: 10.4103/NRR.NRR-D-24-00417. Epub 2024 Sep 6. Neural Regen Res. 2025. PMID: 39248171 Free PMC article.
-
Integrated analysis of miRNAs-mRNAs in skeletal muscle development revealed that novel-miR-766 affects myoblast differentiation and myofiber-type formation in sheep.Front Cell Dev Biol. 2025 Jul 31;13:1615676. doi: 10.3389/fcell.2025.1615676. eCollection 2025. Front Cell Dev Biol. 2025. PMID: 40823533 Free PMC article.
-
The Wnt-pathway corepressor TLE3 interacts with the histone methyltransferase KMT1A to inhibit differentiation in Rhabdomyosarcoma.Oncogene. 2024 Feb;43(7):524-538. doi: 10.1038/s41388-023-02911-3. Epub 2024 Jan 4. Oncogene. 2024. PMID: 38177411
-
The impact of canonical Wnt transcriptional repressors TLE3 and TLE4 on postsynaptic transcription at the neuromuscular junction.Front Mol Neurosci. 2024 Mar 27;17:1360368. doi: 10.3389/fnmol.2024.1360368. eCollection 2024. Front Mol Neurosci. 2024. PMID: 38600964 Free PMC article.
-
Mechanism of Myh3 gene regulation of intramuscular fat content in Beijing black pigs via the MAPK signaling pathway.BMC Genomics. 2025 Jul 7;26(1):642. doi: 10.1186/s12864-025-11528-7. BMC Genomics. 2025. PMID: 40624626 Free PMC article.
References
-
- Beylkin DH, Allen DL, Leinwand LA. MyoD, Myf5, and the calcineurin pathway activate the developmental myosin heavy chain genes. Dev Biol. 2006;294:541–553. - PubMed
-
- Daou N, Lecolle S, Lefebvre S, et al. A new role for the calcineurin/NFAT pathway in neonatal myosin heavy chain expression via the NFATc2/MyoD complex during mouse myogenesis. Development. 2013;140:4914–4925. - PubMed
Publication types
MeSH terms
Substances
Grants and funding
LinkOut - more resources
Full Text Sources
Molecular Biology Databases
Research Materials
Miscellaneous

