Review
. 2023 Aug:128:103528.
doi: 10.1016/j.dnarep.2023.103528. Epub 2023 Jun 24.

Single-molecule imaging of genome maintenance proteins encountering specific DNA sequences and structures

Affiliations
Review

Single-molecule imaging of genome maintenance proteins encountering specific DNA sequences and structures

Elizabeth Marie Irvin et al. DNA Repair (Amst). 2023 Aug.

Abstract

DNA repair pathways are tightly regulated processes that recognize specific hallmarks of DNA damage and coordinate lesion repair through discrete mechanisms, all within the context of a three-dimensional chromatin landscape. Dysregulation or malfunction of any one of the protein constituents in these pathways can contribute to aging and a variety of diseases. While the collective action of these many proteins is what drives DNA repair on the organismal scale, it is the interactions between individual proteins and DNA that facilitate each step of these pathways. In much the same way that ensemble biochemical techniques have characterized the various steps of DNA repair pathways, single-molecule imaging (SMI) approaches zoom in further, characterizing the individual protein-DNA interactions that compose each pathway step. SMI techniques offer the high resolving power needed to characterize the molecular structure and functional dynamics of individual biological interactions on the nanoscale. In this review, we highlight how our lab has used SMI techniques - traditional atomic force microscopy (AFM) imaging in air, high-speed AFM (HS-AFM) in liquids, and the DNA tightrope assay - over the past decade to study protein-nucleic acid interactions involved in DNA repair, mitochondrial DNA replication, and telomere maintenance. We discuss how DNA substrates containing specific DNA sequences or structures that emulate DNA repair intermediates or telomeres were generated and validated. For each highlighted project, we discuss novel findings made possible by the spatial and temporal resolution offered by these SMI techniques and unique DNA substrates.

Keywords: Cohesin; High-speed AFM imaging; Mitochondrial DNA replication; Protein-DNA interactions; Shelterin; Single-molecule imaging.


Conflict of interest statement

Declaration of Competing Interest The authors declare that they have no known competing financial interests or personal relationships that could have appeared to influence the work reported in this paper.

Figures

Figure 1:
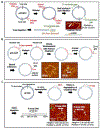
Figure 1:. Atomic force microscopy (AFM) and DNA tightrope assay.
(A) Diagram of AFM operation mechanism (29). (B) Schematic of Dual-Resonance-frequency-enhanced electrostatic force enhanced microscopy (DREEM) and example images of a nucleosome on dsDNA (76). (C) Diagram of the DNA tightrope assay. Gray spheres represent poly-L-lysine-treated silica beads (52). (D) Schematic of QD conjugation strategies. Left: Conjugation of His-tagged proteins to streptavidin-coated QDs through the biotinylated BT-tris-NTA linker. Right: Conjugation of epitope-tagged proteins to antibody-coated QDs using the “antibody sandwich” method (51,53).
Figure 2:
Figure 2:. Generation and validation of DNA substrates that emulate DNA repair and replication intermediates.
(A) Generation of linear gap DNA and its validation by mtSSB, which preferentially binds to the ssDNA (gap) region (50). (B) Generation of the DNA replication fork substrate and binding of cohesin SA2 at the fork junction (51). (C) Generation of the linear R-loop DNA through in vitro transcription and its validation using RNA:DNA hybrid-binding S9.6 antibody (52).
Figure 3:
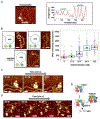
Figure 3:. Structure and dynamics of DNA binding and unwinding by Twinkle revealed by AFM imaging in air and HS-AFM imaging in liquids.
(A) Representative AFM image capturing hTwinkle’s helicase activity. ssDNA accumulates around hTwinkle as it unwinds duplex DNA (left panel). ssDNA (denoted by gray line) can be distinguished from dsDNA (denoted by blue line) by their height difference (~200 pm, right panel) (95). (B) Representative AFM images of hTwinkle in the presence of mtSSB on circular DNA with two gap sites (left panels), and quantification of hTwinkle’s DNA unwinding rate (bp/min) with increasing concentrations of mtSSB (right panels). hTwinkle partially unwinds one or both gap sites, or fully unwinds the duplex between the gap sites (95). (C) Time-lapse HS-AFM images showing LcTwinkle captures DNA through N-protrusion (denoted by green arrow) (129). Also see Video S1. (D) Time-lapse HS-AFM images showing LcTwinkle transiently binds to DNA through N-protrusion (denoted by green arrow), followed by the transfer to its central channel (denoted by pink arrow) (129). Also see Video S2. (E) Model of Twinkle DNA binding based on cryo-EM structure and AFM imaging of LcTwinkle-DNA (129).
Figure 4:
Figure 4:. DREEM reveals DNA paths in protein-DNA complexes.
(A) ssDNA wraps twice around histone proteins (128). (B) dsDNA wraps around mtSSB once (50). (C) DNA appears at the edge of large TRF2 complexes (208). (D) dsDNA wraps around the TRFH domain from TRF2 (171). Left panels: Topographical AFM images. Right panels: DREEM images. Inserts in A, B, and D: models of protein-DNA complexes based on DREEM images.
Figure 5:
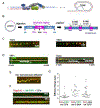
Figure 5:. R-loops recruit SA1/SA2 and PARP1, and activate PARP1.
(A) Diagram of the linear R-loop DNA (top) and representative AFM image of SA2 on the R-loop DNA (bottom) (52). (B) Diagrams of the DNA substrates (top left), representative fluorescence images (middle left) and kymographs (bottom left) of QD-labeled SA2, and analysis of the spacing between QD-labeled SA2 on R-loop and control DNA (right) (52). The distribution of distances between adjacent QD-SA2 on R-loop DNA tightropes is consistent with SA2 specifically binds to R-loops (marked by the red lines). (C) Model and representative AFM image of PARP1 binding linear R-loop DNA (left panel) and analysis of positions of R-loops, PARP1 on R-loop DNA and control DNA in the absence of NAD+ (right panel) (109). (D) Model and representative AFM image showing PARP1 auto-PARylation on the R-loop DNA in the presence of NAD+. Arrow: PAR chain (109).
Figure 6:
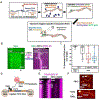
Figure 6:. DNA tightrope study of TRF1/TRF2 and the interaction between TRF1 and cohesin SA1.
(A) Diagram of shelterin complex and T-loop (32). (B) Schematic of telomere DNA substrate [54]. (C) Representative fluorescence images of QD-TRF1 and QD-TRF2 on T270 tightropes. Their regular spacing shows specific binding of TRF1 and TRF2 to telomere regions at even intervals (79). (D) Representative kymographs for QD-labeled TRF1 and TRF2 on T270 DNA tightropes (79). (E) Representative kymograph showing QD-SA1 pauses while moving across telomere sequences (53). (F and G) Representative tightrope kymographs (F) and analysis of diffusion range (G) of QD-TRF1 (green) and QD-SA1 (red) on telomeric T270 DNA and genomic DNA (G-DNA) (53).
Figure 7:
Figure 7:. TIN2 enhances TRF2-mediated DNA compaction, bridging of single-stranded telomeric RNA to telomere sequences, and T-loop formation.
(A) The RSE method for purifying long telomeric DNA from mouse liver (213). (B and C) QD-TIN2 (purple) enhances TRF2-mediated compaction of YOYO1-labeled long telomere DNA (tDNA) purified using the RSE method. Black arrows mark the DNA anchoring proint. White arrows mark reversal in buffer flow direction to validate the absence of nonspecific interactions between DNA and surface (213). (D) Schematic of the DNA tightrope assay for monitoring the bridging of single-stranded telomeric RNA (TERRA) onto DNA tightropes. (E) example images (top) and kymographs (bottom) of QD-labeled telomeric RNA on DNA tightropes in the presence of TRF2 or TRF2-TIN2S (213). (F) Representative AFM images showing TRF2 and TRF2-TIN2L mediated T-loops on linear T270 DNA. A QD in the top image marks the non-telomeric end (213).

References

    1. Ciccia A, and Elledge SJ (2010) The DNA Damage Response: Making It Safe to Play with Knives. Mol Cell 40, 179–204 - PMC - PubMed
    1. Friedberg EC (2008) A brief history of the DNA repair field. Cell Res 18, 3–7 - PubMed
    1. Howard MJ, and Wilson SH (2018) DNA scanning by base excision repair enzymes and implications for pathway coordination. DNA Repair 71, 101–107 - PMC - PubMed
    1. Kunkel TA, and Erie DA (2005) DNA mismatch repair. Annu Rev Biochem 74, 681–710 - PubMed
    1. Iyer RR, Pluciennik A, Burdett V, and Modrich PL (2006) DNA mismatch repair: functions and mechanisms. Chem Rev 106, 302–323 - PubMed

Publication types

LinkOut - more resources