. 2023 Jul 11;56(7):1613-1630.e5.
doi: 10.1016/j.immuni.2023.06.003. Epub 2023 Jun 30.

CXCR3 expression in regulatory T cells drives interactions with type I dendritic cells in tumors to restrict CD8+ T cell antitumor immunity

Affiliations

CXCR3 expression in regulatory T cells drives interactions with type I dendritic cells in tumors to restrict CD8+ T cell antitumor immunity

Mariela A Moreno Ayala et al. Immunity. .

Abstract

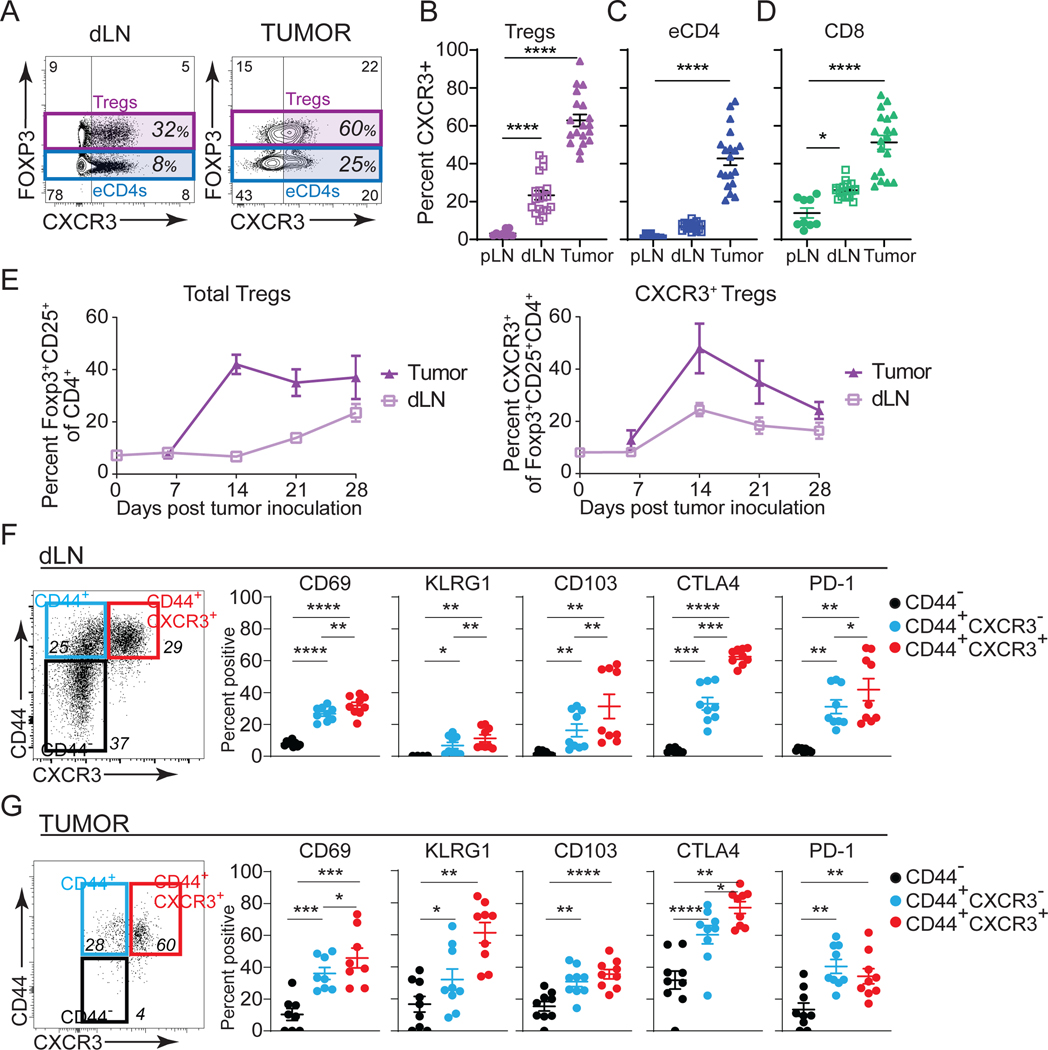
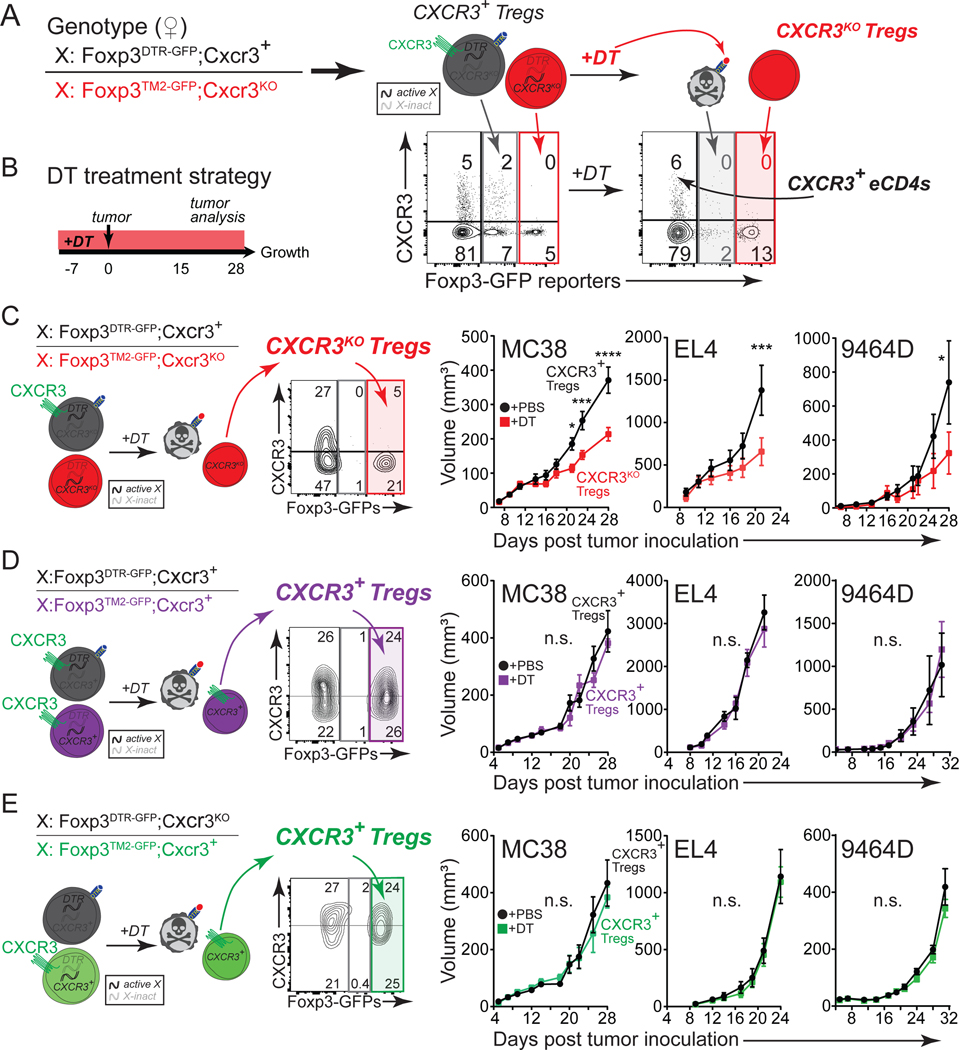
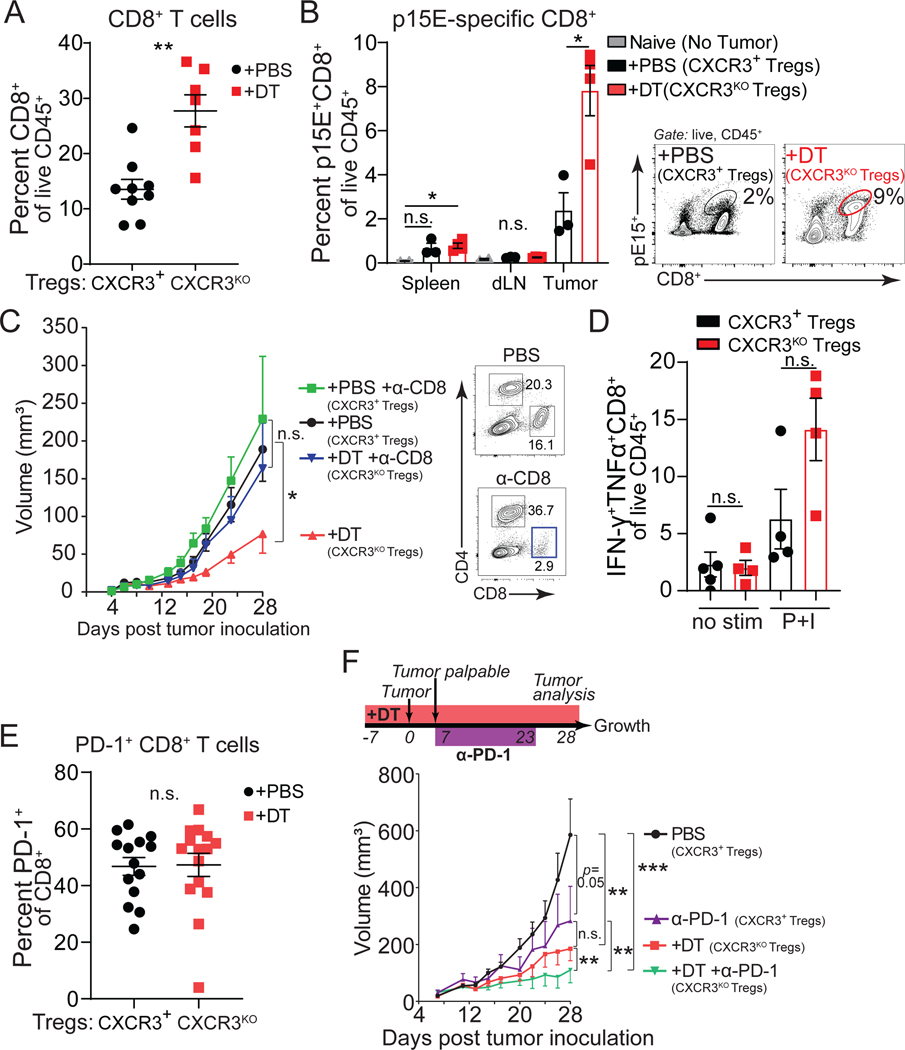
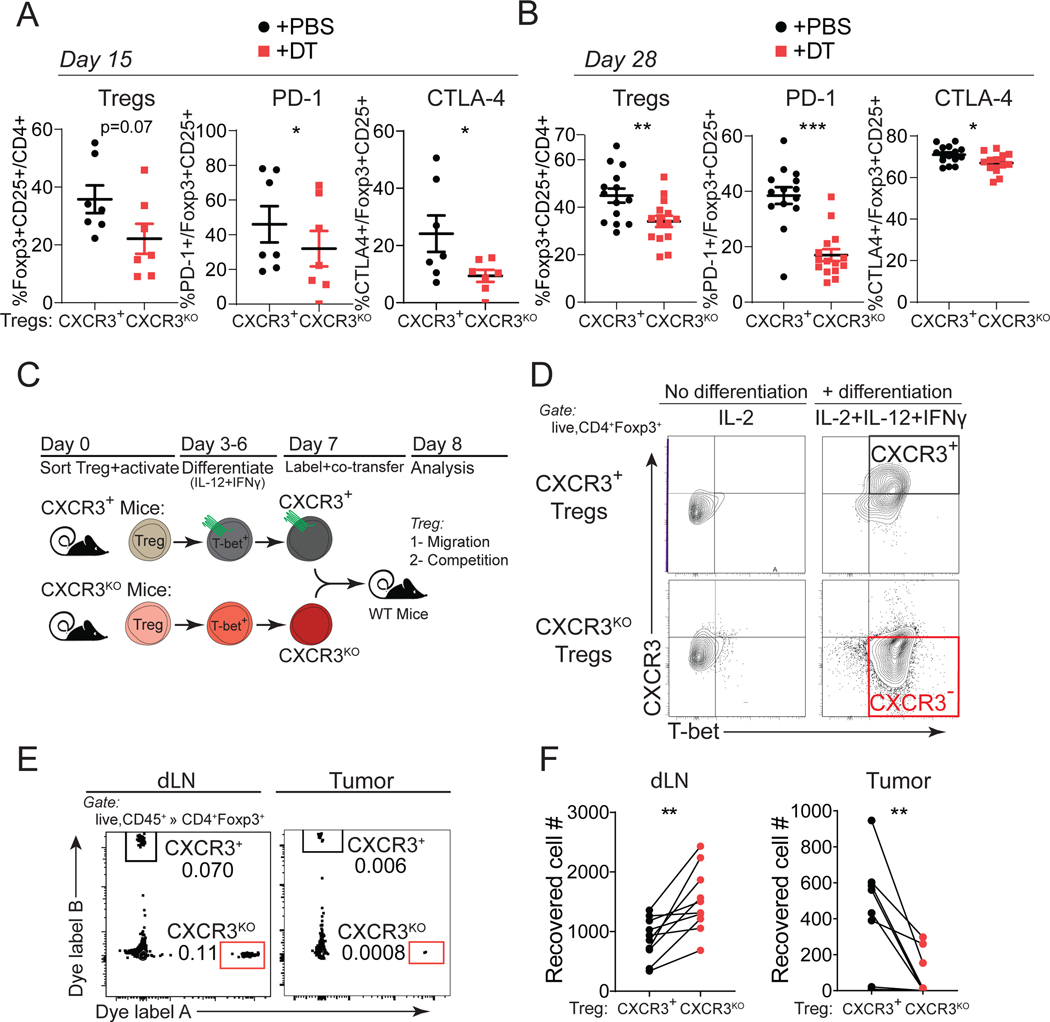
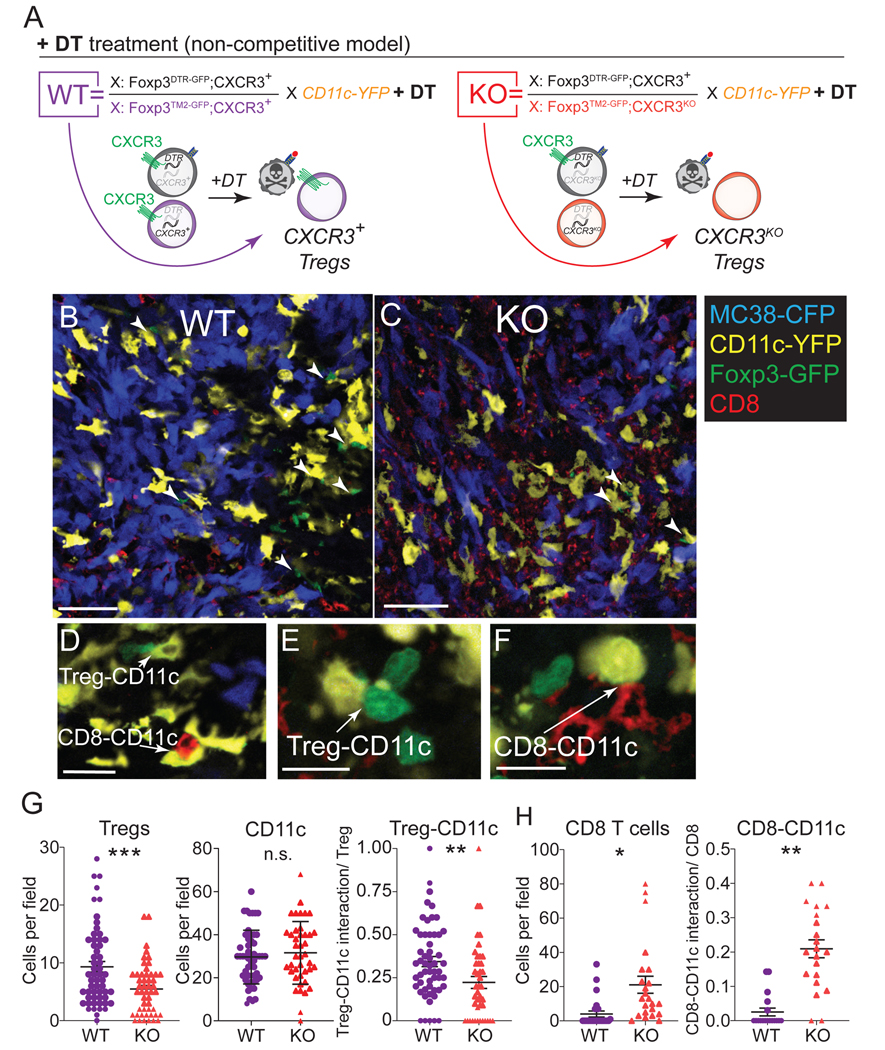
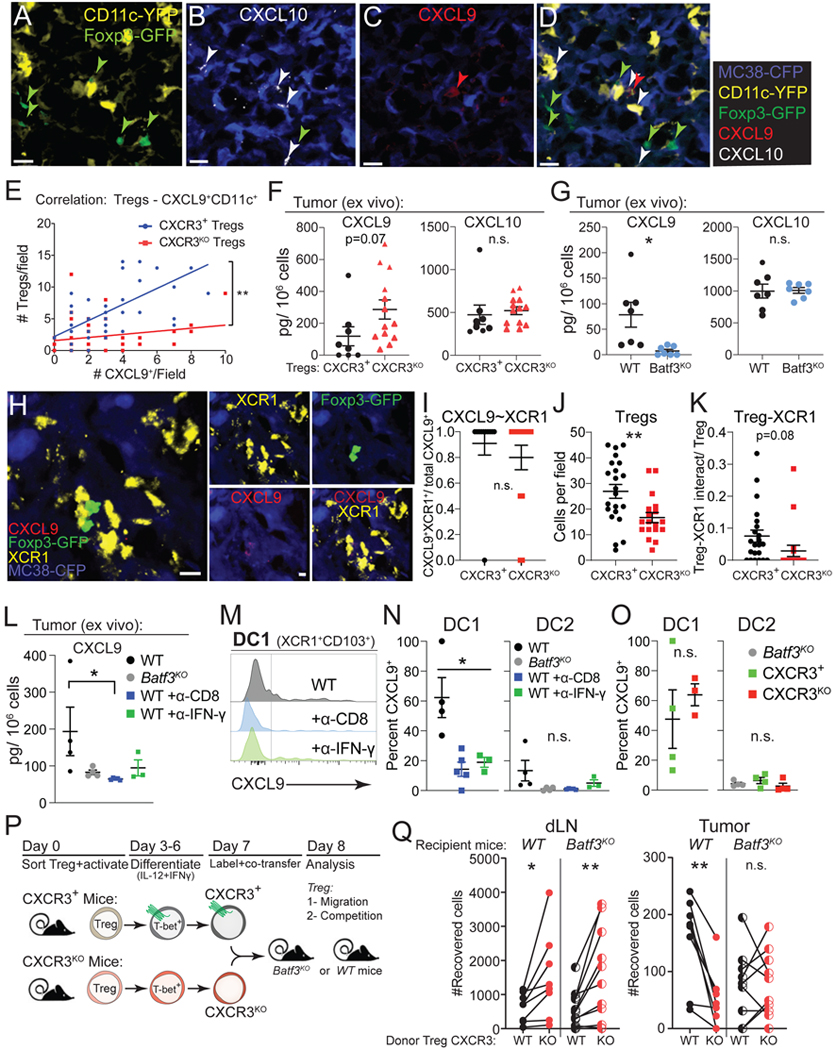
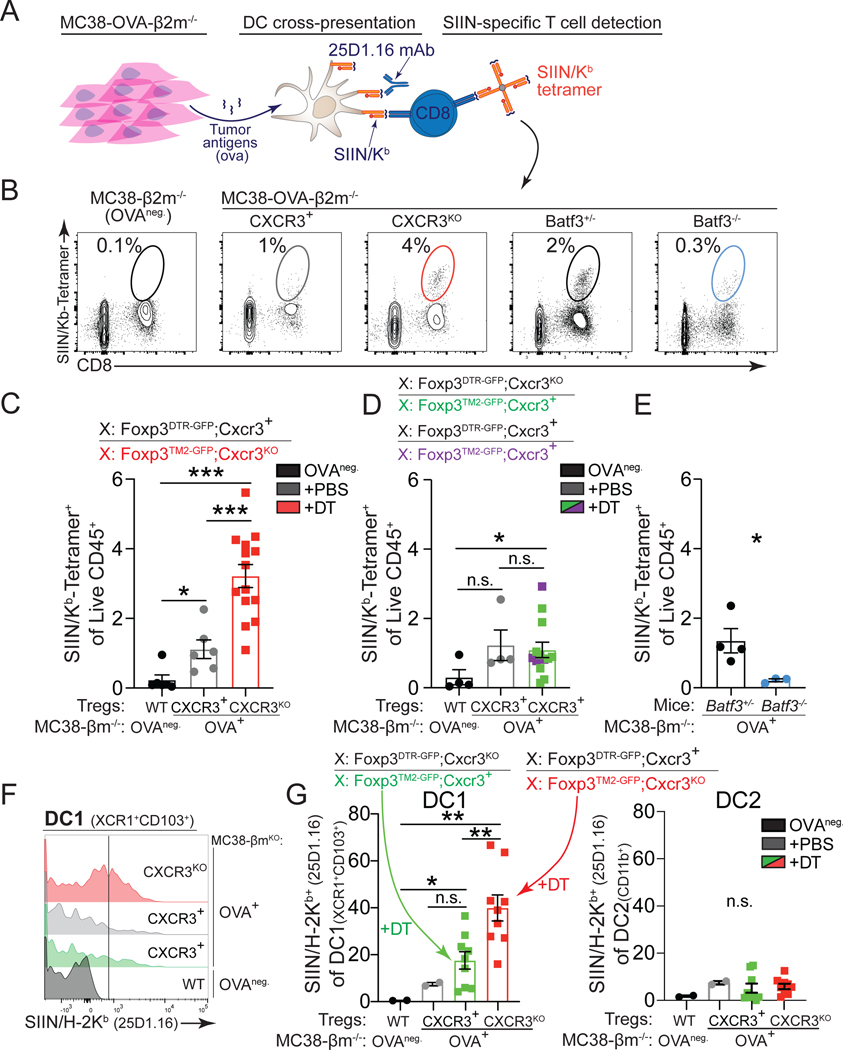
Infiltration of regulatory T (Treg) cells, an immunosuppressive population of CD4+ T cells, into solid cancers represents a barrier to cancer immunotherapy. Chemokine receptors are critical for Treg cell recruitment and cell-cell interactions in inflamed tissues, including cancer, and thus are an ideal therapeutic target. Here, we show in multiple cancer models that CXCR3+ Treg cells were increased in tumors compared with lymphoid tissues, exhibited an activated phenotype, and interacted preferentially with CXCL9-producing BATF3+ dendritic cells (DCs). Genetic ablation of CXCR3 in Treg cells disrupted DC1-Treg cell interactions and concomitantly increased DC-CD8+ T cell interactions. Mechanistically, CXCR3 ablation in Treg cells increased tumor antigen-specific cross-presentation by DC1s, increasing CD8+ T cell priming and reactivation in tumors. This ultimately impaired tumor progression, especially in combination with anti-PD-1 checkpoint blockade immunotherapy. Overall, CXCR3 is shown to be a critical chemokine receptor for Treg cell accumulation and immune suppression in tumors.

Keywords: CXCR3; Tregs; cancer; checkpoint blockade; cross presentation; dendritic cells; immunotherapy; regulatory T cells.


Conflict of interest statement

Declaration of interests M.A.M.A. is currently employed by Revolution Medicines (Redwood City, CA).

Figures

Figure 1.
Figure 1.. CXCR3+ Treg cells are generated in response to tumors.
(A) Flow cytometric analysis of FOXP3 versus CXCR3 expression in live CD45+CD4+ T cells in tumor draining lymph node (dLN) and tumor (MC38). (B-D) Quantification of perecent CXCR3+ T cells in peripheral lymph node (pLN), dLN and tumor in Treg cells (B), eCD4+ (CD4+Foxp3, C), and CD8+ T cells (D) on day 15 post MC38 tumor inoculation (n=16 pooled from four independent experiments). (E) Time course of Treg cell (Foxp3+CD25+/Live CD45+CD4+, left panel) and CXCR3+ Treg cell (right panel) frequency over the course of tumor growth in dLN (light purple) and tumor (dark purple) (n=3–4 mice/group, representative of two independent experiments). (F-G) Left panel: Flow cytometric staining for CD44 versus CXCR3 in FOXP3+CD25+ of Live CD45+ cells in dLN (F) and MC38 tumors (G). Right panels: Quantification of specified proteins in CD44 (black), CD44+CXCR3 (blue), and CD44+CXCR3+ (red) Treg cells (n=4–5 mice pooled from two independent experiments). Data represents mean ± SEM; *p < 0.05, **p < 0.01, ***p < 0.001, and ****p < 0.0001 from two-way ANOVA followed by Dunnet’s multiple comparisons test. Also see Figure S1.
FIGURE 2.
FIGURE 2.. Treg-specific CXCR3-deficiency impedes cancer.
(A) Left: genotype of female mice depicting the allele configuration of Foxp3 and Cxcr3 on the X chromosomes. Right: Schematic depicting the resulting Treg phenotypes from this genotype due to random X inactivation before and after DT treatment. Complementary flow cytometric analysis of CXCR3 versus Foxp3 GFP reporters in Live CD45+CD4+ cells from dLN before and after DT treatment is shown below schematic. (B) Experimental strategy to deplete Foxp3DTR-GFP-expressing Treg cells in female mice with DT. (C-E) Left: genotype of female mice and representative flow cytometric analysis of CXCR3 versus Foxp3 GFP reporters in Live CD45+CD4+ cells from tumors with DT treatment. Right: tumor growth curves of MC38, EL4, and 9464D tumors in indicated mice treated with PBS or DT (n=7–8 mice/group, representative of three independent experiments for MC38 and two independent experiments for EL4 and 9464D). Results from Foxp3DTR-GFP;Cxcr3+/Foxp3TM2-GFP;Cxcr3KO mice that generate Cxcr3KO Treg cells with DT (C). Results from Foxp3DTR-GFP;Cxcr3+/Foxp3TM2-GFP;Cxcr3+ mice that maintain Cxcr3+ Treg cells with DT (D). Results from Foxp3DTR-GFP;Cxcr3KO/Foxp3TM2-GFP;Cxcr3+ mice that maintain Cxcr3+ Treg cells with DT (E). Data represents mean ± SEM; *p < 0.05, **p < 0.01, ***p < 0.001, ****p < 0.0001, and not significant (n.s.) from two-way ANOVA with Sidak’s multiple comparisons. Also see Figure S2.
Figure 3.
Figure 3.. Enhanced CD8 tumor immunity with Cxcr3KO Treg cells.
(A-B) Quantification of total intratumoral CD8+ T cells from Foxp3DTR-GFP;Cxcr3+/Foxp3TM2-GFP; Cxcr3KO female mice harboring Cxcr3+ (+PBS, black) or Cxcr3KO (+DT, red) Treg cells in MC38 tumors (day 28) (n=6–8 per group, data pooled from two independent experiments). (B) Tumor-specific p15E-reactive CD8+ T cells were measured from indicated organs (day 15, MC38) (n=4–5 mice per group, data representative of two independent experiments). Mice without tumors (naïve) served as a negative control for p15E/Kb tetramer stain (grey). Representative flow cytometric analysis of intratumoral pE15 tetramer stain in PBS and DT treated mice (right panel). (C) Growth of MC38 tumors in control females (+PBS, black), control females treated with anti-CD8 depleting antibody (+PBS +α-CD8, green), Cxcr3KO Treg cell females (+DT, red), or Cxcr3KO Treg cell females treated with an anti-CD8 depleting antibody (+DT +α-CD8, blue) (n=8 mice per group, representative of two independent experiments). Representative flow cytometric analysis of CD4+ and CD8+ cells in spleens of control or anti-CD8 treated groups (right panel). (D) IFN-γ+TNFa+CD8+ of Live CD45+ in tumors (day 15, MC38) from indicated mice after no stimulation (no stim) or stimulation with PMA and Ionomycin (P+I) ex vivo (n=4–5 per group). (E) PD-1 expression on intratumoral CD8+ T cells (day 28, MC38) (data pooled from three independent experiments). (F) Growth of MC38 tumors in mice with Cxcr3+ (+PBS, black) or Cxcr3KO Treg cells (+DT, red), or treated with anti-PD-1 in mice with Cxcr3+ (+α-PD-1, purple) or Cxcr3KO Treg cells (+DT+α-PD-1, green) (n=6–7 mice per group). Data represent mean ± SEM; *p < 0.05, **p < 0.01, ***p < 0.001 from two-way ANOVA followed by Dunnet’s multiple comparisons test, two-way ANOVA with Sidak’s multiple comparisons, or student’s t tests. Tumor growth assessed using multiple regression analyses. Also see Figure S3.
Figure 4.
Figure 4.. CXCR3 is required for Treg accumulation and activation in tumors.
(A-B) Quantification of intratumoral Treg cell frequency or their PD-1 and CTLA-4 expression from Foxp3DTR-GFP;Cxcr3+/Foxp3TM2-GFP;Cxcr3KO female mice harboring Cxcr3+ (+PBS, black) or Cxcr3KO (+DT, red) Treg cells at day 15 (A) or day 28 (B) of MC38 tumor progression (n=7 mice per group, pooled from two independent experiments). (C) Schematic describing the generation of CXCR3+ and Cxcr3ΔTregcells by in vitro differentiation, fluorescent dye-labeling, and co-transfer into MC38 tumor-bearing mice for localization analysis. (D) Analysis of Treg cells for CXCR3 and T-BET expression prior to adoptive transfer. (E) Representative flow cytometry plots from dLN and MC38 tumors for transferred Cxcr3+ and Cxcr3KO Treg cells. (F) Absolute number of Cxcr3+ (black) or Cxcr3KO Treg cells (red) cells recovered. Lines connect Treg cells collected from the same mouse (data pooled from three independent experiments). Data represents mean ± SEM; *p < 0.05, **p < 0.01 by unpaired (or paired analysis in F) Student’s t tests. Also see Figure S4.
Figure 5.
Figure 5.. CXCR3 expression on Tregs facilitates CD11c+ cell interaction in tumors.
(A) Genotype of female mice and schematic depicting the resulting Treg phenotypes after DT treatment. Mice were treated with DT beginning 7 days prior to tumor inoculation and throughout tumor progression. (B-C) Representative confocal microscopy images from WT (B) and KO (C) mice as described in (A) at 15 days of tumor progression showing MC38-CFP (blue), CD11c-YFP (yellow), Foxp3TM2-GFP (green), and CD8+ (red) cells. Arrowheads point to cell-cell interactions between Tregs and CD11c+ cells (representative of 60–70 images analyzed from 3 mice per group pooled from 3 independent experiment). Scale bar = 50 μm. (D-F) High magnification examples of counted cell-cell interactions between Treg-CD11c cells (D, E) and CD8-CD11c cells (E, F). Scale bar = 15 μm. (G-H) Total numbers of Tregs, CD11c cells (G) or CD8+ cells (H) were counted per field at 20X magnification. Cell-cell interactions were examined at higher magnification and confirmed through multiple z-stacks. Cell-cell interactions were normalized based on the number of Tregs (G) or CD8+ cells (H) per field to yield a probability of interaction per Treg or CD8+ cell (representative of 60–70 images analyzed from 3 mice per group and pooled from 3 independent experiments). Data represents mean ± SEM; *p < 0.05, **p < 0.01 ***p < 0.001 by Student’s t test.
Figure 6.
Figure 6.. Type 1 DCs are required for the preferential localization of CXCR3+ Tregs in tumors.
(A-D) Representative confocal microscopy images from Foxp3DTR-GFP;Cxcr3+/Foxp3TM2-GFP; Cxcr3+;CD11c-YFP mice treated with DT and analyzed at 15 days of tumor progression showing CD11c-YFP (yellow) and Foxp3TM2-GFP (green) (A), anti-CXCL10 and MC38-CFP (B), anti-CXCL9 and MC38-CFP (C), and a composite image (D). Arrowheads point to Tregs (green), CXCL9+ (red), and CXCL10+ (white) cells. Scale bar = 20 μm. (E) Correlation between the number of Foxp3TM2-GFP-expressing CXCR3+ Tregs (blue) from DT treated Foxp3DTR-GFP; Cxcr3+/Foxp3TM2-GFP;Cxcr3+;CD11c-YFP mice or Foxp3TM2-GFP-expressing CXCR3KO Tregs (red) from DT treated Foxp3DTR-GFP;Cxcr3+/Foxp3TM2-GFP;Cxcr3KO;CD11c-YFP mice versus CXCL9+CD11c+ cells per field at 20X magnification in MC38 tumors at day 15 of tumor progression (representative of 50–60 images analyzed from 3 mice per group and pooled from 3 independent experiments). (F) MC38 tumors from DT-treated mice bearing CXCR3+ or CXCR3KO Tregs were harvested at day 15 of tumor progression and CXCL9 and CXCL10 were quantified by ELISA (n= 6–7 mice per group, pooled from two independent experiments). (G) MC38 tumors from WT or Batf3KO mice were tested for CXCL9 and CXCL10 levels as in (G) (n= 3–4 mice per group, pooled from two independent experiments). (H) Representative confocal microscopy images from Foxp3DTR-GFP;Cxcr3+/Foxp3TM2-GFP;Cxcr3+ mice with CXCR3+ Tregs at 15 days of tumor progression showing MC38-CFP (blue), anti-XCR1 (yellow), Foxp3TM2-GFP (green), and anti-CXCL9+ (red) cells. Scale bar = 5 μm. (I-J) Fraction of CXCL9+ cells that are XCR1+ (CXCL9+XCR1+/CXCL9+) assessed by immunofluorescence (I). Total Tregs (J) and XCR1-Treg interactions (K) were examined at higher magnification and confirmed through multiple z-stacks. Cell-cell interactions were normalized based on the number of Tregs (K) per field to yield a probability of interaction per Treg. Cells were counted per field at 20X magnification (representative of 22–24 images analyzed from 4 mice per group). (L) MC38 tumors from WT (black), Batf3KO (grey), or WT mice treated with PBS (black), anti-CD8 (blue), or anti-IFN-γ (green) were tested for CXCL9 by ELISA (L, n= 4 mice per group). (M-N) Flow cytometric analysis for intracellular CXCL9 protein in DC1 and DC2 from MC38 tumors in mice as described in (L) and quantified in (N, n= 4 mice per group). (O) Flow cytometric analysis for intracellular CXCL9 protein in DC1 and DC2 from MC38 tumors in mice with CXCR3+ (green) or CXCR3KO (red) Tregs after treatment with DT or in Batf3KO (grey) mice and quantified (n=3–4 mice per group). (P) Schematic describing the generation of CXCR3+ and CXCR3KO Tregs by in vitro differentiation, fluorescent dye-labeling, and co-transfer into MC38 tumor-bearing C57BL/6 wildtype or Batf3KO mice for localization analysis after 24 hours. (Q) Absolute number of CXCR3+ (black filled) or CXCR3KO (red filled) Tregs recovered in dLN and tumor 24 hours after transfer into C57BL/6 wildtype mice (WT) or number of CXCR3+ (black hatched) or CXCR3KO (red hatched) Tregs recovered after transfer to Batf3KO mice. Lines connect CXCR3+ and CXCR3KO Tregs collected from the same mouse (n=3 mice per genotype/experiment and all data pooled from three independent experiments). Data represents mean ± SEM; *p < 0.05, **p < 0.01 by Student’s t test. For correlation in (F), a simple linear regression was employed and slopes between regressions were compared.
Figure 7.
Figure 7.. Lack of CXCR3+ Treg cells boosts cross-presentation in tumors.
(A) Experimental setup to assess tumor antigen cross-presentation by analyzing SIIN/H-2Kb presentation on antigen presenting cells (25D1.16 antibody) and CD8+ SIIN/Kb-tetramer+ T cell responses to ovalbumin expressed from β2m-deficient tumors. (B-E) Representative flow cytometric analysis (B) and quantification (C-E) of the frequencies of intratumoral SIIN/Kb-tetramer-specific CD8+ T cells in indicated mice (day 15–20, MC38) (C-D, n=5–6 mice per group, data pooled from three independent experiments; E, n=3–4 mice per group, data representative of two independent experiments). (F-G) Representative flow cytometric analysis (F) and quantification (G) of SIIN/H-2Kb presentation on intratumoral DC1 (XCR1+CD103+) (left) and DC2 (right) using 25D1.16 from MC38-β2m-deficient tumors that do no express OVA (OVA-negative, black) or OVA-expressing tumors in Foxp3DTR-GFPCxcr3KO/Foxp3TM2-GFP;Cxcr3+ (CXCR3+, green) and Foxp3DTR-GFPCxcr3+/Foxp3TM2-GFP;Cxcr3KO mice treated with DT (CXCR3KO, red) or PBS (CXCR3+, grey) (n=4–5 mice per DT-treated group pooled from two experiments). Data represents mean ± SEM; *p < 0.05, **p < 0.01 from one-way ANOVA followed by Dunnet’s multiple comparisons test. Also see Figure S7.

Comment in

References

    1. Liu C, Workman CJ, and Vignali DA (2016). Targeting regulatory T cells in tumors. FEBS J 283, 2731–2748. 10.1111/febs.13656. - DOI - PubMed
    1. Nunez NG, Tosello Boari J, Ramos RN, Richer W, Cagnard N, Anderfuhren CD, Niborski LL, Bigot J, Meseure D, De La Rochere P, et al. (2020). Tumor invasion in draining lymph nodes is associated with Treg accumulation in breast cancer patients. Nat Commun 11, 3272. 10.1038/s41467-020-17046-2. - DOI - PMC - PubMed
    1. Wang D, Quiros J, Mahuron K, Pai CC, Ranzani V, Young A, Silveria S, Harwin T, Abnousian A, Pagani M, et al. (2018). Targeting EZH2 Reprograms Intratumoral Regulatory T Cells to Enhance Cancer Immunity. Cell Rep 23, 3262–3274. 10.1016/j.celrep.2018.05.050. - DOI - PMC - PubMed
    1. DuPage M (2011). Endogenous T cell responses to antigens expressed in lung adenocarcinoma delay malignant tumor progression. Cancer Cell 19 (Supplemental data). - PMC - PubMed
    1. Shang B, Liu Y, Jiang SJ, and Liu Y (2015). Prognostic value of tumor-infiltrating FoxP3+ regulatory T cells in cancers: a systematic review and meta-analysis. Sci Rep 5, 15179. 10.1038/srep15179. - DOI - PMC - PubMed

Publication types