. 2023 Jul 11;56(7):1631-1648.e10.
doi: 10.1016/j.immuni.2023.06.007. Epub 2023 Jun 30.

TCR-independent CD137 (4-1BB) signaling promotes CD8+-exhausted T cell proliferation and terminal differentiation

Affiliations

TCR-independent CD137 (4-1BB) signaling promotes CD8+-exhausted T cell proliferation and terminal differentiation

Andrea C Pichler et al. Immunity. .

Abstract

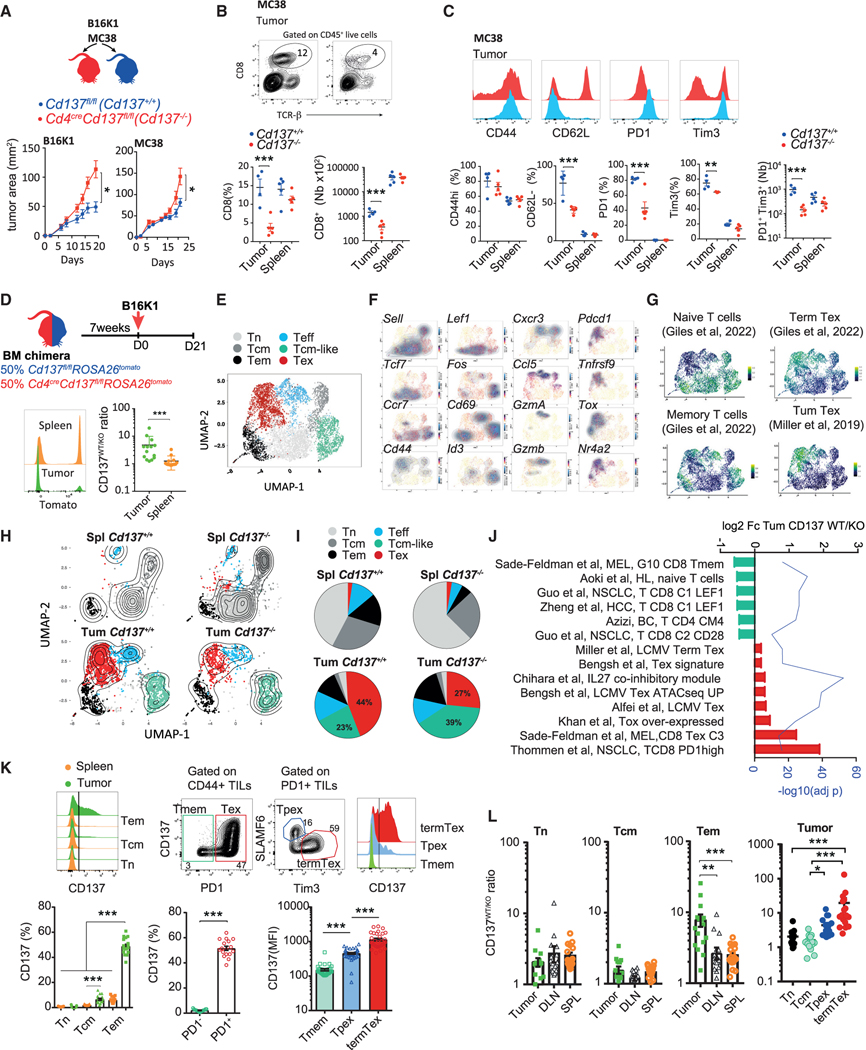
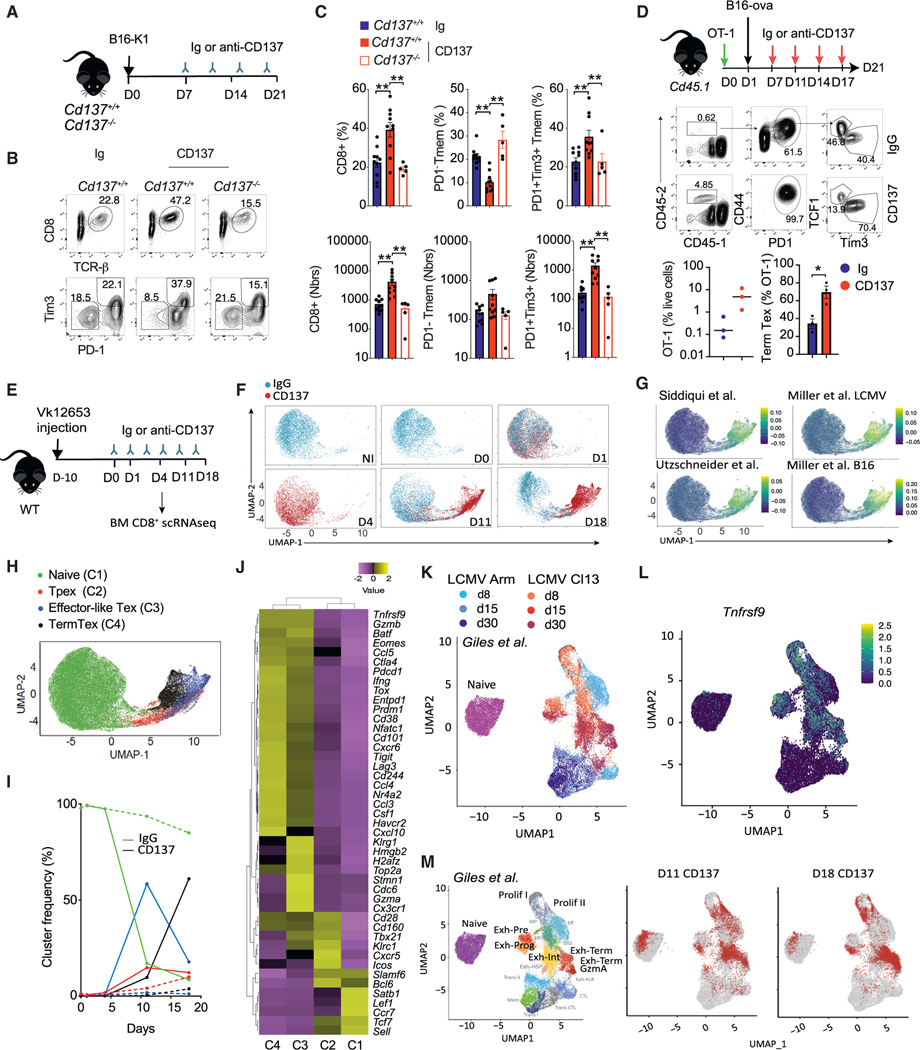
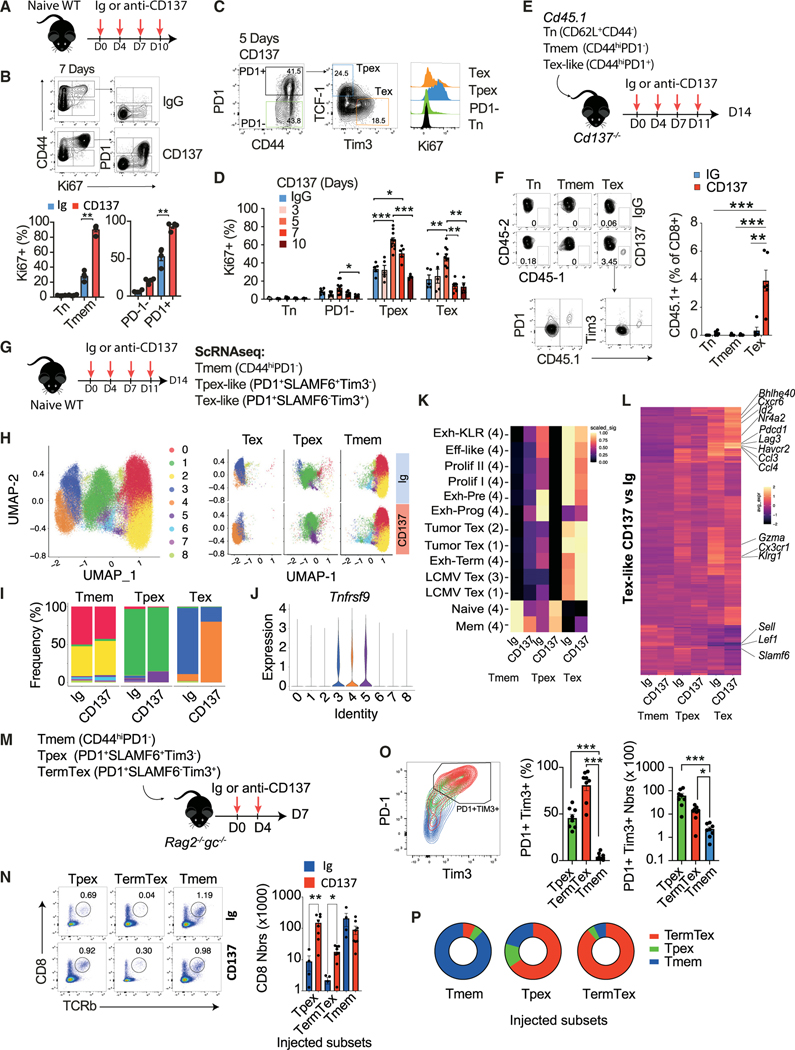
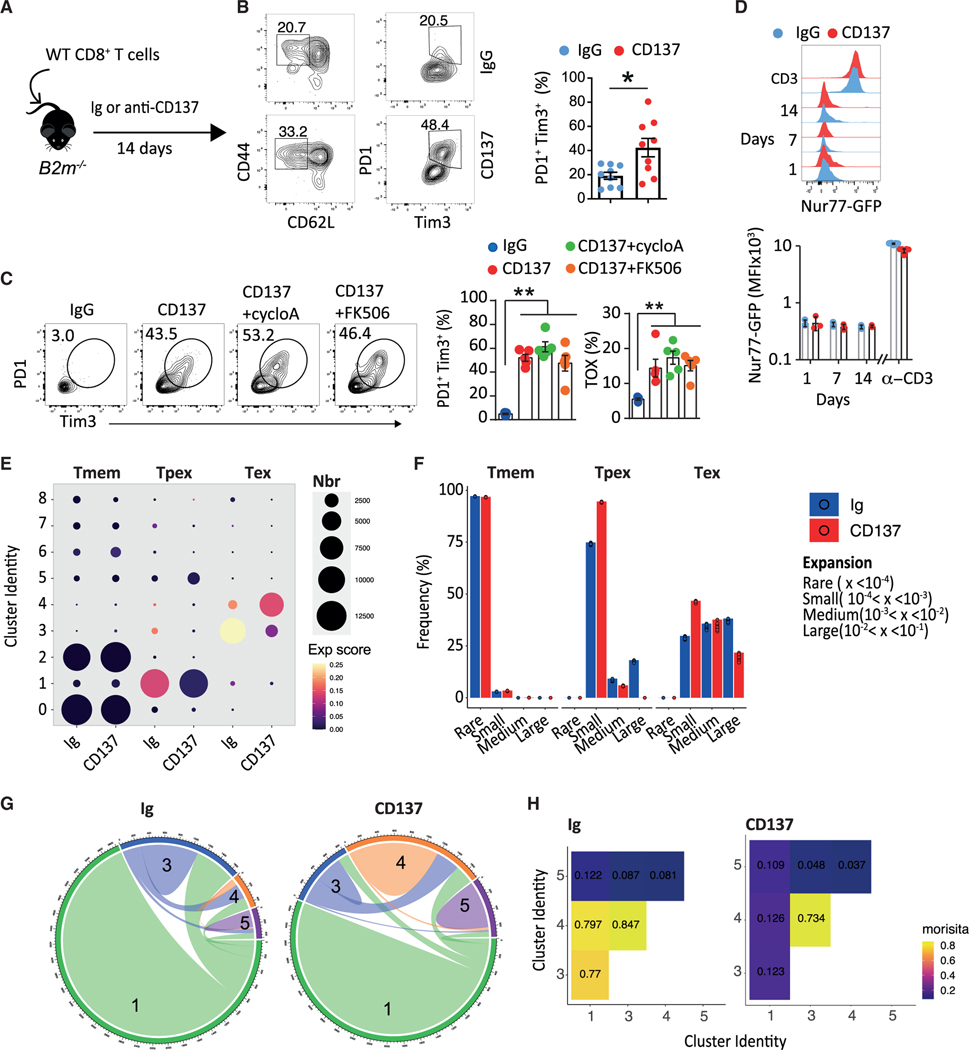
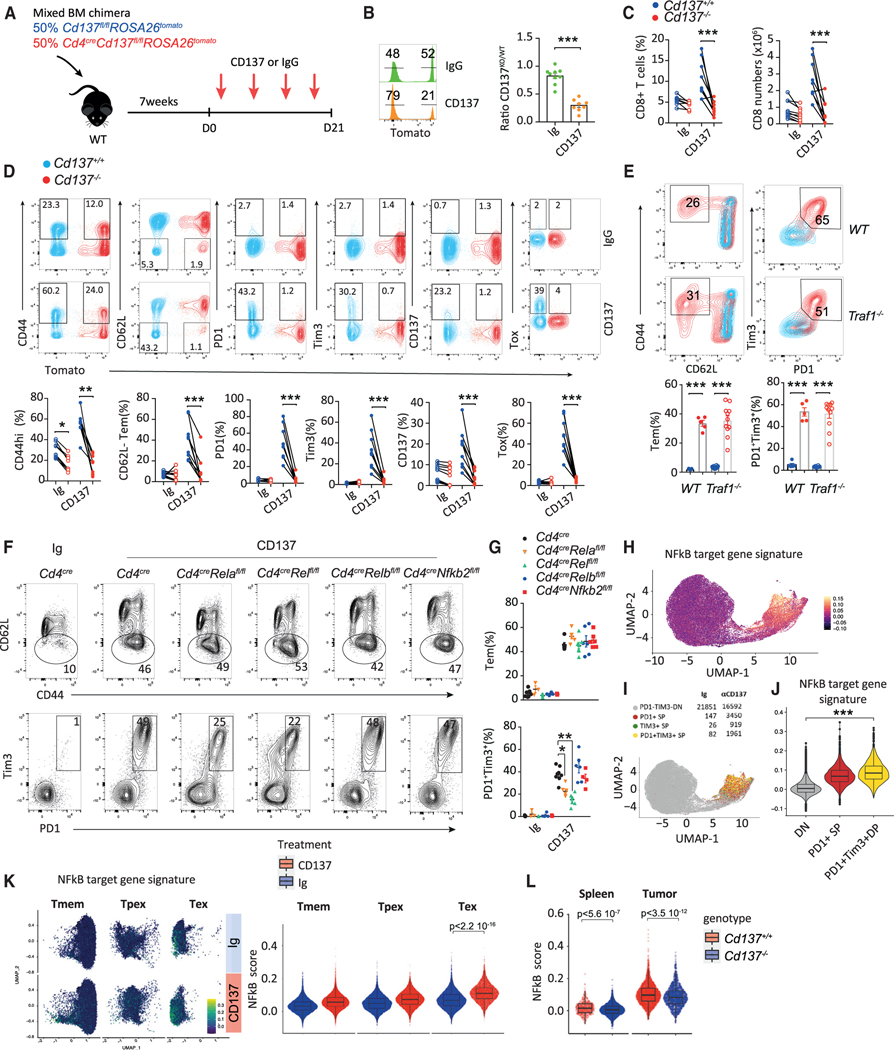
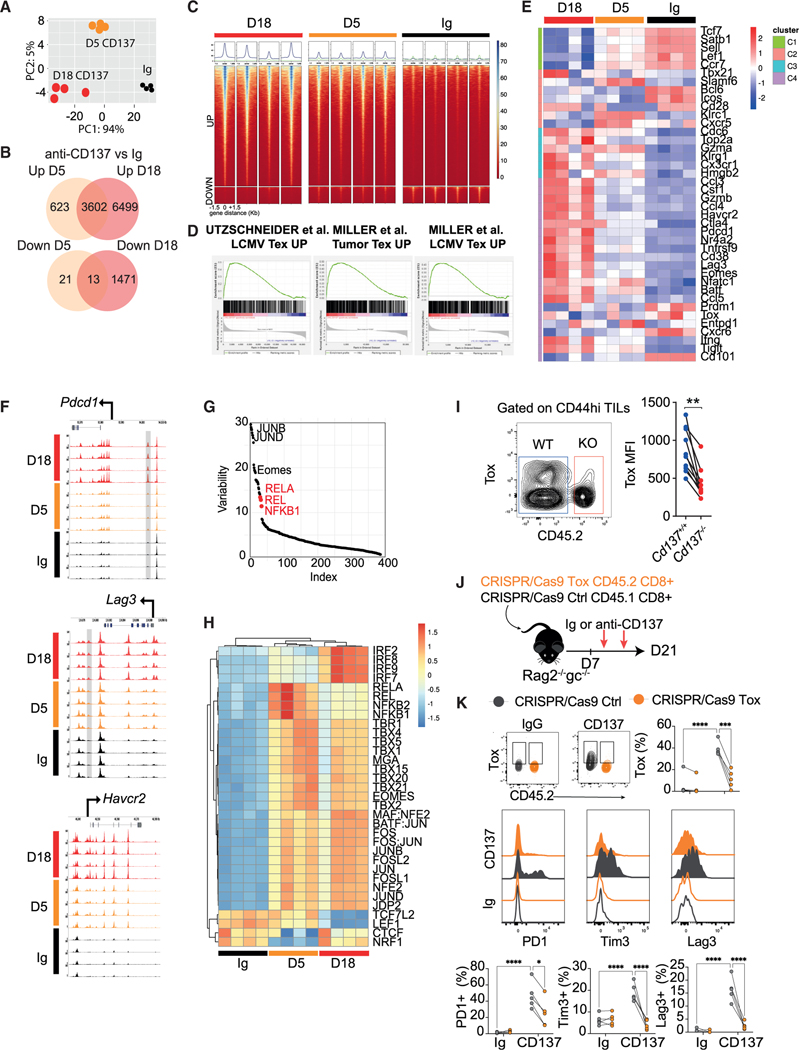
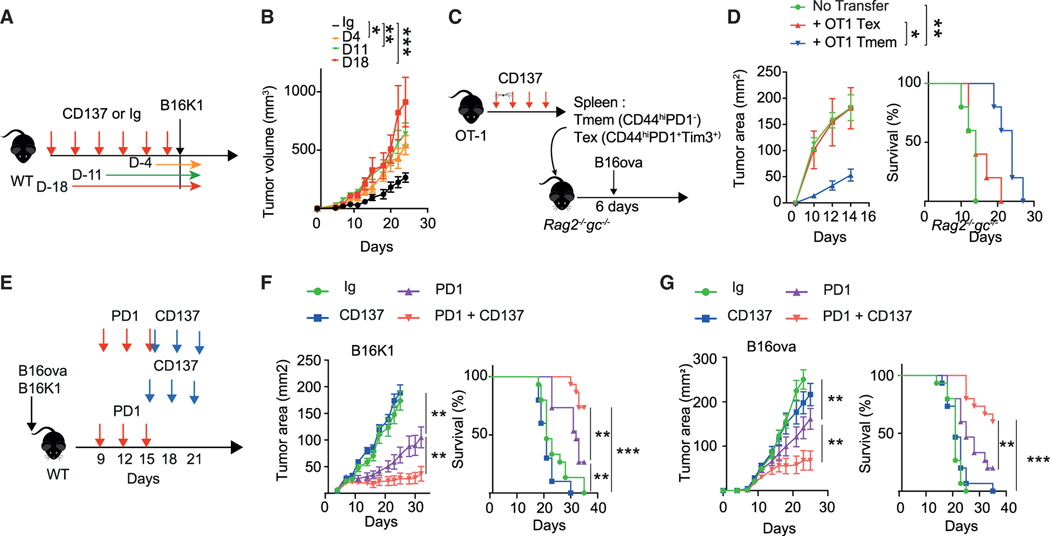
CD137 (4-1BB)-activating receptor represents a promising cancer immunotherapeutic target. Yet, the cellular program driven by CD137 and its role in cancer immune surveillance remain unresolved. Using T cell-specific deletion and agonist antibodies, we found that CD137 modulates tumor infiltration of CD8+-exhausted T (Tex) cells expressing PD1, Lag-3, and Tim-3 inhibitory receptors. T cell-intrinsic, TCR-independent CD137 signaling stimulated the proliferation and the terminal differentiation of Tex precursor cells through a mechanism involving the RelA and cRel canonical NF-κB subunits and Tox-dependent chromatin remodeling. While Tex cell accumulation induced by prophylactic CD137 agonists favored tumor growth, anti-PD1 efficacy was improved with subsequent CD137 stimulation in pre-clinical mouse models. Better understanding of T cell exhaustion has crucial implications for the treatment of cancer and infectious diseases. Our results identify CD137 as a critical regulator of Tex cell expansion and differentiation that holds potential for broad therapeutic applications.

Keywords: CD137 (TNFRSF9, 4-1BB); CD8(+) T lymphocytes; NF-κB signaling; T cell exhaustion; activation receptor; immune checkpoint blockade; immunotherapy; tumor immune escape.


Conflict of interest statement

Declaration of interests The authors declare no competing interests.

Figures

Figure 1.
Figure 1.. CD137 deficiency limits tumor-infiltrating Tex cells
(A–C) Cd4cre Cd137fl/fl (Cd137−/−) and Cd137fl/fl (Cd137+/+) were injected s.c. with MC38 or B16K1 cells. (A) Tumor area. (B) Frequency and number of CD8+ T cells. (C) Expression of the indicated markers by CD8+ T cells. (D–J) Cd4creCd137fl/flROSA26tomato and Cd137fl/flROSA26tomato mixed BM chimeras were injected s.c. with B16K1 cells. Cd137−/− (tomato+) and Cd137+/+ (tomato) spleen and tumor-infiltrating CD8+ T cells were analyzed by single-cell RNA sequencing (scRNA-seq) after 21 days. (n = 7 pooled mice/group.) (D) Ratio of CD137+/+ vs. CD137−/−(CD137WT/KO) spleen and tumor-infiltrating CD8+ T cells. (E) Spleen and tumor-infiltrating CD8+ T cells transcriptomic landscape scattered in 6 clusters. (F and G) Relative expression of the indicated genes (F) and signatures (G). (H and I) UMAP (H) and graphs (I) showing cluster frequency in the indicated samples. (J) Fold change in expression and adjusted p value of relevant pathways enriched in Cd137+/+ vs. Cd137−/− tumor-infiltrating CD8+ T cells. (K) Expression of CD137 by the indicated spleen or B16K1-tumor-infiltrating CD8+ T cell subsets after 19 days. (L) CD137WT/KO ratio in the indicated CD8+ T cell subsets from B16K1 bearing mixed BM chimeras as in (D). Data are presented as mean ± SEM from at least 2 independent experiments. Each symbol represents an individual mouse. *p < 0.05; **p < 0.01, ***p < 0.001 (Mann-Whitney test or ANOVA with Tukey’s post-test analysis).
Figure 2.
Figure 2.. CD137 stimulation favors tumor Tex cell accumulation
(A–C) Cd4creCd137fl/fl (Cd137−/−) and Cd137fl/fl(Cd137+/+) were injected s.c. with B16K1 cells and treated with anti-CD137 (3H3, 10 μg) or Ig control mAbs. (A) Experimental design. (B and C) FACS plots (B) and graphs (C) showing the frequency and numbers of PD1+Tim3+ CD8+TILs after 21 days. (D) Cd45.1 mice reconstituted with 107 OT-1 cells were injected B16-ova tumors and treated with anti-CD137 or Ig mAbs. Experimental design and graphs showing the intratumor Tpex and TermTex OT-1 CD8+ T cells frequency. (E–J) WT mice were challenged with Vk12653 myeloma cells and after 10 days, mice were injected with anti-CD137 or Ig mAbs. Bone marrow CD8+ T cells were analyzed by scRNA-seq (n = 5 pooled mice/group). (E) Experimental design. (F) UMAP split by Ig or anti-CD137 treatment. (G) Relative expression of the indicated Tex-specific signature.,, (H) Identification of four clusters on UMAP plots. (I) Frequency of the indicated clusters along Ig or anti-CD137 treatment. (J) Log-normalized gene-expression heatmap showing the expression of naive, Tpex, effector-like, and TermTex cell signature genes by the indicated clusters defined as in (H). Data are scaled rowwise (violet low – yellow high). (K–M) Comparison of anti-CD137 scRNA-seq as in (E) with Giles et al. dataset of CD8+ T cells from LCMV Arm and cl13. (K) UMAP plot colored by experimental conditions. (L) Relative expression of Tnfrsf9. (M) Left, UMAP plot colored by transcriptional clusters of interest. Center and right, projection of the indicated anti-CD137-treated CD8+ T cells over UMAP coordinates. Data are presented as mean ± SEM from at least 2 independent experiments. Each symbol represents an individual mouse. *p < 0.05; **p < 0.01, ***p < 0.001 (Student’s t test or ANOVA with Tukey’s post-test analysis).
Figure 3.
Figure 3.. CD137 promotes Tex cell expansion and differentiation
(A–D) Naive WT mice were treated with anti-CD137 (3H3, 10 μg) or IgG control mAbs. (A) Experimental design. (B–D) FACS plot and graphs showing Ki-67 expression by the indicated CD8+ T cell subsets along treatment. (E and F) The indicated CD45.1 CD8+ T cell subsets were injected i.v. into Cd137−/− mice that were treated with anti-CD137 or IgG. (E) Experimental design. (F) FACS plot and graphs showing the frequency of CD45.1+ CD8+ T cells after 14 days. (G–K) WT mice were injected with anti-CD137 or IgG. The indicated splenic CD8+ T cell subsets were analyzed by scRNA-seq (n = 5–10 pooled mice/group). (G) Experimental design. (H and I) UMAP (H) and bar plots (I) showing CD8+ T cell cluster distribution. (J) Relative expression of Tnfrsf9. (K) Clustered heatmap showing the indicated signature expression (1: Miller et al.; 2: Siddiqui et al.; 3: Utzschneider et al.; 4: Giles et al.). Data are scaled rowwise. (L) Clustered heatmap showing the 280 differentially expressed genes between Tex-like cells treated with anti-CD137 or Ig (log2FC > 0.25). (M–P) The indicated CD8+ T cell subsets isolated from WT mice treated with anti-CD137 were injected i.v. into Rag2−/−Il2rg−/− mice treated with anti-CD137 or IgG. (M) Experimental design. (N) FACS plots and numbers of CD8+ T cells recovered after 7 days. (O) FACS plots and graphs showing PD1 and Tim3 expression and numbers. (P) Frequency of CD8+ T cells with a Tmem (CD44hiPD1), Tpex (PD1+TCF1+Tim3), or TermTex (PD1+TCF1Tim3+) cell phenotype. Data are presented as mean ± SEM from at least 2 independent experiments. Each symbol represents an individual mouse. *p < 0.05; **p < 0.01, ***p < 0.001 (paired t test or ANOVA with Tukey’s post-test analysis).
Figure 4.
Figure 4.. CD137-induced Tex cell expansion does not require TCR/calcineurin signaling pathway
(A and B) WT CD8+ T cells were transferred into B2m−/− mice subsequently treated with anti-CD137 (10 μg; 3H3, i.p. twice a week) or Ig mAbs. (A) Experimental design. (B) Frequency of splenic PD1+Tim3+ CD8+ Tem cells. (C) WT mice were treated with cyclosporin A or FK506 in combination with anti-CD137 or Ig. Frequency of Tim3+PD1+ or Tox+ CD8+Tem cells. (D) Nur77GFP mice were treated with anti-CD137 or IgG for the indicated period. Expression of GFP by CD8+ Tem cells after 1, 7, and 14 days of treatment or upon 24 h of anti-CD3+CD28 in vitro. (E) Shannon entropy-based expansion score of clusters from Figure 3H. Color of the dots indicates the intensity of the score and size the number of cells. (F) Frequency of CD8+ T cells according to their expansion between subsets and treatments. Each dot represents a resampling of the original dataset equivalent to 90% of the smallest treatment-subset sample. (G and H) Clonal overlap between the main Tpex and Tex clusters. Circos plots (G) and Morisita index (H). Data are presented as mean ± SEM from at least 2 independent experiments. Each symbol represents an individual mouse. *p < 0.05; **p < 0.01, ***p < 0.001 (Mann-Whitney or ANOVA with Tukey’s post-test analysis).
Figure 5.
Figure 5.. T cell-intrinsic CD137-induced canonical NF-κB signaling drives T cell exhaustion
(A–D) Cd4creCd137fl/flROSA26tomato (tomato+) and Cd137fl/flROSA26tomato (tomato) mixed BM chimeras were treated with anti-CD137 (10 μg; 3H3, i.p. twice a week) or IgG control mAbs. (A) Experimental design. (B) Ratio of tomato and tomato+ among splenic CD8+ T cells. (C) Frequency and absolute number of CD8+ T cells. (D) Frequency of CD8+ T cells expressing the indicated markers. (E) Frequency of splenic PD1+Tim3+ CD8+ Tem cells in Traf1−/− and WT mice treated with anti-CD137 or IgG control for 18 days. (F and G) Frequency of splenic PD1+Tim3+ CD8+ Tem cells in Cd4cre+/− control mice and Cd4cre+/− crossed with Relafl/fl, Relfl/fl, Relbfl/fl, or Nfkb2fl/fl mice treated with anti-CD137 or IgG for 18 days. (H–J) scRNA-seq as in Figure 2F. (H) Relative expression of NF-κB target gene signature. (I) In silico gating of PD1Tim3 double-negative (DN), PD1+ simple-positive (SP), and PD1+Tim3+ double-positive (DP) cells and their numbers in the different Ig or anti-CD137 conditions. (J) Relative expression of the NF-κB target gene signature. (K) UMAP and violin plot comparing NF-κB target gene signature in CD8+ T cell subsets as in Figure 3H. (L) Violin plot comparing NF-κB target gene signatures in Cd137−/− and Cd137+/+ CD8+ T cell subsets as in Figure 1E. Data are presented as mean ± SEM from at least 2 independent experiments. Each symbol represents an individual mouse. *p < 0.05; **p < 0.01, ***p < 0.001 (Mann-Whitney, paired t test or ANOVA with Tukey’s post-test analysis).
Figure 6.
Figure 6.. Anti-CD137 drives early epigenetic remodeling of Tex-cell-associated genes
(A–D) WT mice were treated with anti-CD137 (3H3, 10 μg) or IgG control mAb for 5 or 18 days and splenic CD44hi CD8+ T cell chromatin states was determined through ATAC-seq. Data from 4 mice for each condition. (A) PCA of ATAC signal on peaks detected in all conditions. (B) Venn diagram showing up and down differentially accessible regions (DARs) from the indicated pairwise comparisons. (log2FC > 2 and adj p < 0.01.) (C) ATAC signals around up and down DARs (−1.5 kb +1.5 kb) for each sample. (D) GSEA between the indicated signatures and the day 18 anti-CD137 condition. (E) Heatmap showing log-normalized ATAC-seq signal in the peaks overlapping the indicated Tex cell subset’s genes as in Figure 2J. (F) ATAC signals across the Pdcd1, Lag3, and Havcr2 loci. Previously described Tex-specific peaks are highlighted in gray. (G) Graph showing the transcription factor (TF) that account for the variability in chromatin accessibility between anti-CD137 and Ig conditions identified using chromVar package. (H) Heatmap showing for each TF the deviation score in each sample calculated with chromVar. Only TF with a variability >10 and an adj p < 0.01 were selected. (I) Cd4cre Cd137fl/fl (Cd137−/−) and Cd45.1 (Cd137+/+) mixed BM chimera were injected s.c. with B16K1 melanoma cells. Expression of Tox on tumor-infiltrating CD8+ memory T cells. (J and K) CD45.1 CRISPR-Cas9 control and CD45.2 CRISP-Cas9 Tox-deficient CD8+ T cells were injected i.v. into Rag2−/−Il2rg−/− mice. After 7 days, mice were treated with anti-CD137 (10 μg; 3H3, i.p. twice a week) or IgG. (J) Experimental design. (K) Expression of the indicated markers on splenic CD8+ T cells. Data are presented as mean ± SEM from at least 2 independent experiments. Each symbol represents an individual mouse. *p < 0.05; **p < 0.01, ***p < 0.001 (paired t test).
Figure 7.
Figure 7.. Contrasting effect of anti-CD137 on immune surveillance and anti-PD1 efficacy
(A and B) C57BL/6 WT mice were treated with anti-CD137 (10 μg; 3H3, i.p. twice a week) or control IgG for the indicated period. Experimental design (A) and tumor volumes (B). (n = 5/group). (C and D) Spleen Tmem and Tex cells were FACS sorted from OT-1 mice treated with anti-CD137 (100 μg; 3H3, i.p. twice a week) for 18 days and transferred into Rag2−/−Il2rg−/− mice subsequently injected with B16-ova tumor cells. (C) Experimental design. (D) Tumor area and survival of the indicated groups of mice. (n = 5 mice per group from one experiment.) (E–G) C57BL/6 WT mice were injected with B16K1 (F) or B16-ova (G) and were treated from day 9 with IgG control, anti-CD137 (10 μg; 3H3, i.p. twice a week), anti-PD1 (250 μg i.p., RMP1–14) or both. (E) Experimental design. (F and G) Tumor area and survival of the indicated groups of mice. (n = 10–15/group). Unless otherwise specified, data are presented as mean ± SEM from at least 2 independent experiments. Each symbol represents an individual mouse. *p < 0.05; **p < 0.01, ***p < 0.001 (Mann-Whitney, Mantel-Cox log rank or ANOVA with Tukey’s post-test analysis).

References

    1. Wherry EJ, and Kurachi M. (2015). Molecular and cellular insights into T cell exhaustion. Nat. Rev. Immunol 15, 486–499. 10.1038/nri3862. - DOI - PMC - PubMed
    1. Pauken KE, Sammons MA, Odorizzi PM, Manne S, Godec J, Khan O, Drake AM, Chen Z, Sen DR, Kurachi M, et al. (2016). Epigenetic stability of exhausted T cells limits durability of reinvigoration by PD-1 blockade. Science 354, 1160–1165. 10.1126/science.aaf2807. - DOI - PMC - PubMed
    1. Philip M, Fairchild L, Sun L, Horste EL, Camara S, Shakiba M, Scott AC, Viale A, Lauer P, Merghoub T, et al. (2017). Chromatin states define tumour-specific T cell dysfunction and reprogramming. Nature 545, 452–456. 10.1038/nature22367. - DOI - PMC - PubMed
    1. Sen DR, Kaminski J, Barnitz RA, Kurachi M, Gerdemann U, Yates KB, Tsao HW, Godec J, LaFleur MW, Brown FD, et al. (2016). The epigenetic landscape of T cell exhaustion. Science 354, 1165–1169. 10.1126/science.aae0491. - DOI - PMC - PubMed
    1. Thommen DS, and Schumacher TN (2018). T cell dysfunction in cancer. Cancer Cell 33, 547–562. 10.1016/j.ccell.2018.03.012. - DOI - PMC - PubMed

Publication types

Substances