

Deficiency of the metabolic enzyme SCHAD in pancreatic β-cells promotes amino acid-sensitive hypoglycemia
- PMID: 37392854
- PMCID: PMC10407745
- DOI: 10.1016/j.jbc.2023.104986
Deficiency of the metabolic enzyme SCHAD in pancreatic β-cells promotes amino acid-sensitive hypoglycemia
Abstract
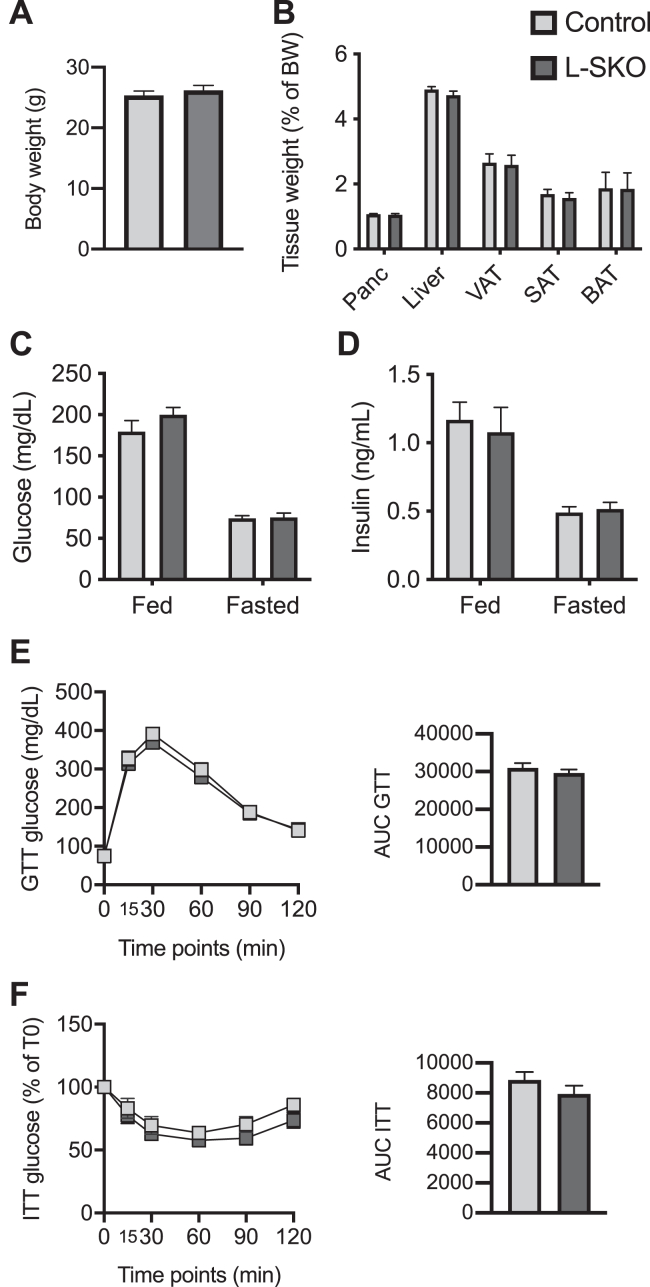
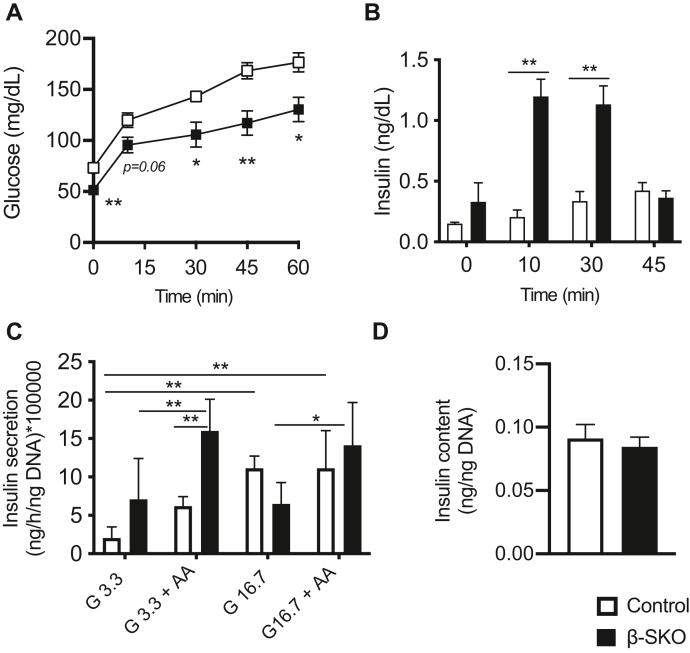
Congenital hyperinsulinism of infancy (CHI) can be caused by a deficiency of the ubiquitously expressed enzyme short-chain 3-hydroxyacyl-CoA dehydrogenase (SCHAD). To test the hypothesis that SCHAD-CHI arises from a specific defect in pancreatic β-cells, we created genetically engineered β-cell-specific (β-SKO) or hepatocyte-specific (L-SKO) SCHAD knockout mice. While L-SKO mice were normoglycemic, plasma glucose in β-SKO animals was significantly reduced in the random-fed state, after overnight fasting, and following refeeding. The hypoglycemic phenotype was exacerbated when the mice were fed a diet enriched in leucine, glutamine, and alanine. Intraperitoneal injection of these three amino acids led to a rapid elevation in insulin levels in β-SKO mice compared to controls. Consistently, treating isolated β-SKO islets with the amino acid mixture potently enhanced insulin secretion compared to controls in a low-glucose environment. RNA sequencing of β-SKO islets revealed reduced transcription of β-cell identity genes and upregulation of genes involved in oxidative phosphorylation, protein metabolism, and Ca2+ handling. The β-SKO mouse offers a useful model to interrogate the intra-islet heterogeneity of amino acid sensing given the very variable expression levels of SCHAD within different hormonal cells, with high levels in β- and δ-cells and virtually absent α-cell expression. We conclude that the lack of SCHAD protein in β-cells results in a hypoglycemic phenotype characterized by increased sensitivity to amino acid-stimulated insulin secretion and loss of β-cell identity.
Keywords: HADH; SCHAD; amino acids; congenital hyperinsulinism of infancy; hypoglycemia; insulin secretion; islets; knockout mouse model; short-chain 3-hydroxyacyl-CoA dehydrogenase; transcriptomics; β-cell; β-cell dedifferentiation.
Copyright © 2023 The Authors. Published by Elsevier Inc. All rights reserved.
Conflict of interest statement
Conflict of interest The authors declare that they have no conflicts of interest with the contents of this article.
Figures


Similar articles
-
The Hypoglycemic Phenotype Is Islet Cell-Autonomous in Short-Chain Hydroxyacyl-CoA Dehydrogenase-Deficient Mice.Diabetes. 2016 Jun;65(6):1672-8. doi: 10.2337/db15-1475. Epub 2016 Mar 7. Diabetes. 2016. PMID: 26953163 Free PMC article.
-
Mechanism of hyperinsulinism in short-chain 3-hydroxyacyl-CoA dehydrogenase deficiency involves activation of glutamate dehydrogenase.J Biol Chem. 2010 Oct 8;285(41):31806-18. doi: 10.1074/jbc.M110.123638. Epub 2010 Jul 29. J Biol Chem. 2010. PMID: 20670938 Free PMC article.
-
METRNL represses beta-to-alpha cell trans-differentiation to maintain beta cell function under diabetic metabolic stress in mice.Diabetologia. 2025 Aug;68(8):1769-1788. doi: 10.1007/s00125-025-06459-7. Epub 2025 Jun 10. Diabetologia. 2025. PMID: 40495021
-
Type 1 Diabetes: A Guide to Autoimmune Mechanisms for Clinicians.Diabetes Obes Metab. 2025 Aug;27 Suppl 6(Suppl 6):40-56. doi: 10.1111/dom.16460. Epub 2025 May 15. Diabetes Obes Metab. 2025. PMID: 40375390 Free PMC article. Review.
-
Very Long-Chain Acyl-Coenzyme A Dehydrogenase Deficiency.2009 May 28 [updated 2025 Aug 7]. In: Adam MP, Feldman J, Mirzaa GM, Pagon RA, Wallace SE, Amemiya A, editors. GeneReviews® [Internet]. Seattle (WA): University of Washington, Seattle; 1993–2025. 2009 May 28 [updated 2025 Aug 7]. In: Adam MP, Feldman J, Mirzaa GM, Pagon RA, Wallace SE, Amemiya A, editors. GeneReviews® [Internet]. Seattle (WA): University of Washington, Seattle; 1993–2025. PMID: 20301763 Free Books & Documents. Review.
Cited by
-
Searching for protein partners of short-chain 3-hydroxyacyl-CoA dehydrogenase (SCHAD) reveals keratin 8 as a novel candidate for interaction in pancreatic β-cells.BMC Mol Cell Biol. 2025 Jun 5;26(1):18. doi: 10.1186/s12860-025-00544-w. BMC Mol Cell Biol. 2025. PMID: 40474078 Free PMC article.
References
-
- Molven A., Matre G.E., Duran M., Wanders R.J., Rishaug U., Njølstad P.R., et al. Familial hyperinsulinemic hypoglycemia caused by a defect in the SCHAD enzyme of mitochondrial fatty acid oxidation. Diabetes. 2004;53:221–227. - PubMed
Publication types
MeSH terms
Substances
Grants and funding
LinkOut - more resources
Full Text Sources
Medical
Molecular Biology Databases
Miscellaneous
