

Cardiac output and arteriovenous oxygen difference contribute to lower peak oxygen uptake in patients with fibromyalgia
- PMID: 37393269
- PMCID: PMC10314615
- DOI: 10.1186/s12891-023-06589-2
Cardiac output and arteriovenous oxygen difference contribute to lower peak oxygen uptake in patients with fibromyalgia
Abstract
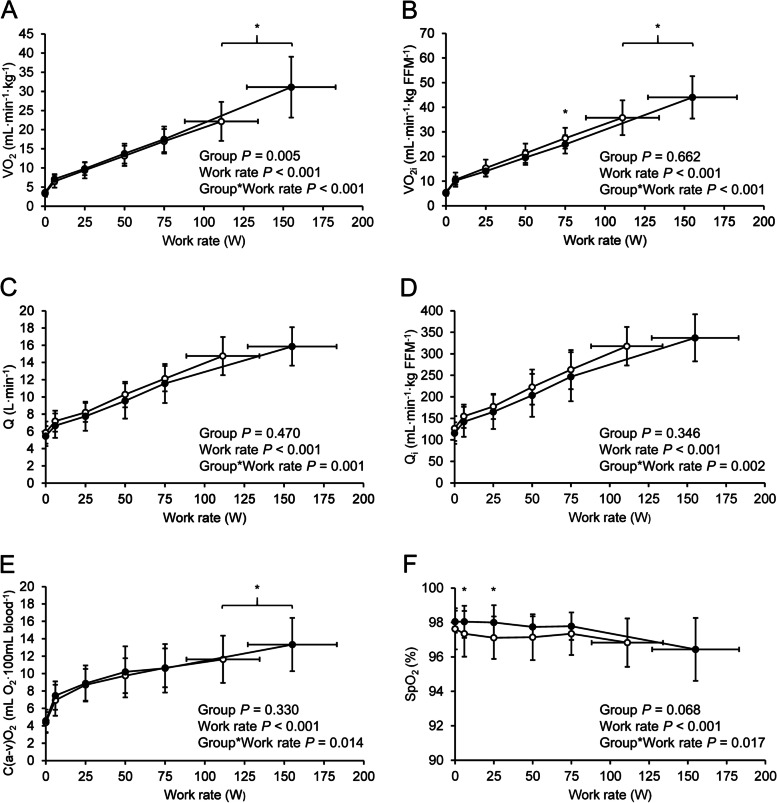
Background: Patients with fibromyalgia (FM) exhibit low peak oxygen uptake ([Formula: see text]O2peak). We aimed to detect the contribution of cardiac output to ([Formula: see text]) and arteriovenous oxygen difference [Formula: see text] to [Formula: see text] from rest to peak exercise in patients with FM.
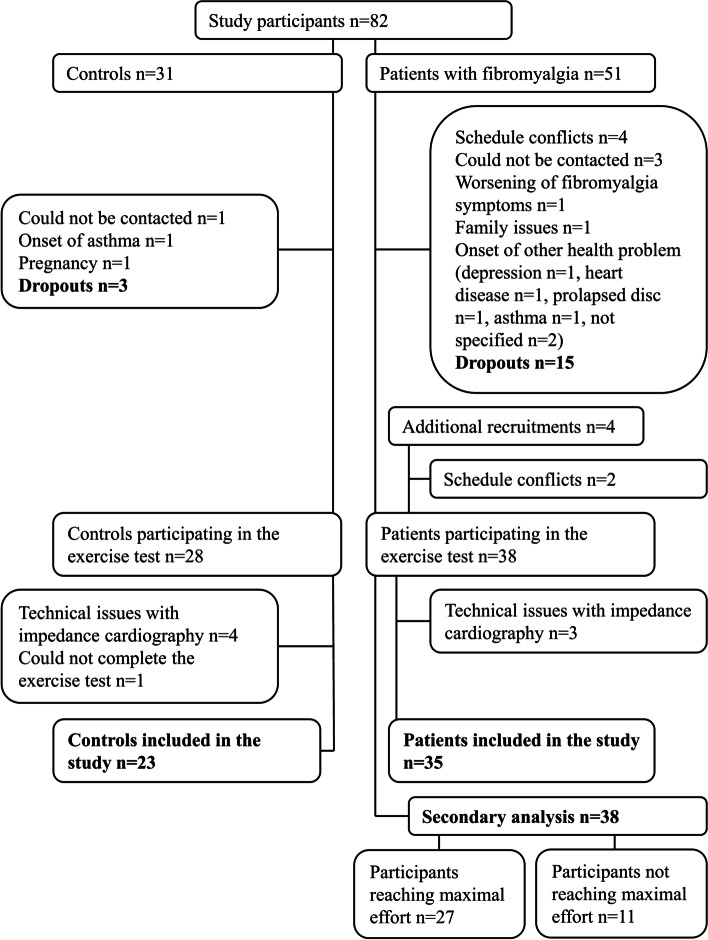
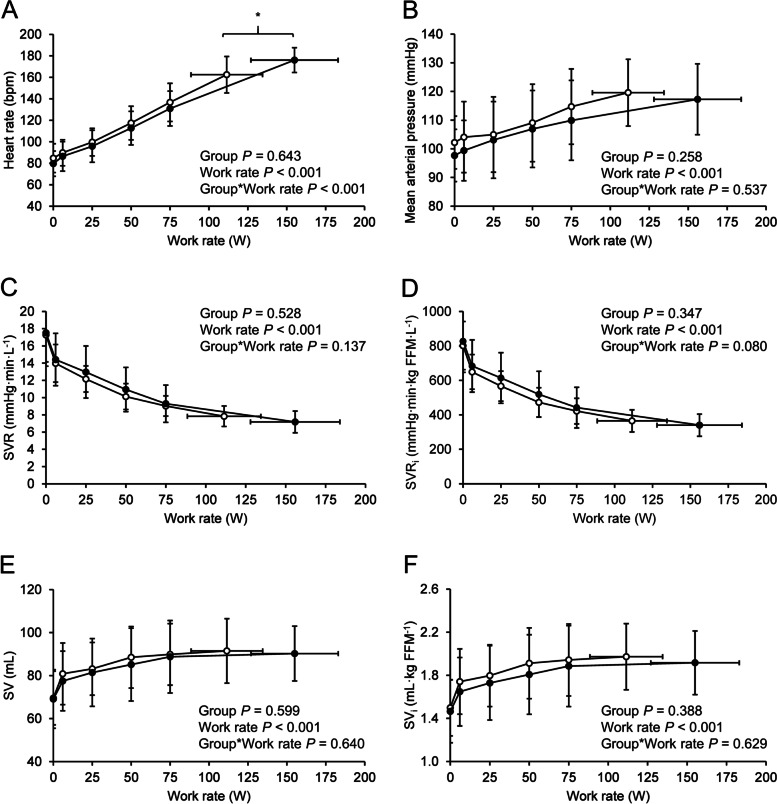
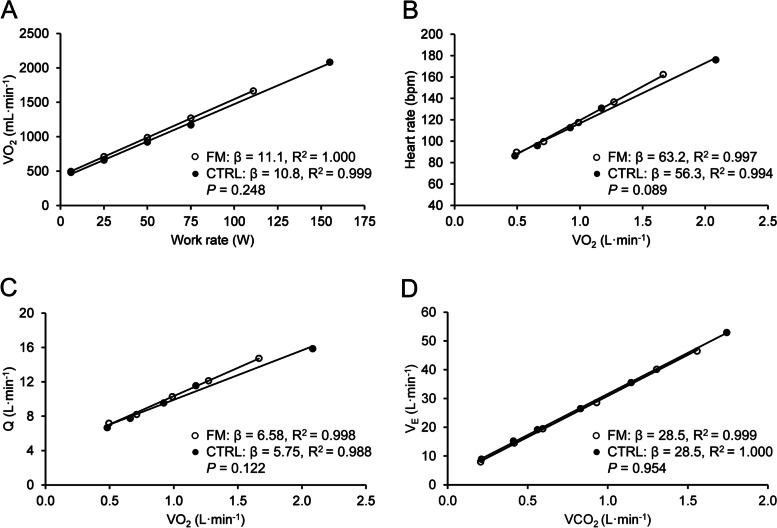
Methods: Thirty-five women with FM, aged 23 to 65 years, and 23 healthy controls performed a step incremental cycle ergometer test until volitional fatigue. Alveolar gas exchange and pulmonary ventilation were measured breath-by-breath and adjusted for fat-free body mass (FFM) where appropriate. [Formula: see text] (impedance cardiography) was monitored. [Formula: see text] was calculated using Fick's equation. Linear regression slopes for oxygen cost (∆[Formula: see text]O2/∆work rate) and [Formula: see text] to [Formula: see text]O2 (∆[Formula: see text]/∆[Formula: see text]O2) were calculated. Normally distributed data were reported as mean ± SD and non-normal data as median [interquartile range].
Results: [Formula: see text]O2peak was lower in FM patients than in controls (22.2 ± 5.1 vs. 31.1 ± 7.9 mL∙min-1∙kg-1, P < 0.001; 35.7 ± 7.1 vs. 44.0 ± 8.6 mL∙min-1∙kg FFM-1, P < 0.001). [Formula: see text] and C(a-v)O2 were similar between groups at submaximal work rates, but peak [Formula: see text] (14.17 [13.34-16.03] vs. 16.06 [15.24-16.99] L∙min-1, P = 0.005) and C(a-v)O2 (11.6 ± 2.7 vs. 13.3 ± 3.1 mL O2∙100 mL blood-1, P = 0.031) were lower in the FM group. No significant group differences emerged in ∆[Formula: see text]O2/∆work rate (11.1 vs. 10.8 mL∙min-1∙W-1, P = 0.248) or ∆[Formula: see text]/∆[Formula: see text]O2 (6.58 vs. 5.75, P = 0.122) slopes.
Conclusions: Both [Formula: see text] and C(a-v)O2 contribute to lower [Formula: see text]O2peak in FM. The exercise responses were normal and not suggestive of a muscle metabolism pathology.
Trial registration: ClinicalTrials.gov, NCT03300635. Registered 3 October 2017-Retrospectively registered. https://clinicaltrials.gov/ct2/show/NCT03300635 .
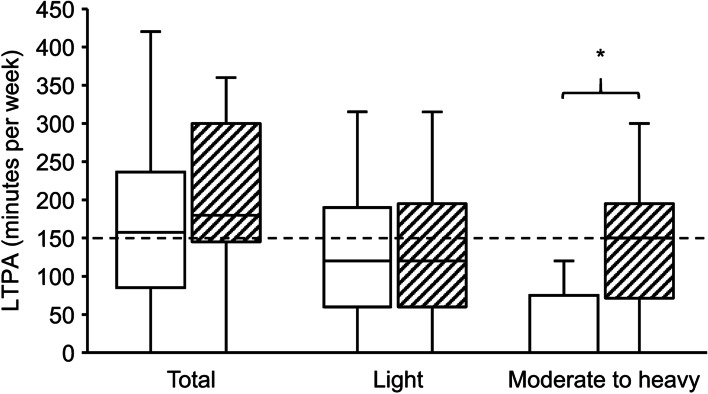
Keywords: Cardiopulmonary exercise test; Impedance cardiography; Leisure-time physical activity; Oxygen cost; Ventilatory threshold.
© 2023. The Author(s).
Conflict of interest statement
Eija Kalso serves on the advisory boards of Orion Pharma and Pfizer and has received a lecture fee, unrelated to this work, from GSK. Ritva Markkula has received lecture fees, unrelated to this work, from Oy Eli Lilly Finland Ab. The other authors have no potential conflicts of interest to declare.
Figures
References
Publication types
MeSH terms
Substances
Associated data
Grants and funding
LinkOut - more resources
Full Text Sources
Medical
