. 2023 Jul 25;42(7):112725.
doi: 10.1016/j.celrep.2023.112725. Epub 2023 Jul 1.

Super-resolution imaging unveils the self-replication of tau aggregates upon seeding

Affiliations

Super-resolution imaging unveils the self-replication of tau aggregates upon seeding

Eleni Dimou et al. Cell Rep. .

Abstract

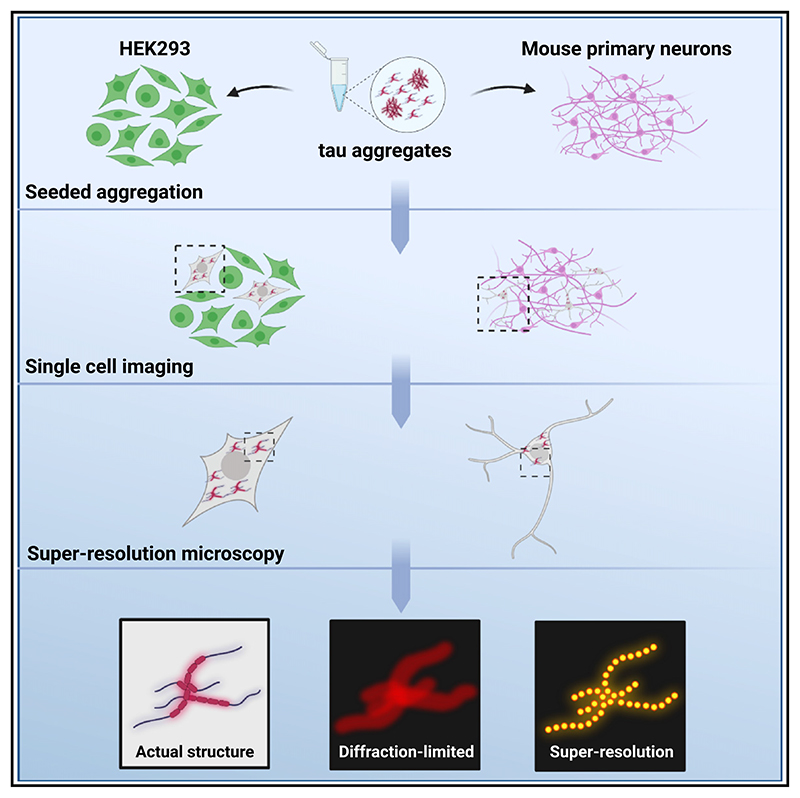
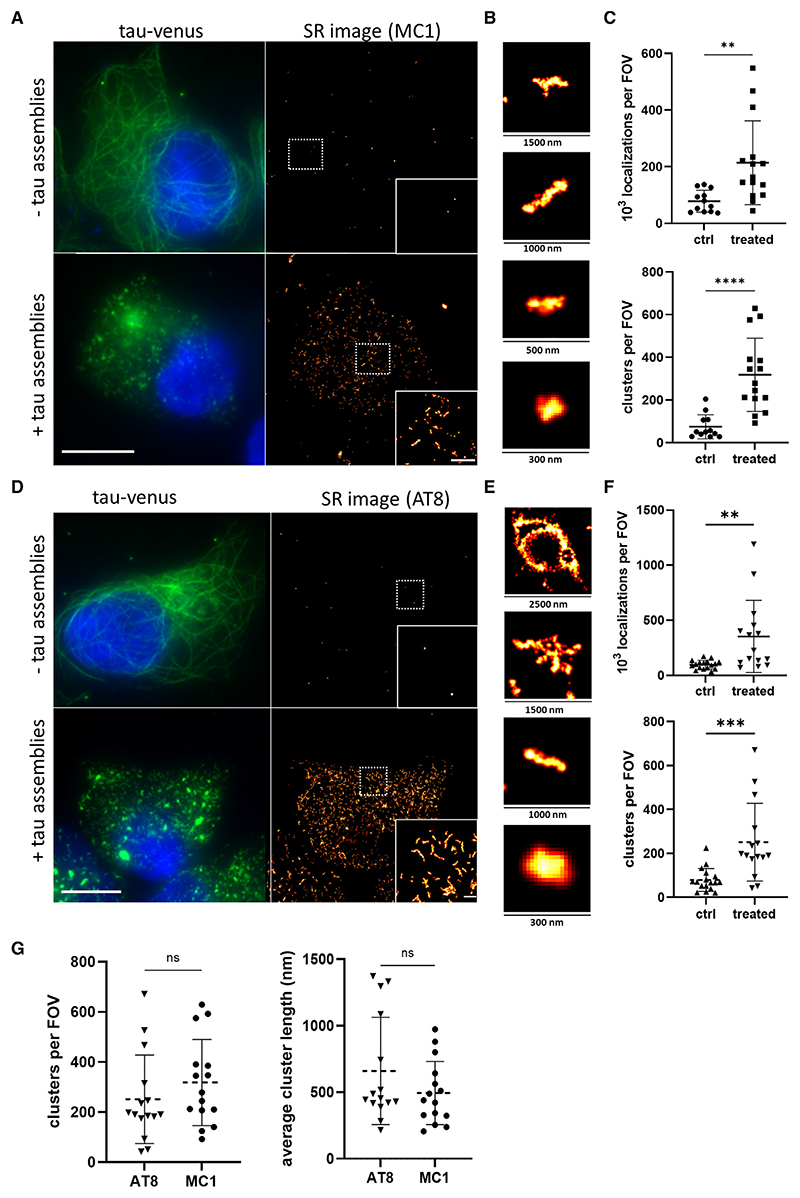
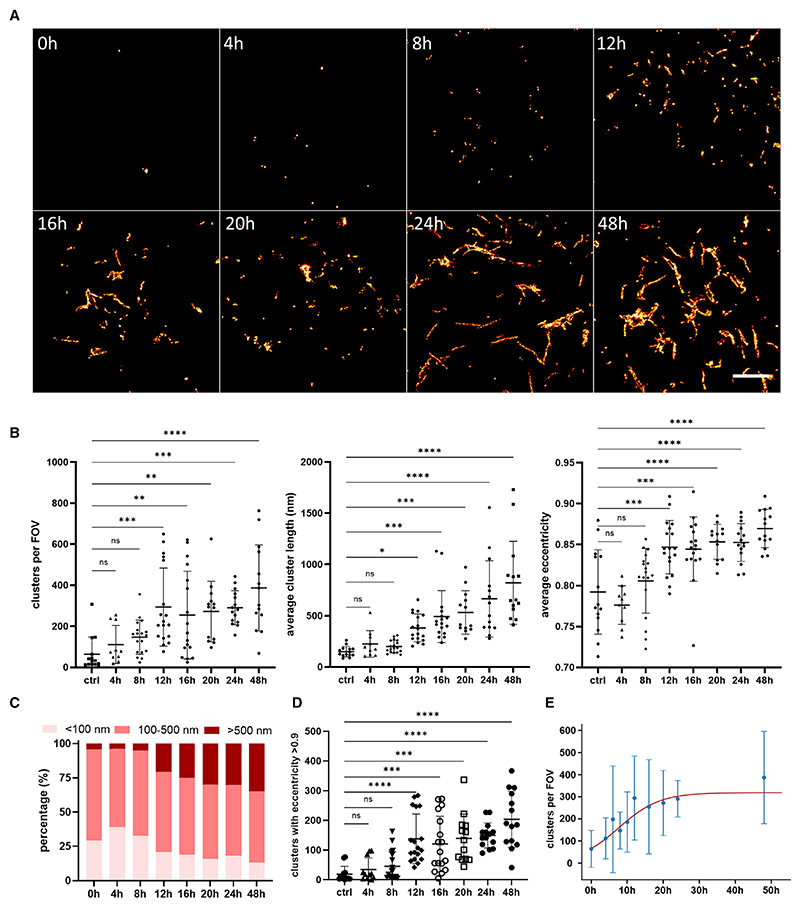
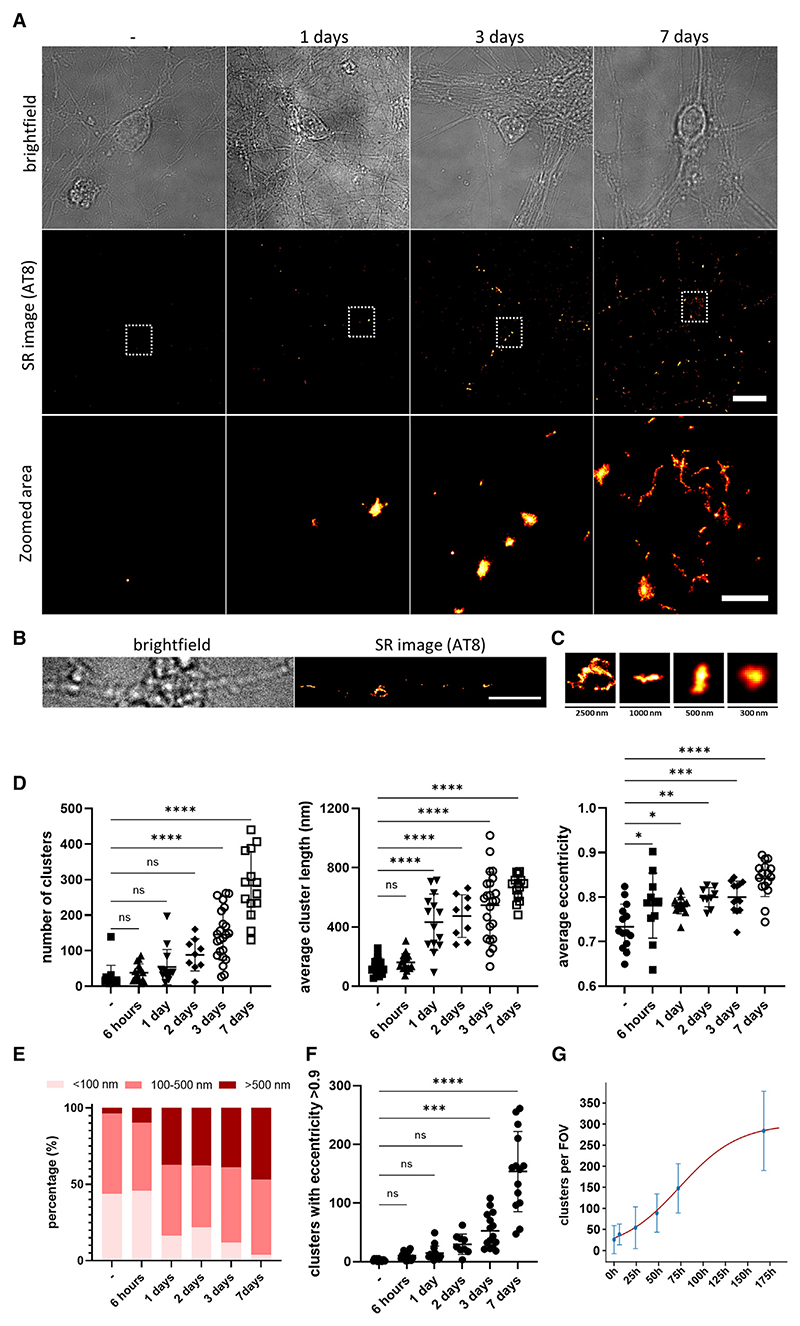
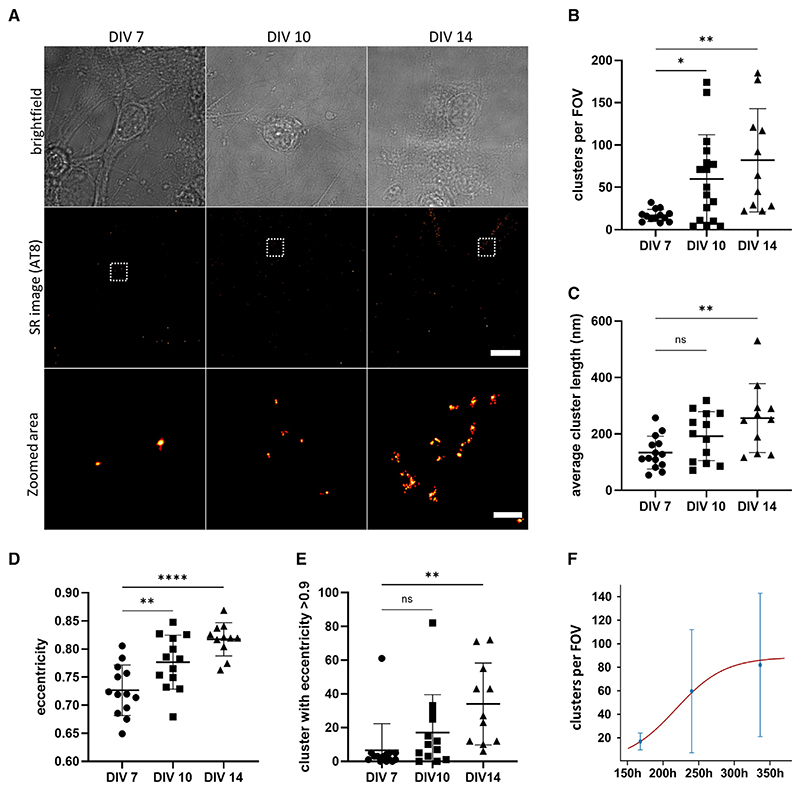
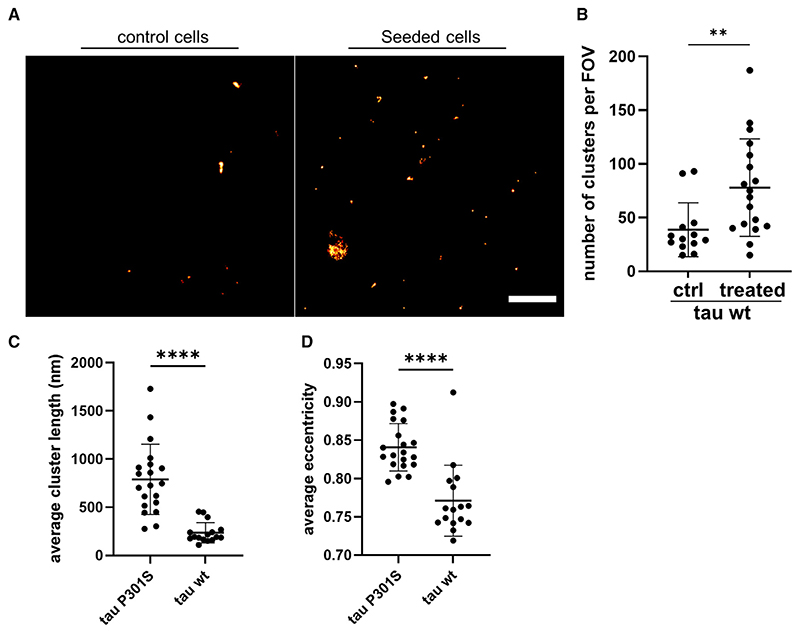
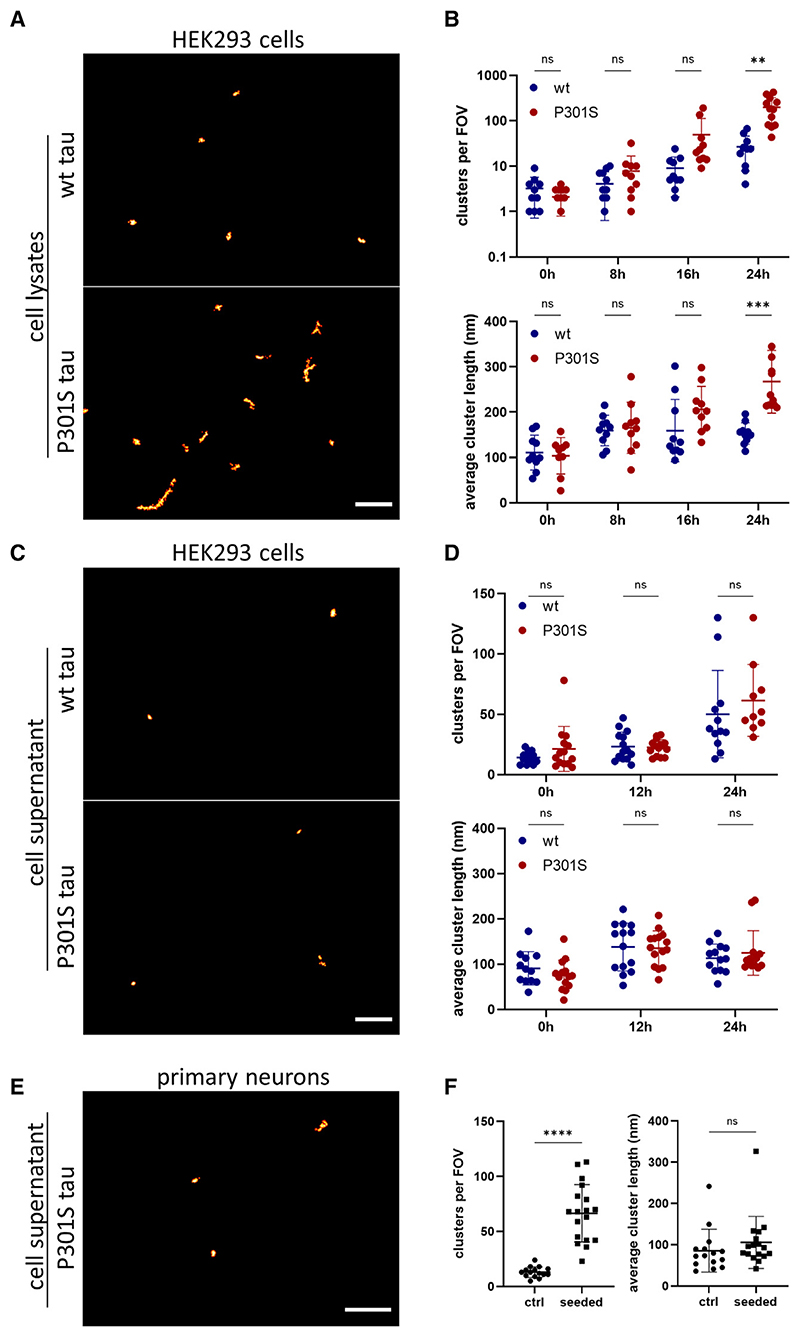
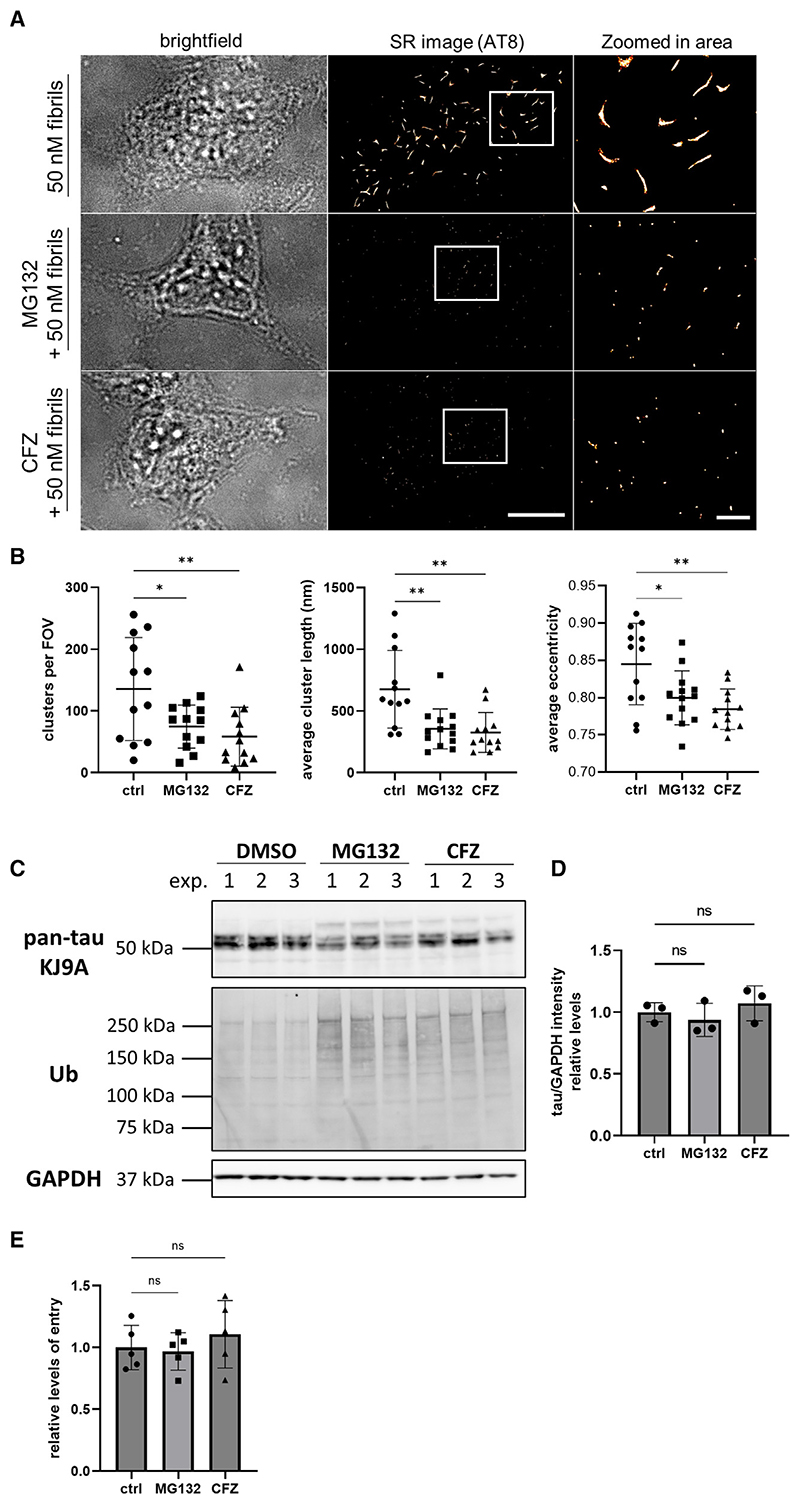
Tau is a soluble protein interacting with tubulin to stabilize microtubules. However, under pathological conditions, it becomes hyperphosphorylated and aggregates, a process that can be induced by treating cells with exogenously added tau fibrils. Here, we employ single-molecule localization microscopy to resolve the aggregate species formed in early stages of seeded tau aggregation. We report that entry of sufficient tau assemblies into the cytosol induces the self-replication of small tau aggregates, with a doubling time of 5 h inside HEK cells and 1 day in murine primary neurons, which then grow into fibrils. Seeding occurs in the vicinity of the microtubule cytoskeleton, is accelerated by the proteasome, and results in release of small assemblies into the media. In the absence of seeding, cells still spontaneously form small aggregates at lower levels. Overall, our work provides a quantitative picture of the early stages of templated seeded tau aggregation in cells.

Keywords: Alzheimer’s disease; CP: Cell biology; neurodegeneration; protein aggregation; seeded aggregation; super-resolution microscopy; tau.


Conflict of interest statement

Declaration of interests G.M. is an employee of WaveBreak Therapeutics. E.D. is now an employee of AstraZeneca.

Figures

Graphic abstract
Graphic abstract
Figure 1
Figure 1. SR imaging of tau aggregates in HEK293 cells
(A) Diffraction-limited (left) and SR (right) images of HEK293 cells stably expressing P301S tau-Venus with and without 100 nM recombinant P301S tau fibrils treatment for 24 h. Fixed cells were imaged using Venus fluorescence (green) for the imaging of total tau, while tau aggregates were visualized by STORM using the MC1 antibody (hot-red). Scale bars, 10 μm (left) and 2 μm (right). (B) Examples of individual tau aggregates of different sizes. (C) Cells treated with tau assemblies were compared to control cells for the number of detected localizations and the number of detected tau assemblies. (D) Diffraction-limited (left) and SR (right) images of HEK293 cells expressing P301S tau-Venus with and without 100 nM recombinant P301S tau fibrils treatment for 24 h. Fixed cells were imaged using Venus fluorescence (green) for the imaging of total tau, while tau aggregates were visualized by STORM microscopy using the AT8 antibody (hot-red). Scale bars, 10 μm (left) and 2 μm (right). (E) Examples of individual tau aggregates of different sizes. (F) Cells treated with tau assemblies were compared to control cells for the number of detected localizations and the number of detected tau assemblies. (G) Comparison of the number of detected tau assemblies (derived from C and F) and their length as detected by the MC1 and the AT8 antibody. The plotted data represent mean values ±SD. An unpaired t test was used for statistical analysis (n.s., not significant; **p < 0.01, ***p < 0.001, ****p < 0.0001) (n > 15 cells per condition were imaged from three biological replicates). See also Figures S1-S3.
Figure 2
Figure 2. SR images reveal time-dependent replication of endogenous tau assemblies after treatment with tau assemblies
(A) HEK293 cells expressing untagged P301S tau were treated with 100 nM recombinant P301S tau fibrils. At defined time points, cells were fixed and immunostained with the AT8 antibody for dSTORM imaging. Representative SR images of a zoomed area in a cell are displayed. Scale bar, 3 μm. (B) The number of assemblies detected per FOV, as well as their length and average eccentricity, were analyzed and plotted. (C) The percentage of aggregates with length less than 100 nm or more than 500 nm was quantified. (D) The number of tau assemblies with an eccentricity higher than 0.9 was plotted. (E) Kineticanalysisoftheformation ofintracellularaggregates. Dataare shown as meanvalues(±SD) from (B), but all data points are used inthe fitting toaminimal model of replication. The statistical analysiswas based on a one-wayANOVAtest combined with Tukey’s post hoctest (n.s., not significant; *p < 0.05, **p < 0.01, ***p < 0.001, ****p < 0.0001) (n > 10 cells per condition were imaged from three biological replicates). See also Figures S3 and S4; Table S1.
Figure 3
Figure 3. Intracellular tau assemblies are formed upon treatment of primary cultures with recombinantly produced tau fibrils
(A) DIV 7 primary cultures derived from P301S tau transgenic mice were treated with 100 nM recombinantly produced tau fibrils. At defined time points, the cultures were fixed and immunostained with the AT8 antibody for dSTORM imaging. Scale bars, 10 μm (top) and 2 μm (bottom). (B) Representative bright-field and SR images of tau aggregates as detected in neuronal processes 3 days after treatment. Scale bar, 5 μm. (C) Representative examples of individual tau aggregates of different sizes from (B). (D) The number of assemblies detected per FOV as well as their lengths and average eccentricity were analyzed and plotted. (E) The percentage of aggregates with length less than 100 nm or more than 500 nm was quantified. (F) The number of tau assemblies with an eccentricity higher than 0.9 was plotted. (G) Kinetic analysis of the formation of intracellular aggregates. Data are shown as mean values (±SD) from(D),but all data points are used in the fitting to a minimal model of replication. The statistical analysis was based on a one-way ANOVA test combined with Tukey’s post hoc test (n.s., not significant; *p < 0.05,**p < 0.01, ***p < 0.001, ****p < 0.0001) (n > 9 FOVs per condition were imaged from three biological replicates). See also Figure S5 and Table S1.
Figure 4
Figure 4. Small tau assemblies are formed spontaneously in primary cultures derived from P301S tau transgenic mice
(A) Untreated DIV 7, 10, and 14 primary cultures derived from P301S tau transgenic mice were fixed and immunostained with the AT8 antibody for dSTORM imaging. Scale bars, 10 μm (top) and 2 μm (bottom). (B–D) The number of assemblies detected per FOV (B), their length (C), and their eccentricity (D) were analyzed and plotted. (E) The number of assemblies with eccentricity higher than 0.9 were quantified. (F) Kinetic analysis of the spontaneous formation of intracellular aggregates over time; data are shown as mean values (±SD) from (B), but all data points are used in the fitting to a minimal model of replication. The statistical analysis was based on a one-way ANOVA test combined with Tukey’s post hoc test (n.s., not significant; *p < 0.05, **p < 0.01, ****p < 0.0001) (n > 11 FOVs per condition were imaged from three biological replicates). See also Table S1.
Figure 5
Figure 5. Templated seeding characteristics of WT tau in cells
(A) HEK293 cells expressing untagged WT tau were imaged by dSTORM after treatment with 100 nM recombinant P301S tau fibrils for 24 h and subsequent immunolabeling with the AT8 antibody. Scale bar, 3 μm. (B) The number of formed assemblies were compared to mock-treated cells. (C and D) The average length of the formed clusters (C) as well as their eccentricity (D) were compared to cells expressing P301S tau after being treated under the same conditions. The plotted data represent mean values ±SD. The statistical analysis in (B), (C) and (D) was based on an unpaired t test (**p < 0.01, ****p < 0.0001) (n ≥ 13 cells per condition were imaged from three biological replicates).
Figure 6
Figure 6. DNA-PAINT on lysates and media from cells expressing P301S tau or WT tau upon treatment with recombinant P301S tau fibrils
(A-D) Representative images of HEK293 cell lysates (A) and cell supernatant (C) that were collected 24 h after treatment. The number of tau assemblies per FOV and their average length were followed over time and plotted for both lysates (B) and media (D). (E) Representative images of cell supernatant from primary neurons 7 days after treatment. (F) The number of tau assemblies per FOV and their average length plotted for control and seeded cells. Scale bars, 1 μm. The plotted data represent mean values of each experiment ±SD. The statistical analysis in (B) and (D) was based on a two-way ANOVA test, while an unpaired t test was performed for the data plotted in (F) (n.s., not significant; **p < 0.01, ***p < 0.001, ****p < 0.0001) (n = 3 biological replicates). See also Figure S6 and Table S1.
Figure 7
Figure 7. Proteasomal inhibition reduces the templated seeded aggregation of tau in HEK293 cells
(A) Representative bright-field and AT8-STORM images of HEK293 cells expressing P301S tau treated with 50 nM recombinant P301S tau fibrils in the presence of MG132 or carfilzomib (CFZ) for 16 h. Scale bars, 10 μm (left) and 2 μm (right). (B) The number of aggregates per FOV, the average length, and eccentricity of the clusters were quantified (n R 13 cells per condition were imaged from three biological replicates). (C) Western blot analysis of lysates from HEK293 cells expressing untagged P301S tau in the presence of proteasome inhibitors. The cell lysates were assessed for intracellular tau levels via the pan-tau KJ9A antibody as well as for the levels of ubiquitinated proteins, while GAPDH was used as loading control. (D) Quantification of intracellular tau levels upon normalization to GAPDH and subsequent comparison to the untreated control (n = 3). (E) The entry levels of 100 nM tau-HiBiT assemblies in cells expressing NLS-eGFP-LgBiT in the presence of lipofectamine for 4 h and the corresponding proteasomal inhibitors were quantified and then compared to the untreated control (n = 3). The plotted data represent mean values ±SD. The statistical analysis is based on a one-way ANOVA test combined with Tukey’s post hoc test (n.s., not significant; *p < 0.05,**p < 0.01). See also Figure S7.

References

    1. Prince M. Progress on dementia—leaving no one behind. Lancet. 2017;390:e51–e53. doi: 10.1016/S0140-6736(17)31757-9. - DOI - PubMed
    1. Duyckaerts C, Delatour B, Potier M-C. Classification and basic pathology of Alzheimer disease. Acta Neuropathol. 2009;118:5–36. doi: 10.1007/s00401-009-0532-1. - DOI - PubMed
    1. Goedert M. NEURODEGENERATION. Alzheimer’s and Parkinson’s diseases: The prion concept in relation to assembled Aβ, tau, and α-synuclein. Science. 2015;349:1255555. doi: 10.1126/science.1255555. - DOI - PubMed
    1. Weingarten MD, Lockwood AH, Hwo SY, Kirschner MW. A protein factor essential for microtubule assembly. Proc Natl Acad Sci USA. 1975;72:1858–1862. doi: 10.1073/pnas.72.5.1858. - DOI - PMC - PubMed
    1. Wang Y, Mandelkow E. Tau in physiology and pathology. Nat Rev Neurosci. 2016;17:5–21. doi: 10.1038/nrn.2015.1. - DOI - PubMed

Publication types