Case Reports
. 2023 Jul 29;402(10399):397-410.
doi: 10.1016/S0140-6736(23)00775-4. Epub 2023 Jun 29.

Graft dysfunction in compassionate use of genetically engineered pig-to-human cardiac xenotransplantation: a case report

Affiliations
Case Reports

Graft dysfunction in compassionate use of genetically engineered pig-to-human cardiac xenotransplantation: a case report

Muhammad M Mohiuddin et al. Lancet. .

Abstract

Background: A genetically engineered pig cardiac xenotransplantation was done on Jan 7, 2022, in a non-ambulatory male patient, aged 57 years, with end-stage heart failure, and on veno-arterial extracorporeal membrane oxygenation support, who was ineligible for an allograft. This report details our current understanding of factors important to the xenotransplantation outcome.

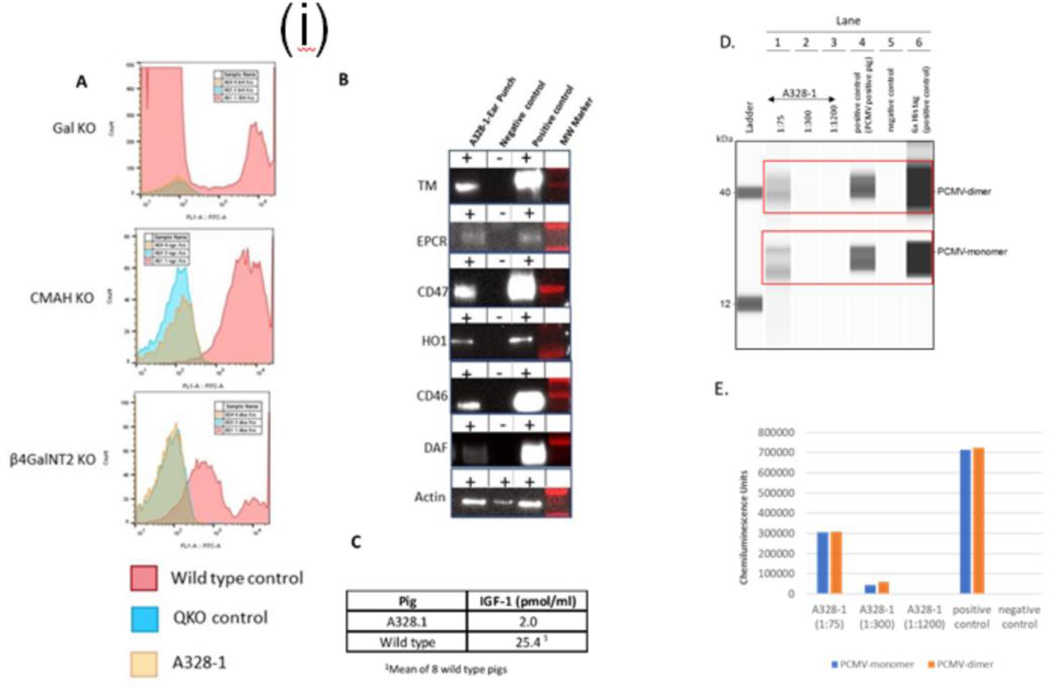
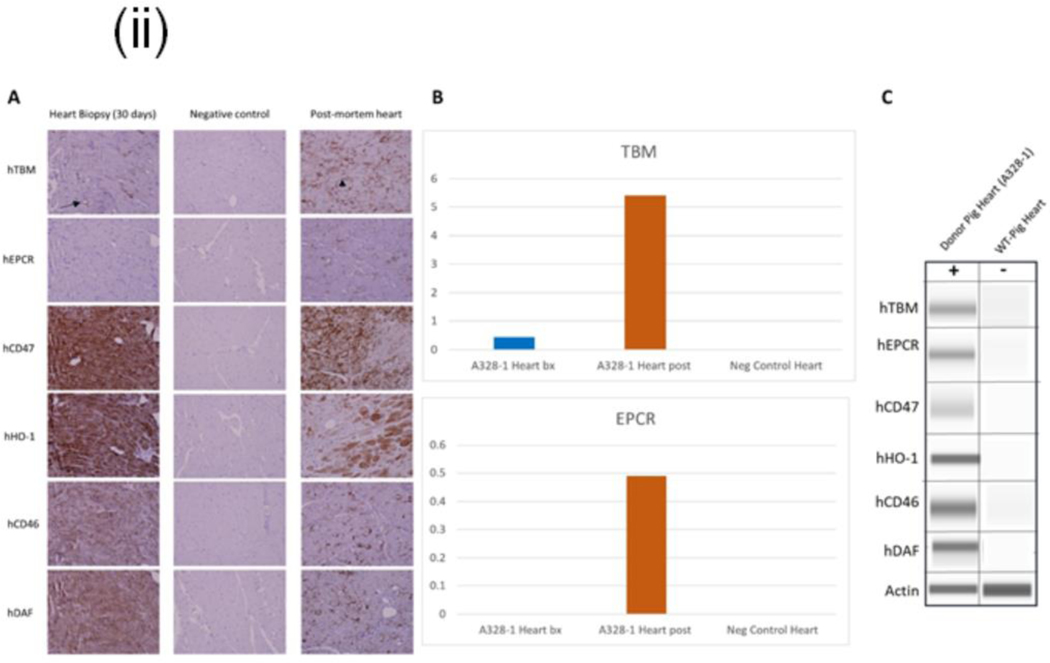
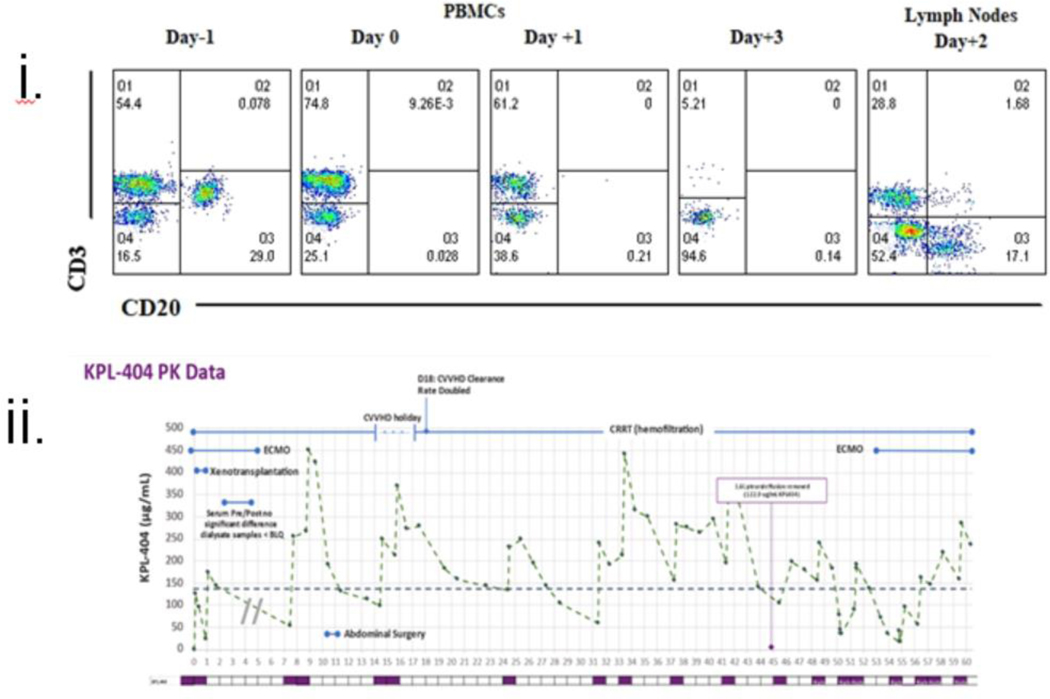
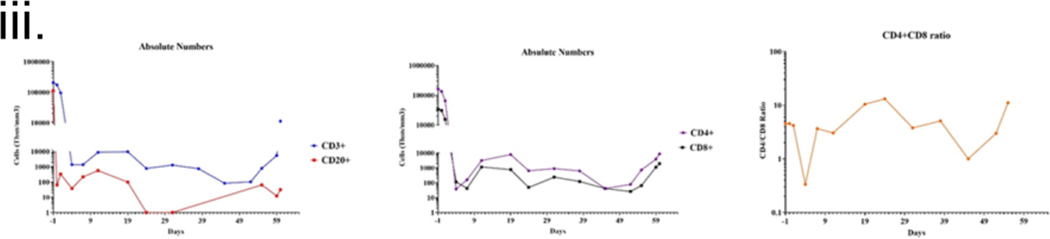
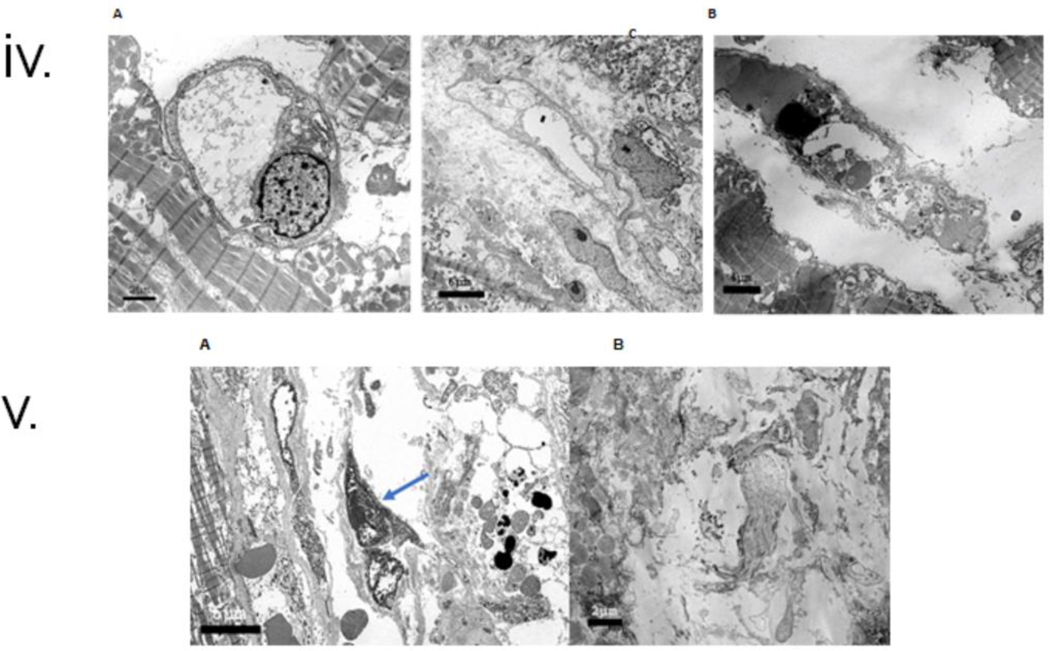
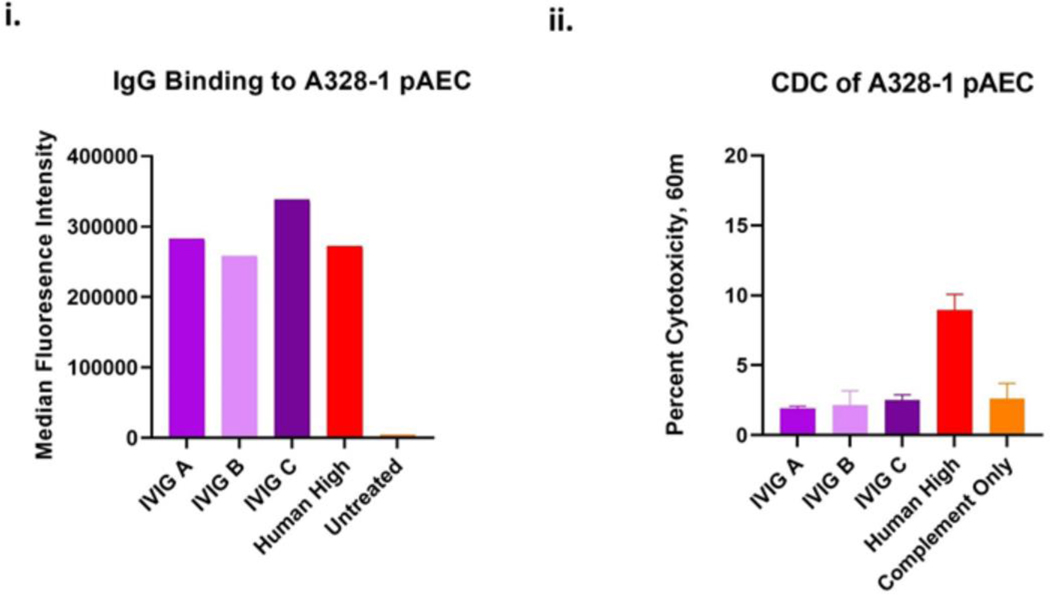
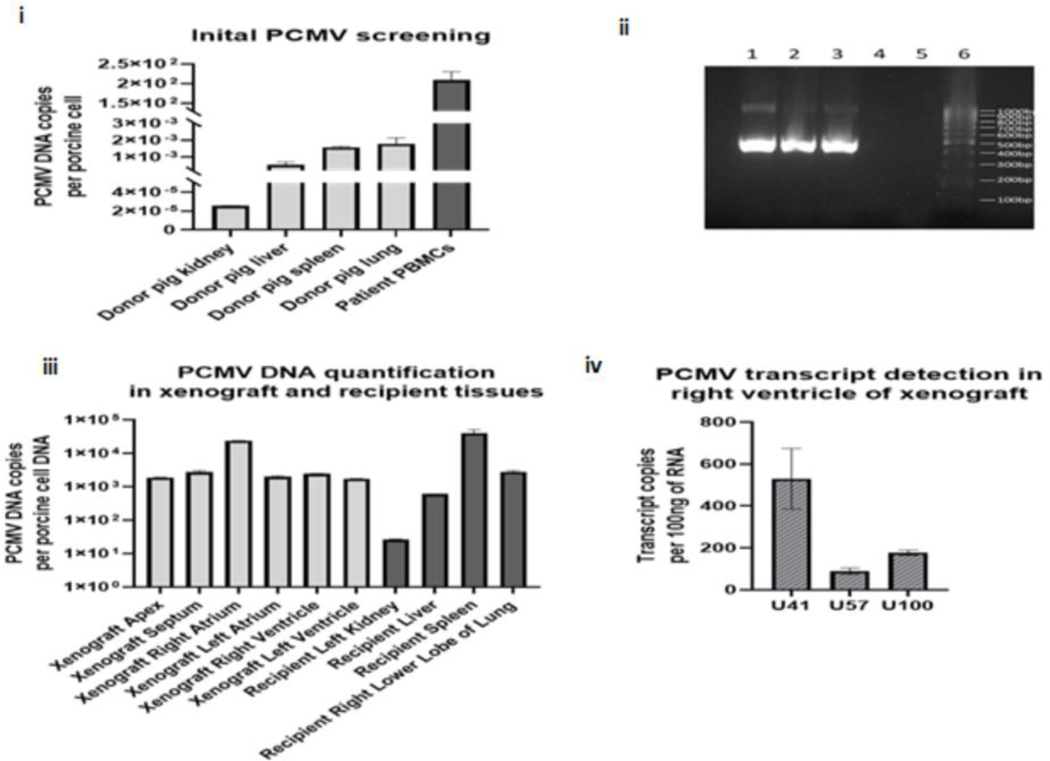
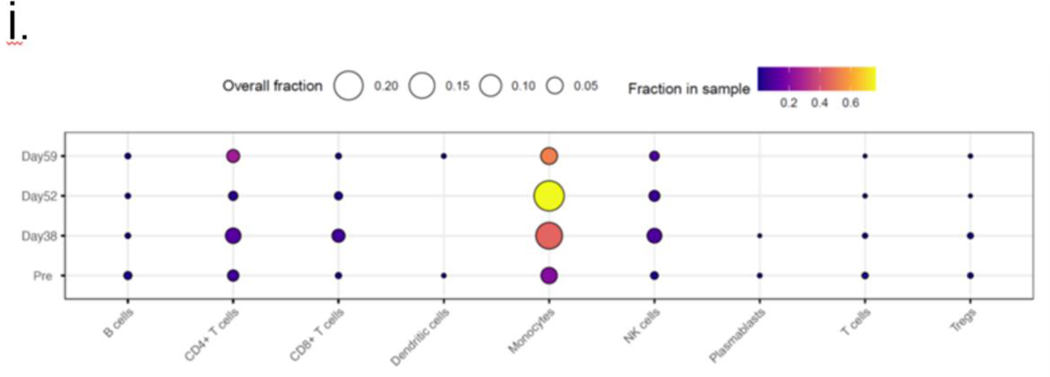
Methods: Physiological and biochemical parameters critical for the care of all heart transplant recipients were collected in extensive clinical monitoring in an intensive care unit. To ascertain the cause of xenograft dysfunction, we did extensive immunological and histopathological studies, including electron microscopy and quantification of porcine cytomegalovirus or porcine roseolovirus (PCMV/PRV) in the xenograft, recipient cells, and tissue by DNA PCR and RNA transcription. We performed intravenous immunoglobulin (IVIG) binding to donor cells and single-cell RNA sequencing of peripheral blood mononuclear cells.

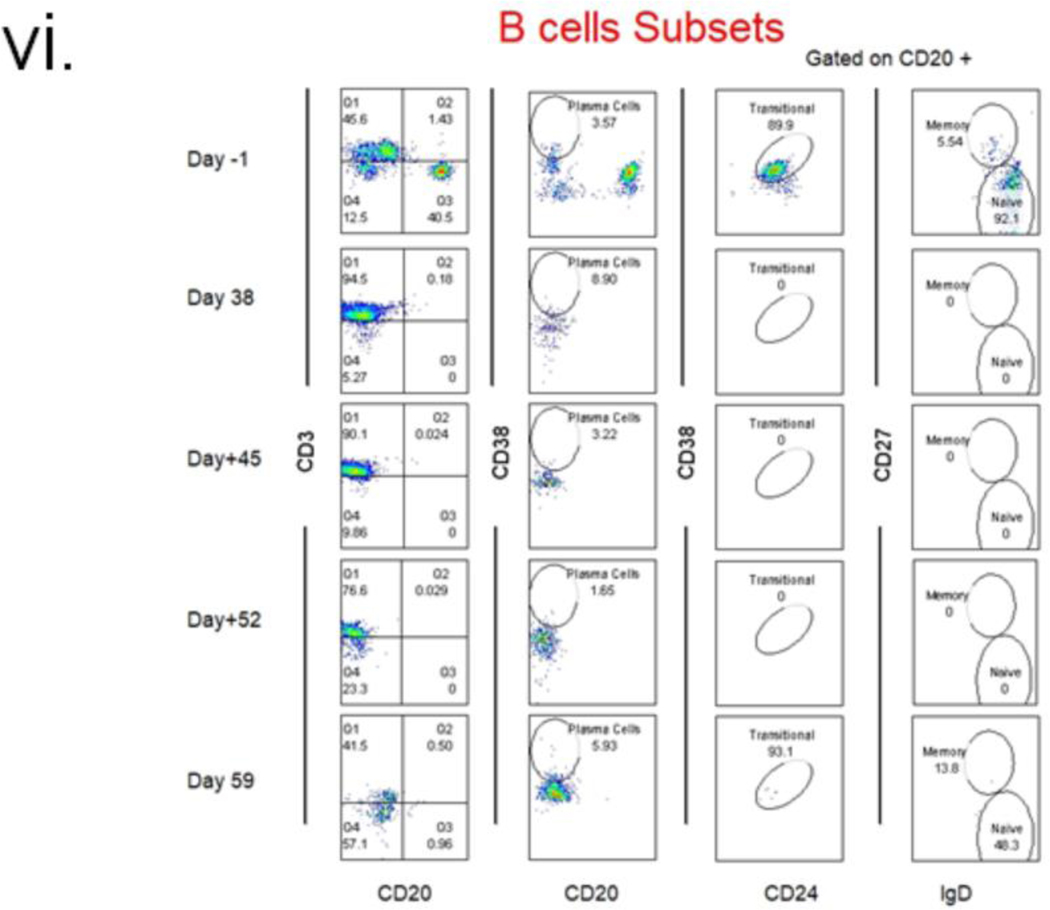
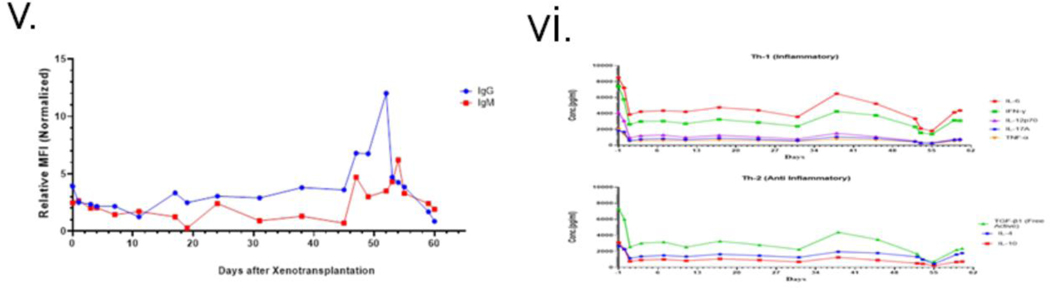
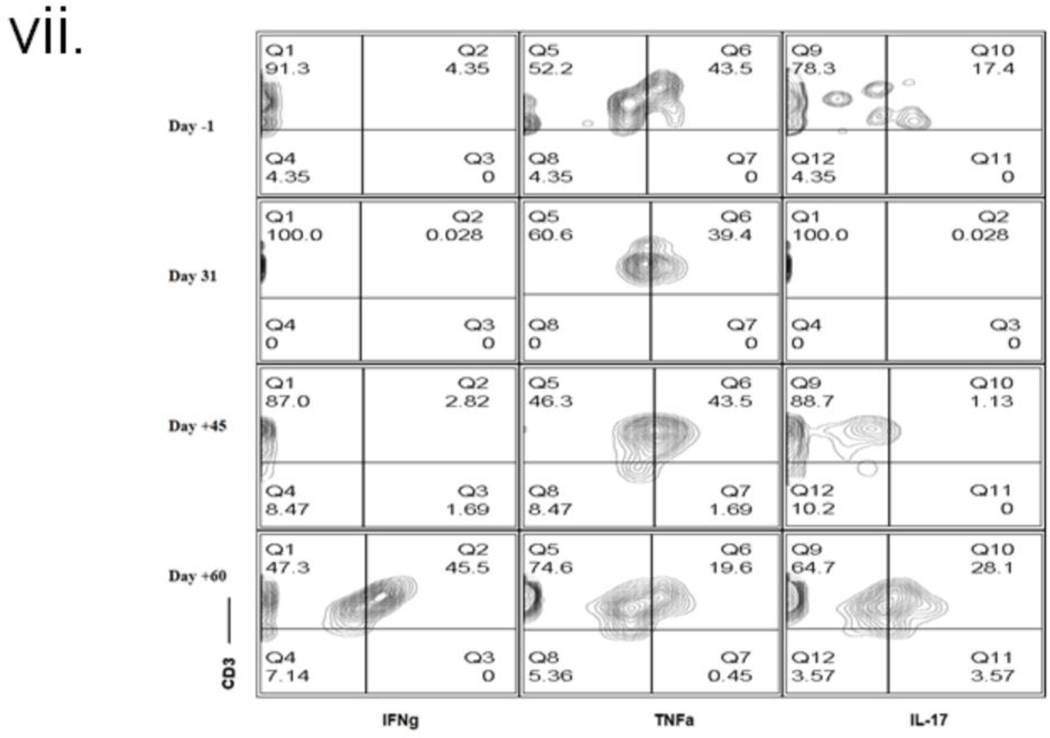
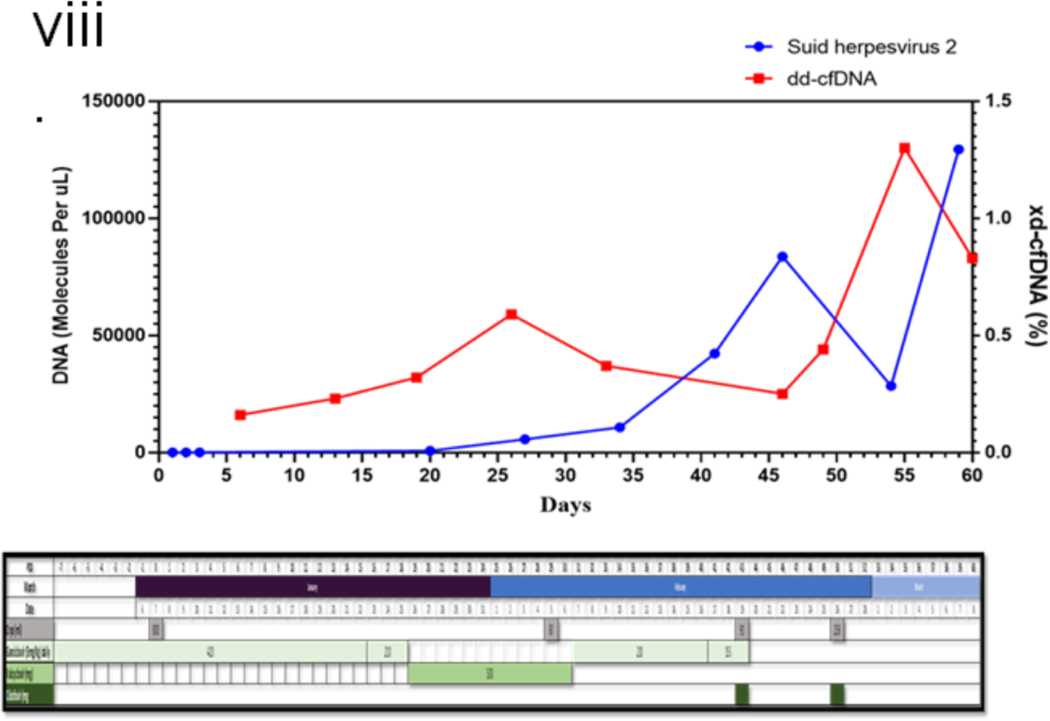
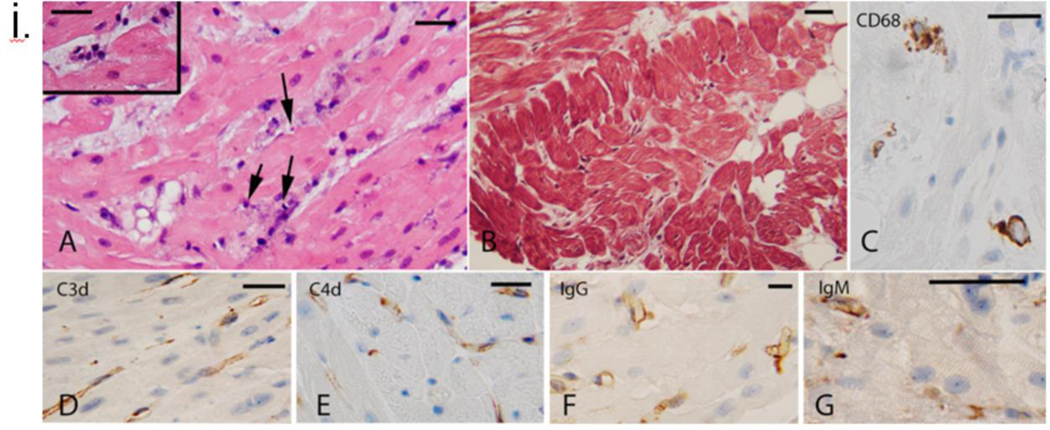
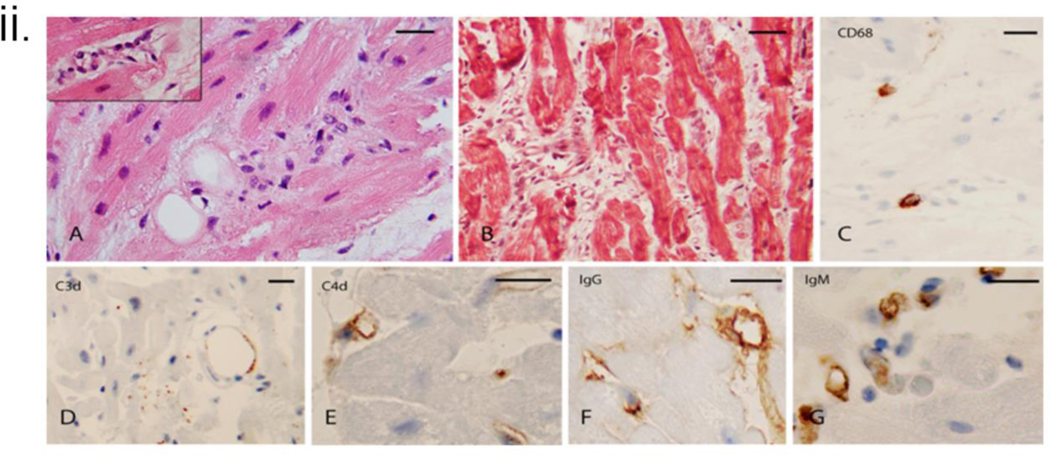
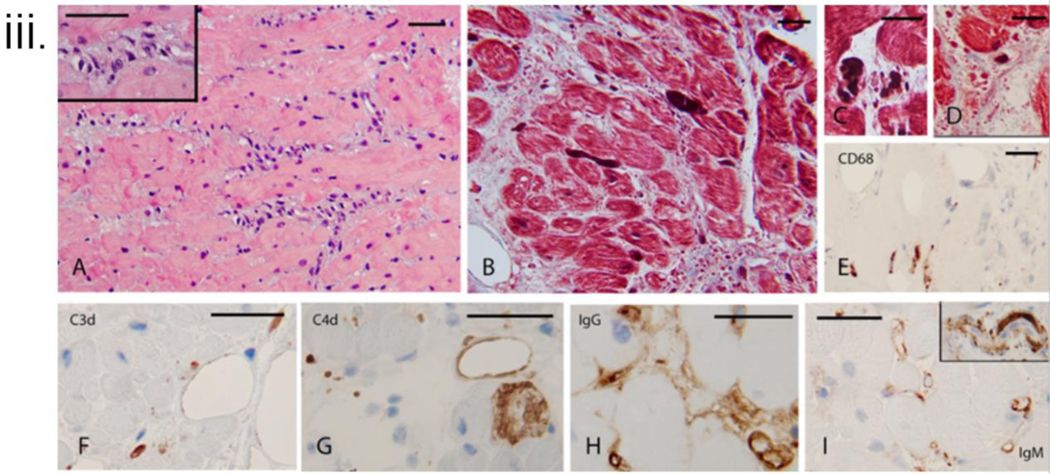
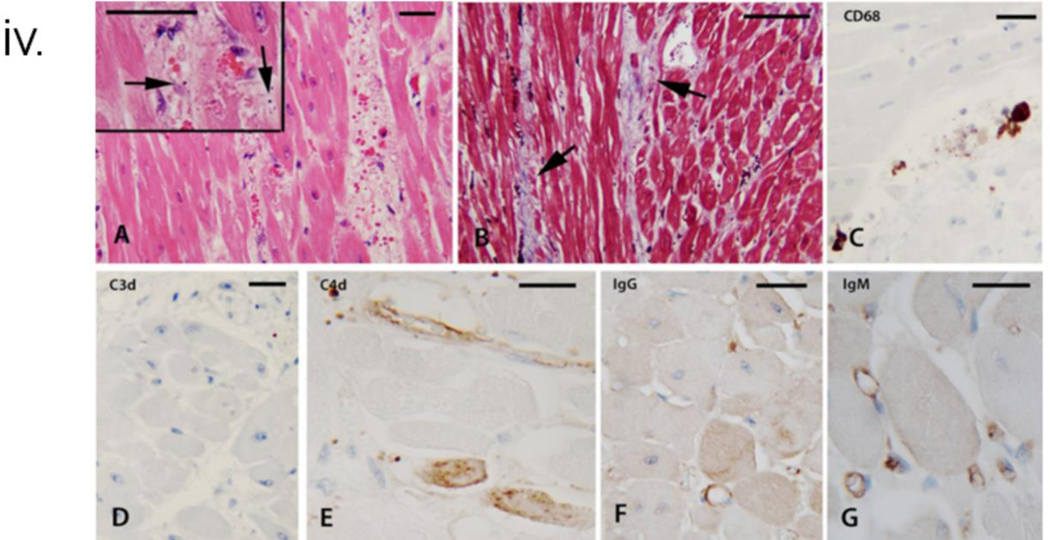
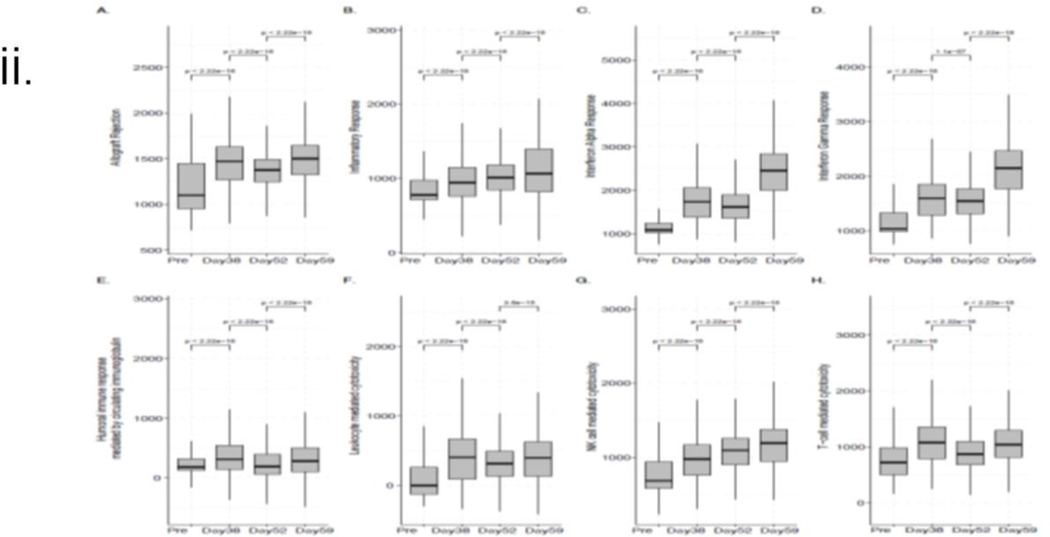
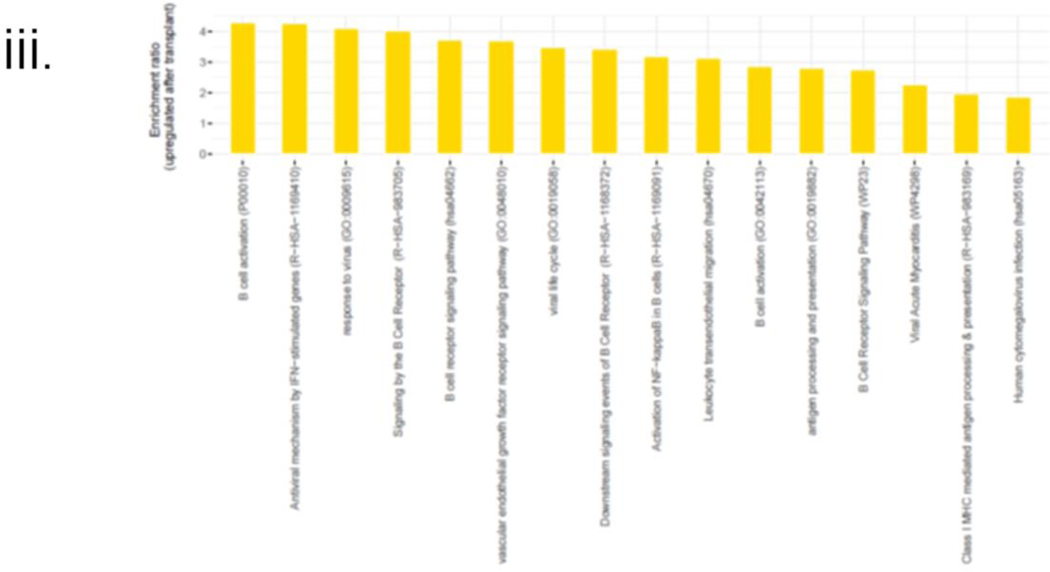
Findings: After successful xenotransplantation, the graft functioned well on echocardiography and sustained cardiovascular and other organ systems functions until postoperative day 47 when diastolic heart failure occurred. At postoperative day 50, the endomyocardial biopsy revealed damaged capillaries with interstitial oedema, red cell extravasation, rare thrombotic microangiopathy, and complement deposition. Increased anti-pig xenoantibodies, mainly IgG, were detected after IVIG administration for hypogammaglobulinaemia and during the first plasma exchange. Endomyocardial biopsy on postoperative day 56 showed fibrotic changes consistent with progressive myocardial stiffness. Microbial cell-free DNA testing indicated increasing titres of PCMV/PRV cell-free DNA. Post-mortem single-cell RNA sequencing showed overlapping causes.

Interpretation: Hyperacute rejection was avoided. We identified potential mediators of the observed endothelial injury. First, widespread endothelial injury indicates antibody-mediated rejection. Second, IVIG bound strongly to donor endothelium, possibly causing immune activation. Finally, reactivation and replication of latent PCMV/PRV in the xenograft possibly initiated a damaging inflammatory response. The findings point to specific measures to improve xenotransplant outcomes in the future.

Funding: The University of Maryland School of Medicine, and the University of Maryland Medical Center.


Conflict of interest statement

Declaration of interests DA, AD, TV, LS, and KK are employees of Revivicor, a subsidy of United Therapeutics. KB is an employee of Kiniksa Pharmaceuticals. Members of Program in Cardiac Xenotransplantation received research funding from United Therapeutics. All other authors declare no competing interests.

Figures

Figure 1
Figure 1
(i): Phenotypic analysis of 10 gene edit pig(A328.1) and control quadruple knockout (QKO) and Wild type (WT) pig. A: Flow cytometric analysis of PBMCs to confirm deletion of Gal KO by the absence of IB4 lectin binding, CMAH KO by the absence of anti-Neu5GC antibody staining, and β4GalNT2 KO by the absence of DBA lectin staining, B: Western blot analysis of hTBM, hEPCR, hCD47, hHO1, hCD46, and hDAF transgene expression in the tail biopsy, and C: Serum IGF1 levels in donor and WT pig, reflecting GHR KO. D. Serological detection of anti-PCMV antibodies by western blot: PCMV glycoprotein B antigen (GenBank FJ595497.1; 2305–2574bp) was cloned, expressed and purified from an E.Coli 10X Histag vector (Origene). PCMV antigen was probed with pig sera or antibodies as described using western blot system (Simple Wes, Bio-techne) : His-tagged PCMV antigen was run on Lanes 1–6 in an automated capillary western; Lanes 1–3: A328.1 pig serum at increasing dilutions, and rabbit anti-pig IgG secondary antibody Lane 4: positive control (PCMV positive pig serum, and rabbit anti-pig IgG secondary antibody); Lane 5: negative control (PCMV anti-pig IgG secondary antibody alone (no serum); Lane 6: positive control (rabbit anti-His antibody and Mouse anti-Rabbit secondary antibody). Similar results were observed with PCMV glycoprotein B antigen (GenBank AF268039; 2771–31118bp). E. Quantitation of band densities in D (6x His tag positive control not shown). A328.1 anti-PCMV IgG was positive to a titer of 1:300. Similar results were observed with PCMV glycoprotein B antigen(GenBank AF268039; 2771–31118bp). (ii): Transgene expression of endomyocardial biopsy (EMB) and xenograft after post-mortem. A: hTBM, hCD47, hHO1, hCD46, and hDAF were expressed at detectable levels in EMB and Xenograft along with negative control by IHC. hEPCR expression is below the level of detection in the Day 30 biopsy. hTBM expression is restricted to endothelial in the Day 30 biopsy (arrow) but upregulated in the post-mortem sample, a prudential indicator of stress, inflammation, or coagulation. Moreover, expression was detected in non-endothelial cell types in the xenograft after post-mortem (arrowhead), B: Relative IHC pixel density quantitation hTBM and hEPCR expression of the Day 30 heart biopsy compared to the post-mortem heart sample and C: Western blot analysis of transgene expression in xenograft after post-mortem. hTBM, hEPCR, hCD47, hHO1, hCD46, and hDAF are expressed at expected molecular weights.
Figure 1
Figure 1
(i): Phenotypic analysis of 10 gene edit pig(A328.1) and control quadruple knockout (QKO) and Wild type (WT) pig. A: Flow cytometric analysis of PBMCs to confirm deletion of Gal KO by the absence of IB4 lectin binding, CMAH KO by the absence of anti-Neu5GC antibody staining, and β4GalNT2 KO by the absence of DBA lectin staining, B: Western blot analysis of hTBM, hEPCR, hCD47, hHO1, hCD46, and hDAF transgene expression in the tail biopsy, and C: Serum IGF1 levels in donor and WT pig, reflecting GHR KO. D. Serological detection of anti-PCMV antibodies by western blot: PCMV glycoprotein B antigen (GenBank FJ595497.1; 2305–2574bp) was cloned, expressed and purified from an E.Coli 10X Histag vector (Origene). PCMV antigen was probed with pig sera or antibodies as described using western blot system (Simple Wes, Bio-techne) : His-tagged PCMV antigen was run on Lanes 1–6 in an automated capillary western; Lanes 1–3: A328.1 pig serum at increasing dilutions, and rabbit anti-pig IgG secondary antibody Lane 4: positive control (PCMV positive pig serum, and rabbit anti-pig IgG secondary antibody); Lane 5: negative control (PCMV anti-pig IgG secondary antibody alone (no serum); Lane 6: positive control (rabbit anti-His antibody and Mouse anti-Rabbit secondary antibody). Similar results were observed with PCMV glycoprotein B antigen (GenBank AF268039; 2771–31118bp). E. Quantitation of band densities in D (6x His tag positive control not shown). A328.1 anti-PCMV IgG was positive to a titer of 1:300. Similar results were observed with PCMV glycoprotein B antigen(GenBank AF268039; 2771–31118bp). (ii): Transgene expression of endomyocardial biopsy (EMB) and xenograft after post-mortem. A: hTBM, hCD47, hHO1, hCD46, and hDAF were expressed at detectable levels in EMB and Xenograft along with negative control by IHC. hEPCR expression is below the level of detection in the Day 30 biopsy. hTBM expression is restricted to endothelial in the Day 30 biopsy (arrow) but upregulated in the post-mortem sample, a prudential indicator of stress, inflammation, or coagulation. Moreover, expression was detected in non-endothelial cell types in the xenograft after post-mortem (arrowhead), B: Relative IHC pixel density quantitation hTBM and hEPCR expression of the Day 30 heart biopsy compared to the post-mortem heart sample and C: Western blot analysis of transgene expression in xenograft after post-mortem. hTBM, hEPCR, hCD47, hHO1, hCD46, and hDAF are expressed at expected molecular weights.
Figure 2:
Figure 2:. Immunosuppression and Immune monitoring of the recipient.
i: Flow cytometric analysis of the recipient’s PBMCs (POD −1, 0,1, and 3) and lymph nodes (on day +2); ii: Relative PKA levels of KPL-404 administration at different time points (days). iii: Absolute numbers of CD3+ & CD20+; CD4+& CD8+ and CD4/CD8 ratio; iv: Anti-pig non-Gal (IgG and IgM) antibodies titers, v: Serum cytokine levels; iv: Anti-viral therapy in relation to the detection of porcine cfDNA in patient’s blood. Viral therapy was adjusted based on the patient’s clinical condition or response to changes in the WBC count.
Figure 3
Figure 3
i. Histopathology and immunohistochemistry of endomyocardial biopsy (EMB) on POD 34. A: On the H&E stain, there is mild interstitial edema in the myocardium with subtle injury of the endothelium with features suggestive of apoptosis (nuclear condensation and nuclear fragments (arrows). Insert cluster of enlarged endothelial cells in a slightly edematous interstitium, B: Trichrome stain to highlight interstitial collagen is within normal limits, C: CD68 stain demonstrates clusters of macrophages. The distribution in clusters suggests an intravascular location, D, E, F, and G demonstrate deposition in the C3d, C4d, IgG, and IgM microvasculature. Bars represent 50 microns. ii. Histopathology and immunohistochemistry of endomyocardial biopsy (EMB) on POD 50. A: On the H&E stain, there is significant interstitial edema with a cluster of disorganized endothelium and mononuclear cells. Insert: Abnormal endothelial cells line the microvasculature, B: Trichrome stain highlights the separation of the myocardiocytes by expanded interstitium due to edema and an increase in spindle interstitial cells (fibroblasts), C: CD68 stain demonstrates occasional macrophages, D: CD3 stain shows insignificant punctate staining and outlines a fat globule. E, F, and G demonstrate C4d, IgG, and IgM microvasculature deposition. Bars represent 50 microns. iii. Histopathology and immunohistochemistry of endomyocardial biopsy (EMB) on POD 59. A: On H&E stain, the interstitium is expanded by a mixed population of cells representing disorganized microvasculature and incipient interstitial fibrosis. Insert Higher magnification of the cellular areas, B: Trichrome stain confirms the presence of fibrous interstitial expansion with incipient collagenization. The interstitium has abundant cell fragments and extravasated red cells in some areas. Thrombi are noted to appear as dark elongated structures, C and D: Trichrome stain highlights thrombi in the microvasculature, D: Trichrome stain demonstrates interstitial edema, incipient collagenization, and fragmented red cells, E: CD68 stain demonstrates rare macrophages that were noted predominantly in the subendocardial areas, F: C3d stain focally marks possible residual vascular spaces. G: C4d stain showed heterogeneous staining, focally, and H and I demonstrate the deposition of IgG and IgM in the microvasculature. Insert (top right) shows a thrombus highlighted by the IgM stain. Bars represent 50 microns iv. Histopathology and immunohistochemistry of explanted cardiac xenograft at necropsy. A: H&E sections demonstrated edematous interstitial areas with abundant extravasated red blood cells. Insert: Arrows mark apoptotic nuclear fragments in the interstitium. In addition, not depicted in the images were single cell and confluent areas of myocyte necrosis, B: Trichrome stain highlighted incipient areas of collagen deposition in the expanded, edematous interstitium, C: The CD68 stain highlighted rare clusters of macrophages, D: The C3d stain was essentially negative, E: The C4d stain was overall negative, with the endothelium of rare arterioles decorated (top area). The lower parts of the image show isolated necrotic myocytes marked by the stain in a non-specific manner, F: IgG stain marks the outline of very rare microvascular spaces, and G: The IgM stain marks the outline of scattered capillaries. v: Electron microscopy of endomyocardial biopsy (EMB) on POD 34 & 50. A: In the first biopsy on POD 34, More than 95% of arterioles were normal with quiescent endothelial cells. There was sparse interstitial tissue, and adjacent myocytes had normal myofilaments (M), B: In the first biopsy, exceptional capillaries had endothelial cell swelling. Note incipient interstitial expansion, edema, and degenerative features in the adjacent myocytes, C: Second biopsy on POD 50, more than 50% of capillaries had marked endothelial injury with cytoplasmic swelling, cell necrosis, and occasional apoptosis (arrow). vi: Electron microscopy of endomyocardial biopsy (EMB) on POD 56 and explanted cardiac xenograft at necropsy. A: In the third biopsy on POD 56, severe endothelial injury and destruction were noted in most capillaries. Note enlarged nuclei (arrow), necrotic cellular fragments (arrowheads), and extravasated red cells (asterisks). Adjacent myocytes have swelling in myocytes and loss of myofilaments, and B: Cardiac xenograft after post-mortem demonstrates loss of capillaries in the interstitial space with early deposition of collagen bundles (fibrous organization, asterisk). Note loss of myofilaments in adjacent myocytes (M). Viral particles or viral cytopathic changes were not present in any sample.
Figure 3
Figure 3
i. Histopathology and immunohistochemistry of endomyocardial biopsy (EMB) on POD 34. A: On the H&E stain, there is mild interstitial edema in the myocardium with subtle injury of the endothelium with features suggestive of apoptosis (nuclear condensation and nuclear fragments (arrows). Insert cluster of enlarged endothelial cells in a slightly edematous interstitium, B: Trichrome stain to highlight interstitial collagen is within normal limits, C: CD68 stain demonstrates clusters of macrophages. The distribution in clusters suggests an intravascular location, D, E, F, and G demonstrate deposition in the C3d, C4d, IgG, and IgM microvasculature. Bars represent 50 microns. ii. Histopathology and immunohistochemistry of endomyocardial biopsy (EMB) on POD 50. A: On the H&E stain, there is significant interstitial edema with a cluster of disorganized endothelium and mononuclear cells. Insert: Abnormal endothelial cells line the microvasculature, B: Trichrome stain highlights the separation of the myocardiocytes by expanded interstitium due to edema and an increase in spindle interstitial cells (fibroblasts), C: CD68 stain demonstrates occasional macrophages, D: CD3 stain shows insignificant punctate staining and outlines a fat globule. E, F, and G demonstrate C4d, IgG, and IgM microvasculature deposition. Bars represent 50 microns. iii. Histopathology and immunohistochemistry of endomyocardial biopsy (EMB) on POD 59. A: On H&E stain, the interstitium is expanded by a mixed population of cells representing disorganized microvasculature and incipient interstitial fibrosis. Insert Higher magnification of the cellular areas, B: Trichrome stain confirms the presence of fibrous interstitial expansion with incipient collagenization. The interstitium has abundant cell fragments and extravasated red cells in some areas. Thrombi are noted to appear as dark elongated structures, C and D: Trichrome stain highlights thrombi in the microvasculature, D: Trichrome stain demonstrates interstitial edema, incipient collagenization, and fragmented red cells, E: CD68 stain demonstrates rare macrophages that were noted predominantly in the subendocardial areas, F: C3d stain focally marks possible residual vascular spaces. G: C4d stain showed heterogeneous staining, focally, and H and I demonstrate the deposition of IgG and IgM in the microvasculature. Insert (top right) shows a thrombus highlighted by the IgM stain. Bars represent 50 microns iv. Histopathology and immunohistochemistry of explanted cardiac xenograft at necropsy. A: H&E sections demonstrated edematous interstitial areas with abundant extravasated red blood cells. Insert: Arrows mark apoptotic nuclear fragments in the interstitium. In addition, not depicted in the images were single cell and confluent areas of myocyte necrosis, B: Trichrome stain highlighted incipient areas of collagen deposition in the expanded, edematous interstitium, C: The CD68 stain highlighted rare clusters of macrophages, D: The C3d stain was essentially negative, E: The C4d stain was overall negative, with the endothelium of rare arterioles decorated (top area). The lower parts of the image show isolated necrotic myocytes marked by the stain in a non-specific manner, F: IgG stain marks the outline of very rare microvascular spaces, and G: The IgM stain marks the outline of scattered capillaries. v: Electron microscopy of endomyocardial biopsy (EMB) on POD 34 & 50. A: In the first biopsy on POD 34, More than 95% of arterioles were normal with quiescent endothelial cells. There was sparse interstitial tissue, and adjacent myocytes had normal myofilaments (M), B: In the first biopsy, exceptional capillaries had endothelial cell swelling. Note incipient interstitial expansion, edema, and degenerative features in the adjacent myocytes, C: Second biopsy on POD 50, more than 50% of capillaries had marked endothelial injury with cytoplasmic swelling, cell necrosis, and occasional apoptosis (arrow). vi: Electron microscopy of endomyocardial biopsy (EMB) on POD 56 and explanted cardiac xenograft at necropsy. A: In the third biopsy on POD 56, severe endothelial injury and destruction were noted in most capillaries. Note enlarged nuclei (arrow), necrotic cellular fragments (arrowheads), and extravasated red cells (asterisks). Adjacent myocytes have swelling in myocytes and loss of myofilaments, and B: Cardiac xenograft after post-mortem demonstrates loss of capillaries in the interstitial space with early deposition of collagen bundles (fibrous organization, asterisk). Note loss of myofilaments in adjacent myocytes (M). Viral particles or viral cytopathic changes were not present in any sample.
Figure 4:
Figure 4:. IVIG binding and cytotoxicity with PAECs:
A. IgG binding and B Cytotoxicity of IVIg: Three different lots of Gammagard IVIG (25mg/mL) and or 25% high control human sera binding to pig PAEC (A328–1).
Figure 5:
Figure 5:. PCMV/PRV Investigations.
i: shows the PCMV/PRV DNA level detected in the pig tissue’s initial screening from euthanasia and patient PBMCs from POD 45, as determined by qPCR normalized to one cellular load of porcine DNA, ii: confirmation of the initial PCMV/PRV investigation by conventional PCR for PCMV/PRV DNA, following electrophoresis on a 1.5% agarose gel. Lane 1: patient PBMCs, lane 2: pig spleen, lane 3: positive control, lane 4: negative control, lane 5: empty, lane 6: 100bp ladder, iii: PCMV/PRV DNA level detected in the xenograft compartments and recipient organs at autopsy; as determined by qPCR, PCMV/PRV DNA levels are normalized to one cellular load of porcine DNA, and iv: PCMV/PRV RNA transcripts detected within the right ventricle of the xenograft at autopsy, as determined by qRT-PCR. Transcript copies are normalized to 100ng of total RNA.
Figure 6:
Figure 6:. Single-cell RNA sequence analysis:
i. Changes in the immune cell type composition over time: Proportions of the major immune cell types in the integrated data set and at the sample level, where each sample corresponds to a different time point. The circle size and color correspond to each cell type’s overall and time point-specific proportions, respectively. ii. ssGSEA-based enrichment scores of relevant hallmark signatures: Box plots showing the distributions (across all cells for each sample) of the hallmark gene set enrichment scores associated with (A) allograft rejection, (B) global inflammatory response, (C) interferon alpha, (D) interferon gamma-specific responses, (E) humoral immune response mediated by circulating immunoglobulin and in addition to cytotoxicity mediated by (F) leukocytes and specifically, by (G) NK cells and (H) T-cells. Each box plot shows the median and lower/upper quartiles as solid horizontal lines; whiskers extend to minima (lower quartile-1.5*interquartile range) and maxima (upper quartile+1.5*interquartile range), excluding the outliers. The reported p-values are computed from the pairwise comparisons of consecutive time points using the Wilcoxon rank sum test; iii. Enrichment profile associated with BCR signaling, viral infection, and endothelial damage. The enrichment ratios of the GO term and pathways (p-value<0.05) associated with the genes upregulated by at least 50% (with FDR~0) in the post-transplant samples compared to the pre-transplant sample.

Comment in

References

    1. Mohiuddin MM, Goerlich CE, Singh AK, Zhang T, Tatarov I, Lewis B, et al. Progressive genetic modifications of porcine cardiac xenografts extend survival to 9 months. Xenotransplantation. 2022:e12744. - PMC - PubMed
    1. Mohiuddin MM, Singh AK, Corcoran PC, Azimzadeh AM, Ayares D, Hoyt RF, et al. B cell depletion by anti CD20 prolongs GalKO.hCD46 pig heterotopic cardiac xenograft survival in baboons. Xenotransplantation. 2009;16(5):357-.
    1. Mohiuddin MM, Singh AK, Corcoran PC, Thomas ML 3rd, Clark T, Lewis BG, et al. Chimeric 2C10R4 anti-CD40 antibody therapy is critical for long-term survival of GTKO.hCD46.hTBM pig-to-primate cardiac xenograft. Nat Commun. 2016;7:11138. - PMC - PubMed
    1. Griffith BP, Goerlich CE, Singh AK, Rothblatt M, Lau CL, Shah A, et al. Genetically Modified Porcine-to-Human Cardiac Xenotransplantation. N Engl J Med. 2022;387(1):35–44. - PMC - PubMed
    1. Azimzadeh AM, Byrne GW, Ezzelarab M, Welty E, Braileanu G, Cheng X, et al. Development of a consensus protocol to quantify primate anti-non-Gal xenoreactive antibodies using pig aortic endothelial cells. Xenotransplantation. 2014;21(6):555–66. - PMC - PubMed

Publication types

Substances