. 2023 Jul 3;11(1):140.
doi: 10.1186/s40168-023-01584-0.

Gut barrier-microbiota imbalances in early life lead to higher sensitivity to inflammation in a murine model of C-section delivery

Affiliations

Gut barrier-microbiota imbalances in early life lead to higher sensitivity to inflammation in a murine model of C-section delivery

M Barone et al. Microbiome. .

Erratum in

Abstract

Background: Most interactions between the host and its microbiota occur at the gut barrier, and primary colonizers are essential in the gut barrier maturation in the early life. The mother-offspring transmission of microorganisms is the most important factor influencing microbial colonization in mammals, and C-section delivery (CSD) is an important disruptive factor of this transfer. Recently, the deregulation of symbiotic host-microbe interactions in early life has been shown to alter the maturation of the immune system, predisposing the host to gut barrier dysfunction and inflammation. The main goal of this study is to decipher the role of the early-life gut microbiota-barrier alterations and its links with later-life risks of intestinal inflammation in a murine model of CSD.

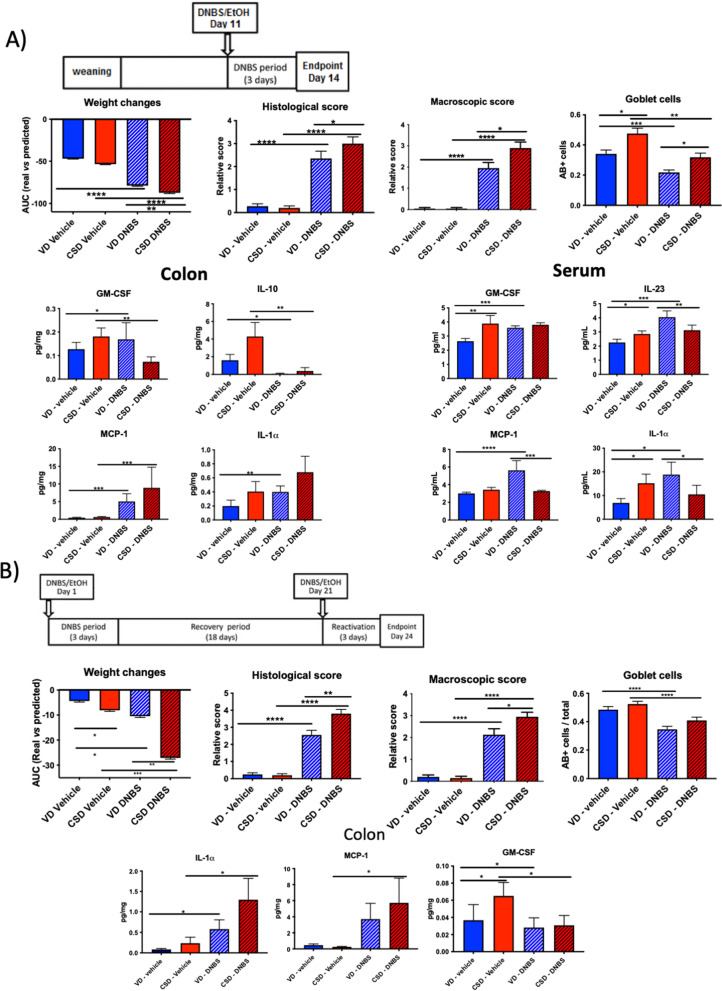
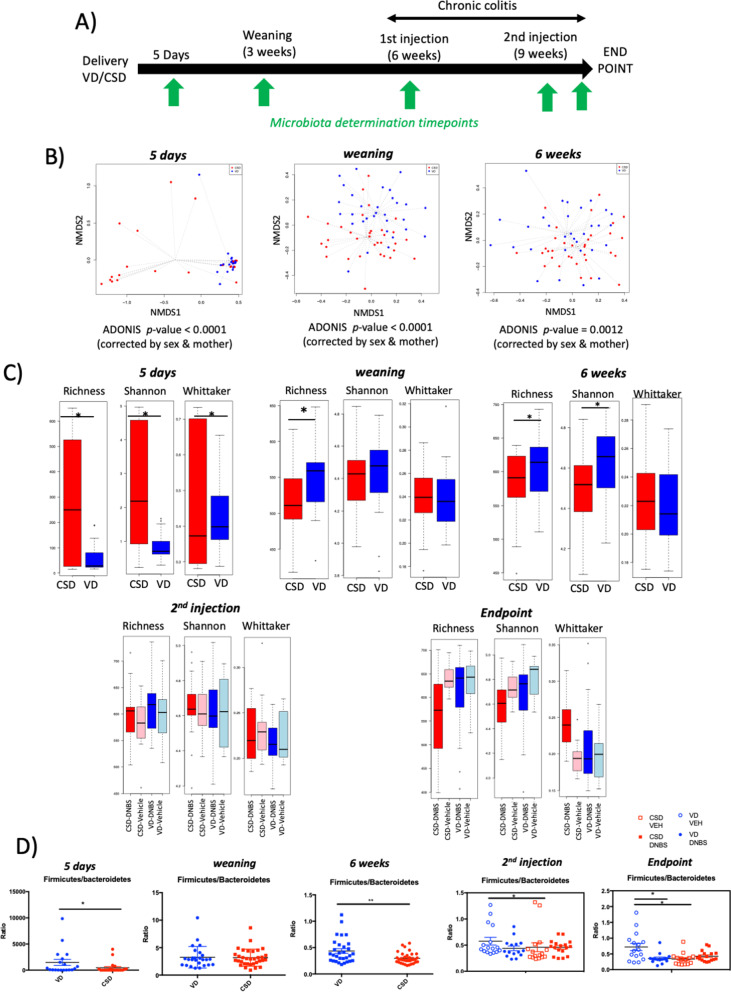
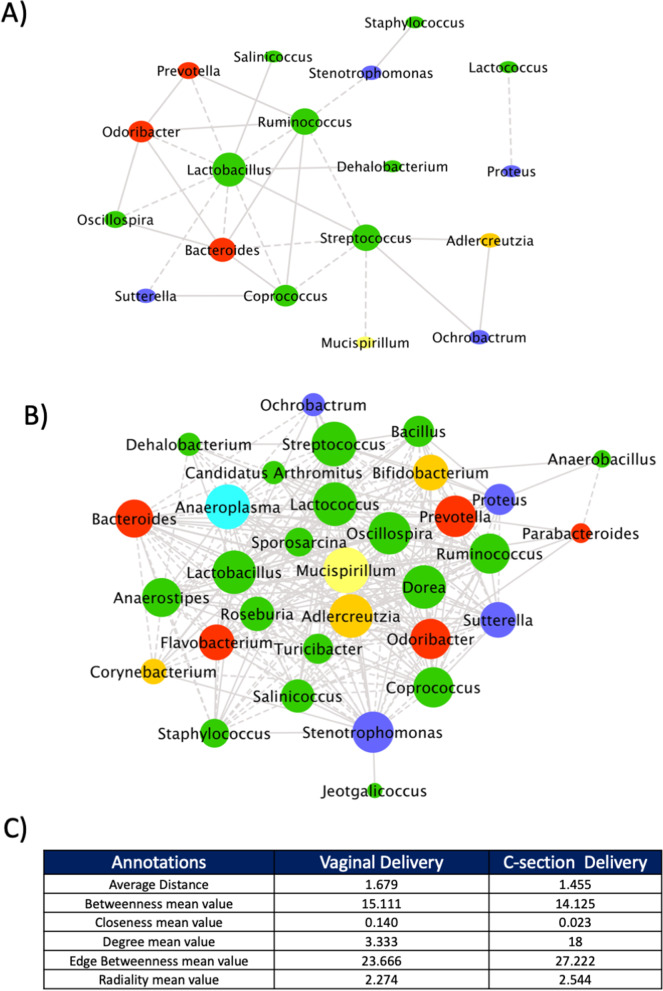
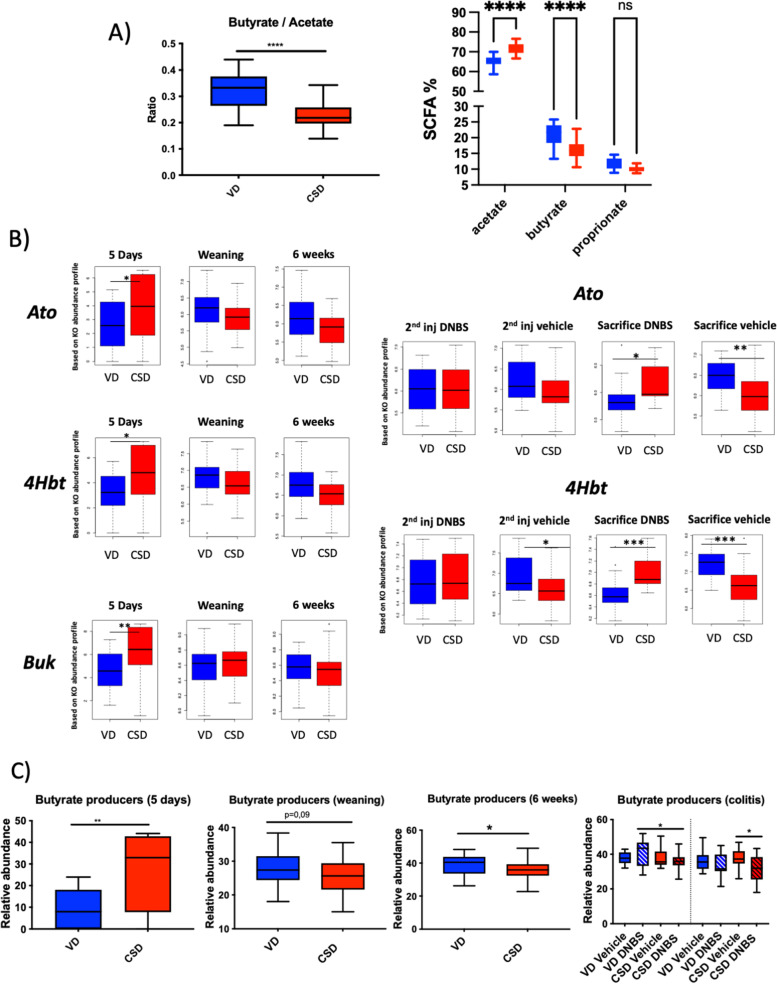
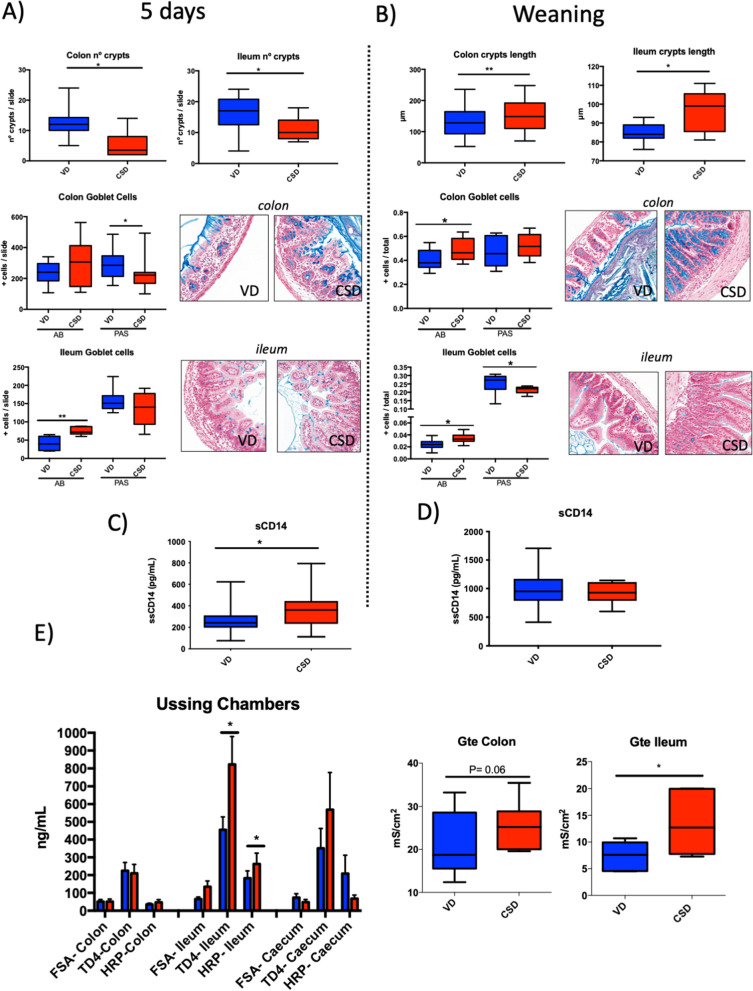
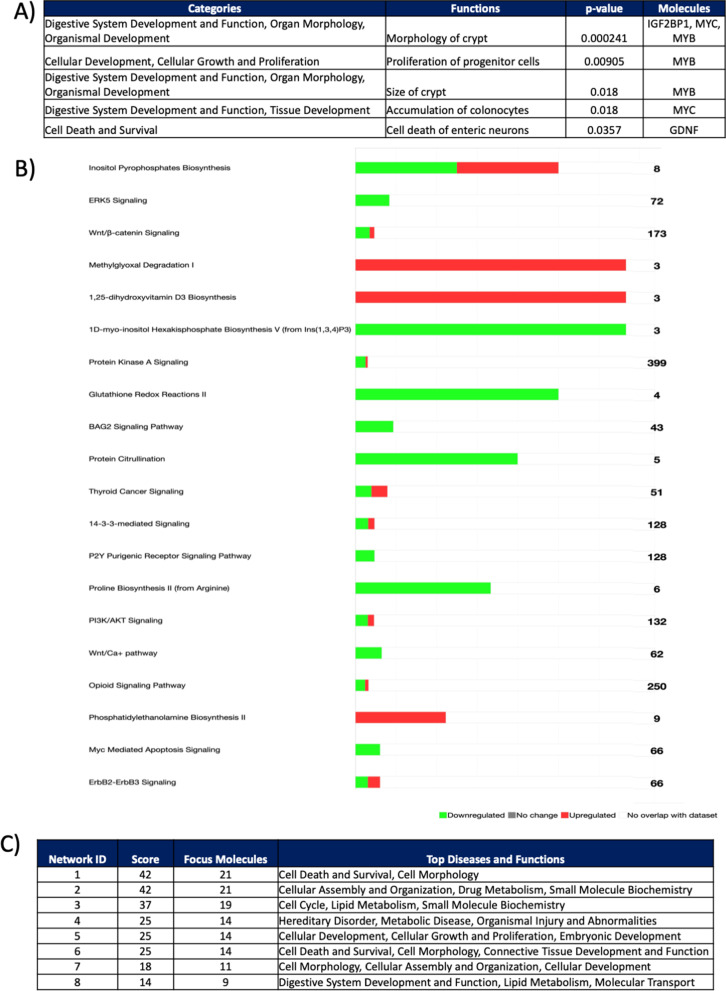
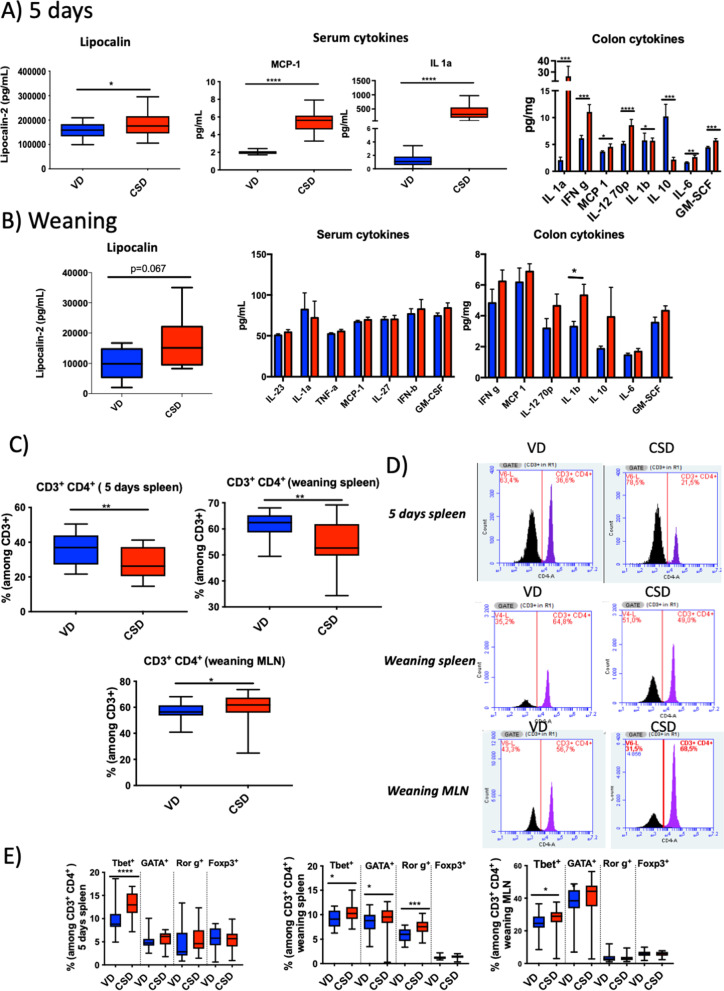
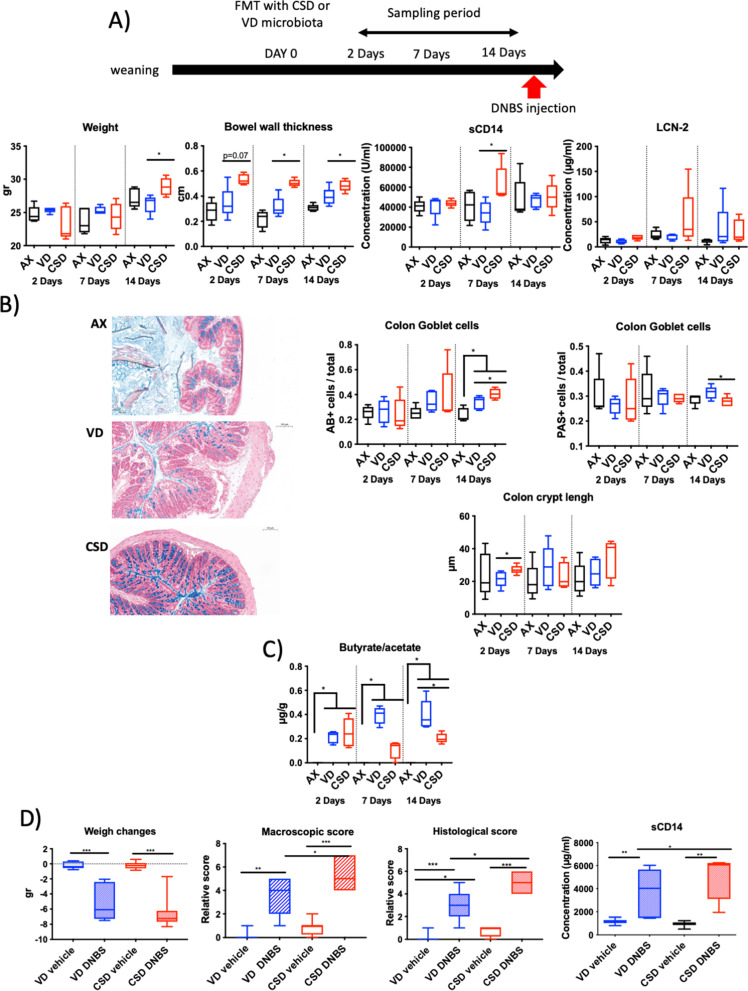
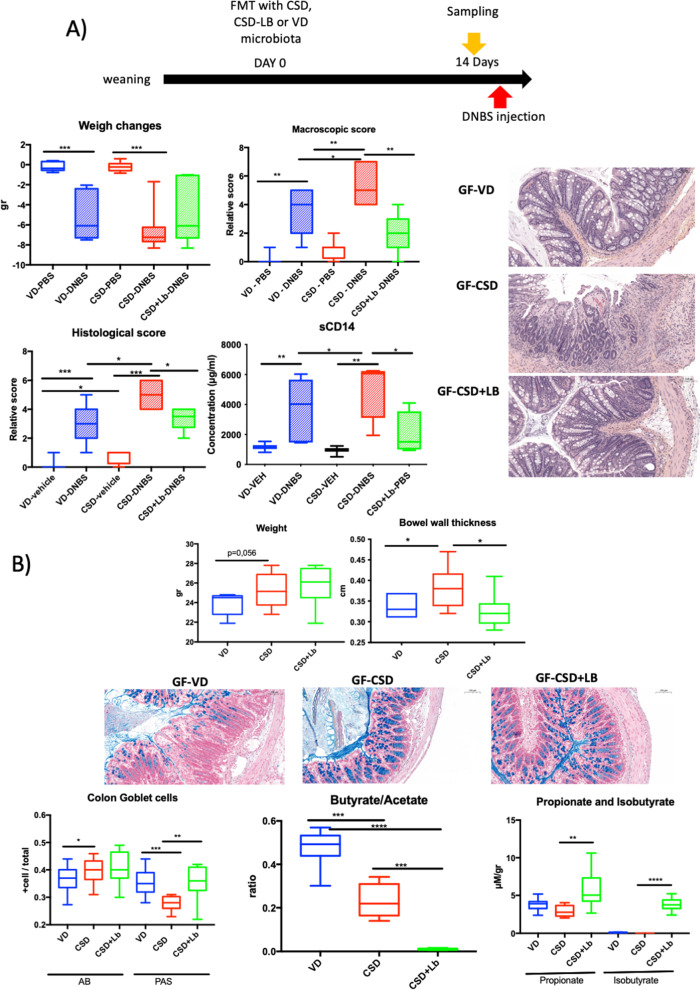
Results: The higher sensitivity to chemically induced inflammation in CSD mice is related to excessive exposure to a too diverse microbiota too early in life. This early microbial stimulus has short-term consequences on the host homeostasis. It switches the pup's immune response to an inflammatory context and alters the epithelium structure and the mucus-producing cells, disrupting gut homeostasis. This presence of a too diverse microbiota in the very early life involves a disproportionate short-chain fatty acids ratio and an excessive antigen exposure across the vulnerable gut barrier in the first days of life, before the gut closure. Besides, as shown by microbiota transfer experiments, the microbiota is causal in the high sensitivity of CSD mice to chemical-induced colitis and in most of the phenotypical parameters found altered in early life. Finally, supplementation with lactobacilli, the main bacterial group impacted by CSD in mice, reverts the higher sensitivity to inflammation in ex-germ-free mice colonized by CSD pups' microbiota.

Conclusions: Early-life gut microbiota-host crosstalk alterations related to CSD could be the linchpin behind the phenotypic effects that lead to increased susceptibility to an induced inflammation later in life in mice. Video Abstract.

Keywords: C-section delivery; Early life; Gut barrier; Inflammation; Microbiota; Murine model; Primary colonization.


Conflict of interest statement

The authors declare no competing interests.

Figures

Fig. 1
Fig. 1
Acute and chronic chemical-induced colitis experiments. A DNBS-induced acute colitis model protocol. B DNBS-induced chronic colitis model protocol, weigh changes after DNBS injection, histological score, macroscopic score, goblet cells percentages, colon cytokine levels and serum cytokine levels. Groups: vaginal-delivered mice, non-inflamed (VD, vehicle, blue solid); vaginal-delivered mice, inflamed (VD-DNBS, blue striped); C-section-delivered mice, non-inflamed (CSD, vehicle, red solid); C-section-delivered mice, inflamed (CSD-DNBS, red striped). n = 20. DNBS, 2,4-dinitrobenzene sulphonic acid; EtOH, ethanol; GM-CSF, granulocyte–macrophage colony-stimulating factor; MCP-1, monocyte chemoattractant protein-1. *p-value < 0.05; **p-value < 0.01; ***p-value < 0.001; ****p-value < 0.0001
Fig. 2
Fig. 2
Microbiota analysis in early life. A Schema of the sampling procedures. B Nonmetric multidimensional scaling (NMDS) analyses based on the Bray–Curtis. C Richness, alpha and beta diversities and richness (measured by Shannon and Whitaker index). D Firmicutes/Bacteroidetes ratios. Sample size: 5 days, n = 31–33; weaning n = 31–33; 6 weeks, n = 32; second injection and endpoint, n = 18. Groups at 5 days, weaning and 6 weeks: vaginal delivery (VD, blue) and C-section delivery (CSD, red). Groups at second injection and endpoint: vaginal-delivered mice, non-inflamed (VD, vehicle, light blue); vaginal-delivered mice, inflamed (VD-DNBS, dark blue); C-section-delivered mice, non-inflamed (CSD, vehicle, light red); C-section-delivered mice, inflamed (CSD-DNBS, dark red). *p-value < 0.05; **p-value < 0.01
Fig. 3
Fig. 3
Microbiota origin and network. A and B Typical bacterial hub of VD (B) and CSD (C) mice at weaning. C Main parameters of VD and CSD pup networks. N = 31–33
Fig. 4
Fig. 4
Short-chain fatty acid analyses. A Butyrate/acetate ratio and percentage of acetate and butyrate at caecum samples at weaning. B Modulation of KEGG orthologs involved in butyrate production pathway predicted by PICRUSt approach (butyrate kinase [buk, K00929], vinylacetyl-CoA 3,2-isomerase [AbfD, 4Hbt, K14534] and butyryl-CoA:acetate CoA transferase [Ato, K01034]). C Comparison of butyrate producer genus at 5 days, weaning, 6 weeks, second injection and endpoint (VD versus CSD). Groups: vaginal-delivered mice, non-inflamed (VD-vehicle, blue solid); vaginal-delivered mice, inflamed (VD-DNBS, blue striped); C-section-delivered mice, non-inflamed (CSD vehicle, red solid); C-section-delivered mice, inflamed (CSD-DNBS, red striped). N = 18–22. *p-value < 0.05; **p-value < 0.01; ***p-value < 0.001; ****p-value < 0.0001
Fig. 5
Fig. 5
Gut barrier structure and permeability features at 5 days and weaning. A Colon or ileum number of crypts at 5 days (n = 7–8); percentage of goblet cells along with representative photos of colon and ileum samples, stained by Alcian blue or PAS. B Crypt length and goblet cell percentages along with representative photos of colon or ileum samples, stained by AB or PAS at weaning (n = 6–10). C and D Concentration of sCD14 in serum samples at 5 days (n = 20) and weaning (n = 20). E Global permeability measured by the tracer FITC-dextran in serum at weaning (n = 28). Permeability to the tracers FSA, TD4 and HRP of colon, ileum and caecum tissues mounted in Ussing chambers (n = 10). Electrical conductance of colon and ileum tissues mounted in Ussing chambers (n = 10). Groups: vaginal delivery (VD, blue) and C-section delivery (CSD, red). AB, Alcian blue; PAS, periodic acid-Schiff. *p-value < 0.05; **p-value < 0.01
Fig. 6
Fig. 6
Transcriptome analysis of colon samples at weaning. A Functional analysis of differential expressed (DE) genes (n = 5). B Predicted Effect (p-value < 0.005) of DE genes on biological functions modulated by CSD and related categories. Top ranked canonical pathways (−log(p-value) > 1.3) in Ingenuity Pathway Analysis (IPA) for DE genes between CSD and VD pups (green downregulated, red upregulated). C Top-ranked enriched networks based on IPA network analysis of differentially expressed proteins and metabolites in the CSD group and diseases and functions related
Fig. 7
Fig. 7
Local and systemic immunity parameters. General inflammatory parameters at 5 days (A) and weaning (B). Lipocalin-2 concentration in serum at 5 days (n = 19–21) and weaning (n = 10); cytokine concentrations in serum, colon and ileum (n = 10). C Positive CD3+/CD4.+ cells detected by flow cytometry in spleen at 5 days and mesenteric lymph nodes (MLN) and spleen at weaning (n = 20) and D representative flow charts. E Positive Th cells detected by flow cytometry in spleen at 5 days and MLN and spleen at weaning (n = 20). Groups: vaginal delivery (VD, blue) and C-section delivery (CSD, red). *p-value < 0.05; **p-value < 0.01; ***p-value < 0.001; ****p-value < 0.0001
Fig. 8
Fig. 8
Analysis of ex-germ-free mice colonized with VD and CSD microbiota by faecal microbiota transplantation. A Phenotypic parameters at short term: weight, bowel wall thickness, sCD14 on serum samples, lipocalin-2 concentration in serum samples. B Histological features representative photos of colon stained with AB; proportion of goblet cells stained with AB or PAS colon crypt length. C Butyrate/acetate ratio. D Sensitivity to DNBS-induced colitis in the long term: weight changes after DNBS injection, macroscopic score, histological score, global permeability (sCD14 levels). Groups: axenic mice (AX), ex-GF mice colonized with vaginal-delivered faeces (VD, blue = GF-VD), C-section-delivered faeces (CSD, red = GF-CSD). N = 5–8. *p-value < 0.05; **p-value < 0.01; ***p-value < 0.001
Fig. 9
Fig. 9
Short- and long-term effects of lactobacilli supplementation in ex-germ-free colonized with CSD microbiota. A Sensitivity to DNBS-induced colitis in the long term: weight changes after DNBS injection, macroscopic score, histological score, global permeability measured, thanks to sCD14. B Phenotypic parameters at short term: weight, bowel wall thickness, colon AB+ or PAS.+ goblet cell percentages and representative pictures for AB staining, butyrate/acetate ratio, propionate and isobutyrate concentration on caecum contents. Groups: ex-GF mice colonized with vaginal-delivered faeces (VD, blue = GF-VD); C-section-delivered faeces (CSD, red = GF-CSD); microbiota or C-section-delivered faeces microbiota and lactobacilli (CSD + LB, green = GF-CSD + Lb) subjected (striped, DNBS) or not (solid, vehicle) to DNBS injections. N = 5–8. AB, Alcian blue; PAS, periodic acid-Schiff; FMT, faecal material transfer. *p-value < 0.05; **p-value < 0.01; ***p-value < 0.001

Similar articles

Cited by

References

    1. Lopetuso LR, Scaldaferri F, Bruno G, Petito V, Franceschi F, Gasbarrini A. The therapeutic management of gut barrier leaking: the emerging role for mucosal barrier protectors. Eur Rev Med Pharmacol Sci. 2015;19:1068–1076. - PubMed
    1. Perrier CCB. Gut permeability and food allergies. Clin Exp Allergy. 2011;41:20–28. - PubMed
    1. Camilleri M. Editorial: fecal granins in IBS: cause or indicator of intestinal or colonic irritation? Am J Gastroenterol. 2012;107:448–450. - PMC - PubMed
    1. Vaarala O. Gut microbiota and type 1 diabetes. Rev Diabet Stud. 2012;9:251–259. - PMC - PubMed
    1. Lemme-Dumit JM, Song Y, Lwin HW, Hernandez-Chavez C, Sundararajan S, Viscardi RM, Ravel J, Pasetti MF, Ma B. Altered gut microbiome and fecal immune phenotype in early preterm infants with leaky gut. Front Immunol. 2022;13:815046. - PMC - PubMed

Publication types