. 2023 Jul;55(7):1399-1412.
doi: 10.1038/s12276-023-01017-w. Epub 2023 Jul 3.

Mesenchymal stromal cells facilitate resolution of pulmonary fibrosis by miR-29c and miR-129 intercellular transfer

Affiliations

Mesenchymal stromal cells facilitate resolution of pulmonary fibrosis by miR-29c and miR-129 intercellular transfer

Basalova Nataliya et al. Exp Mol Med. 2023 Jul.

Abstract

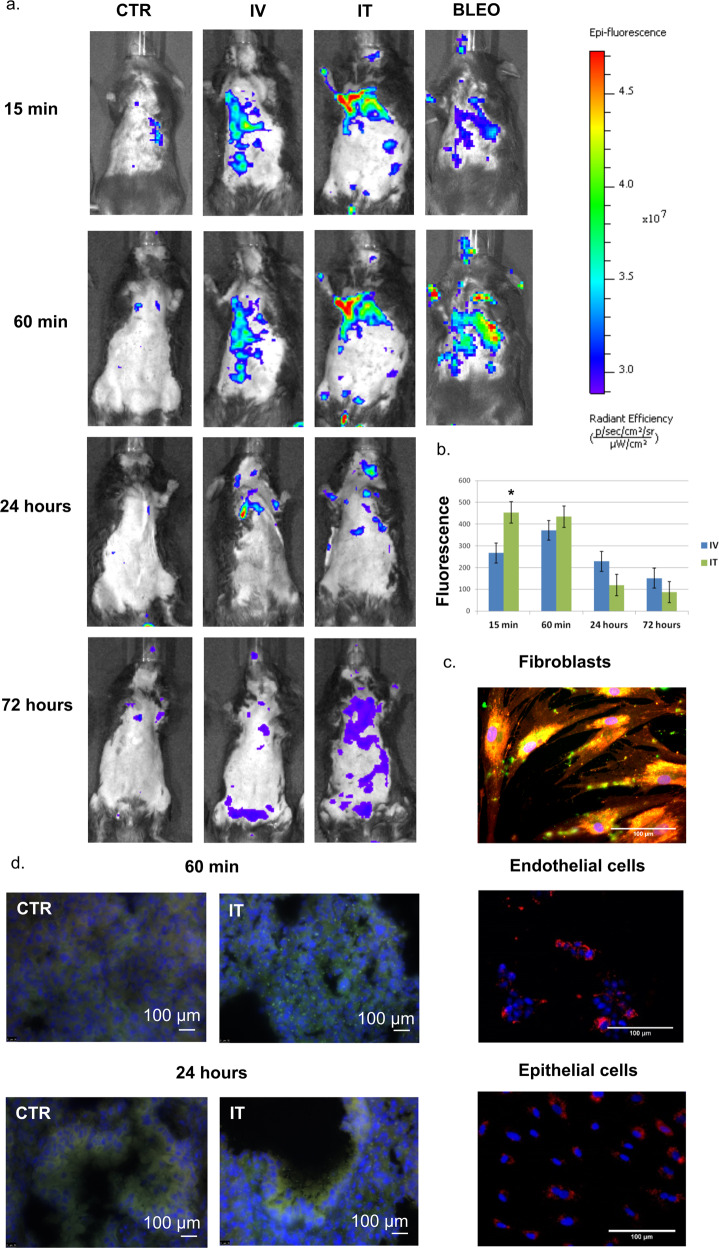
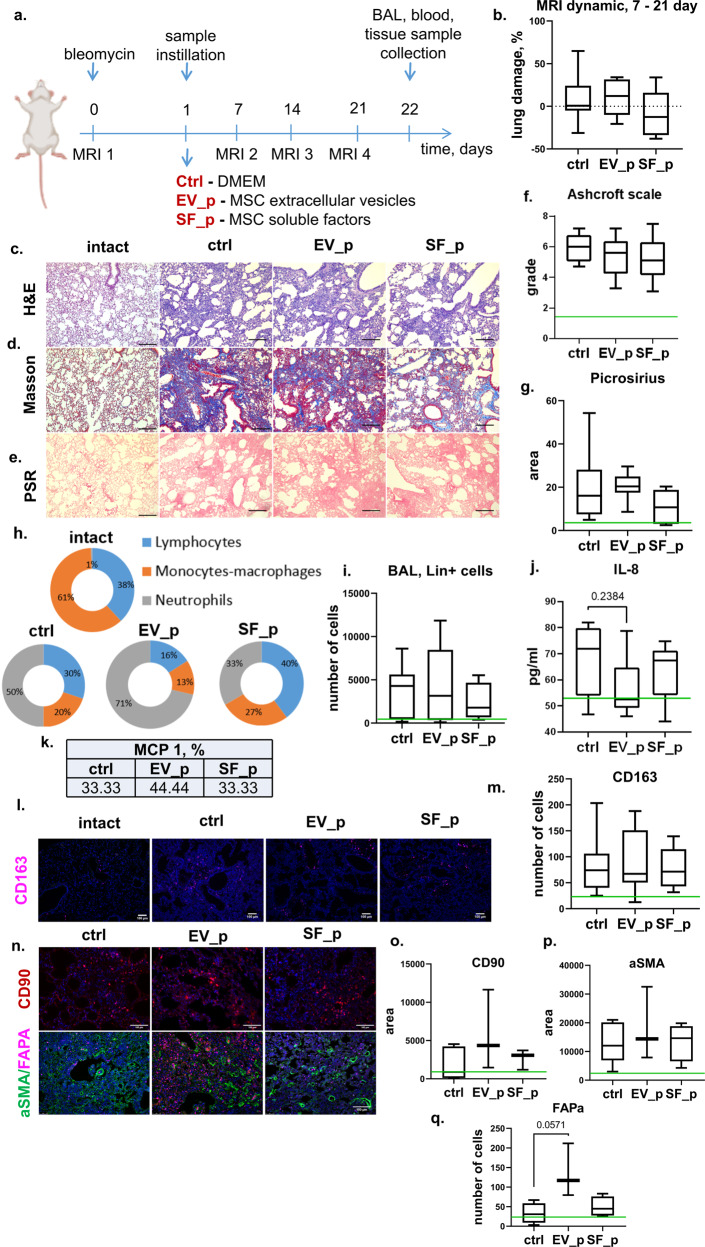
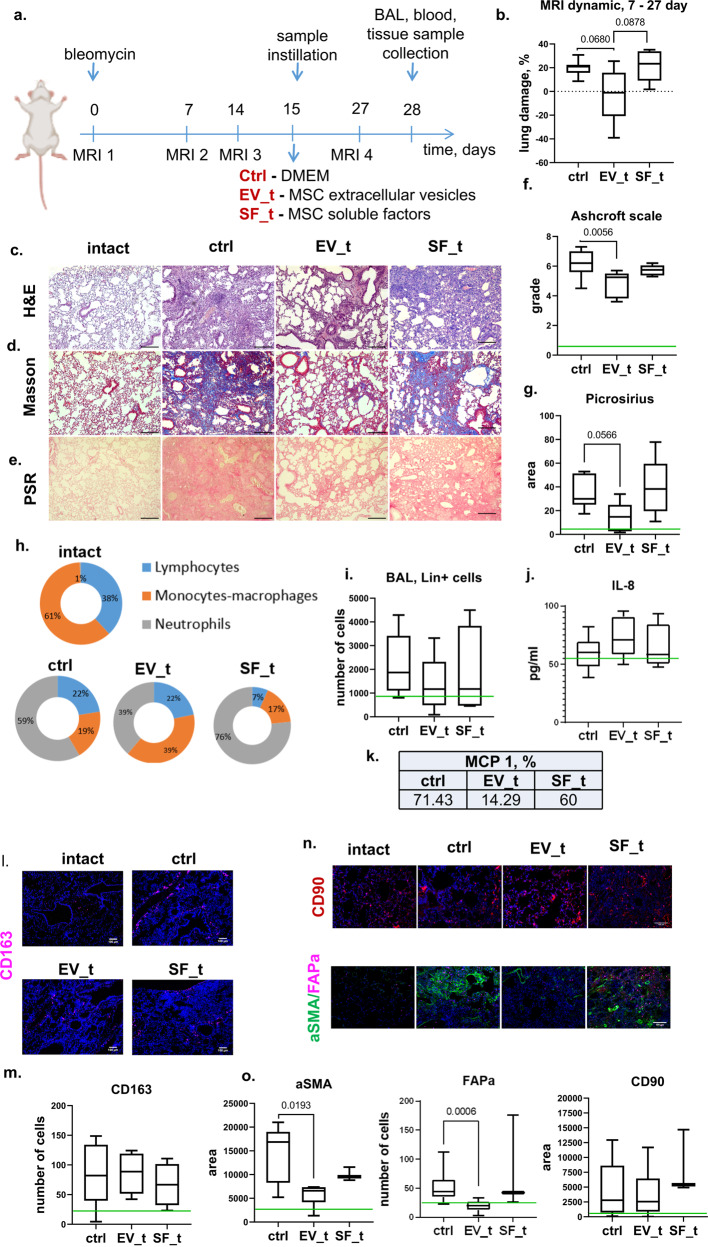
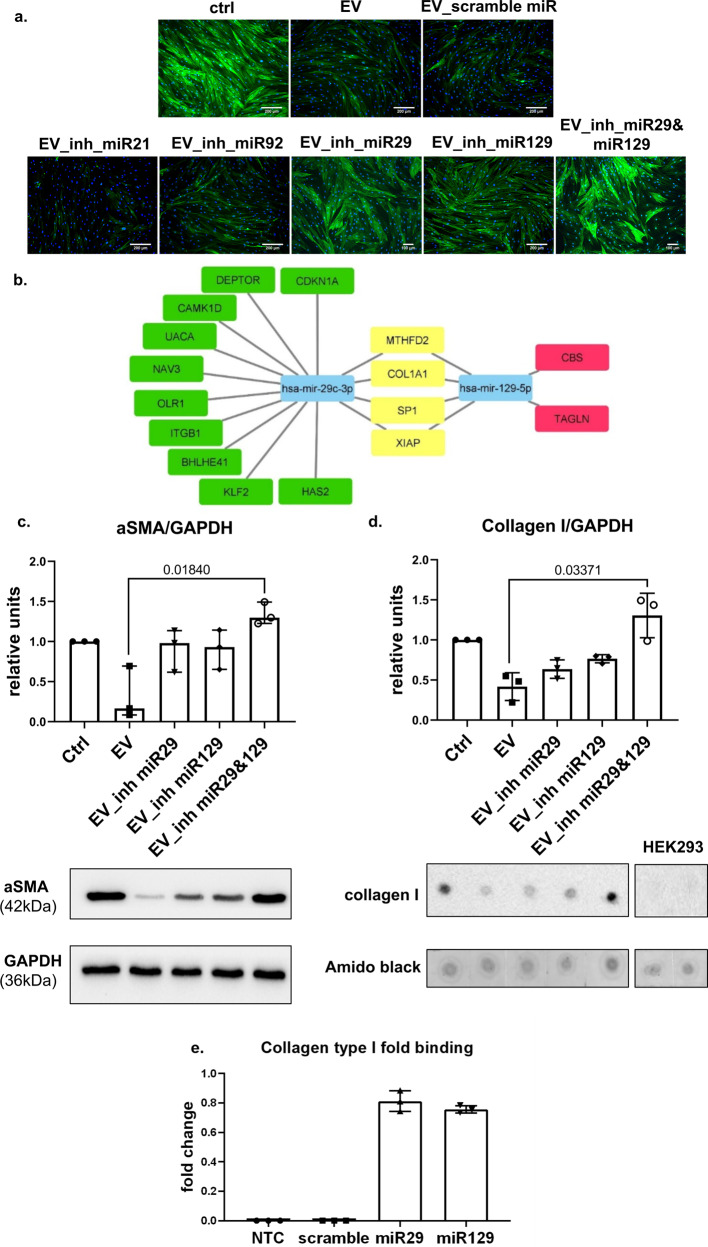
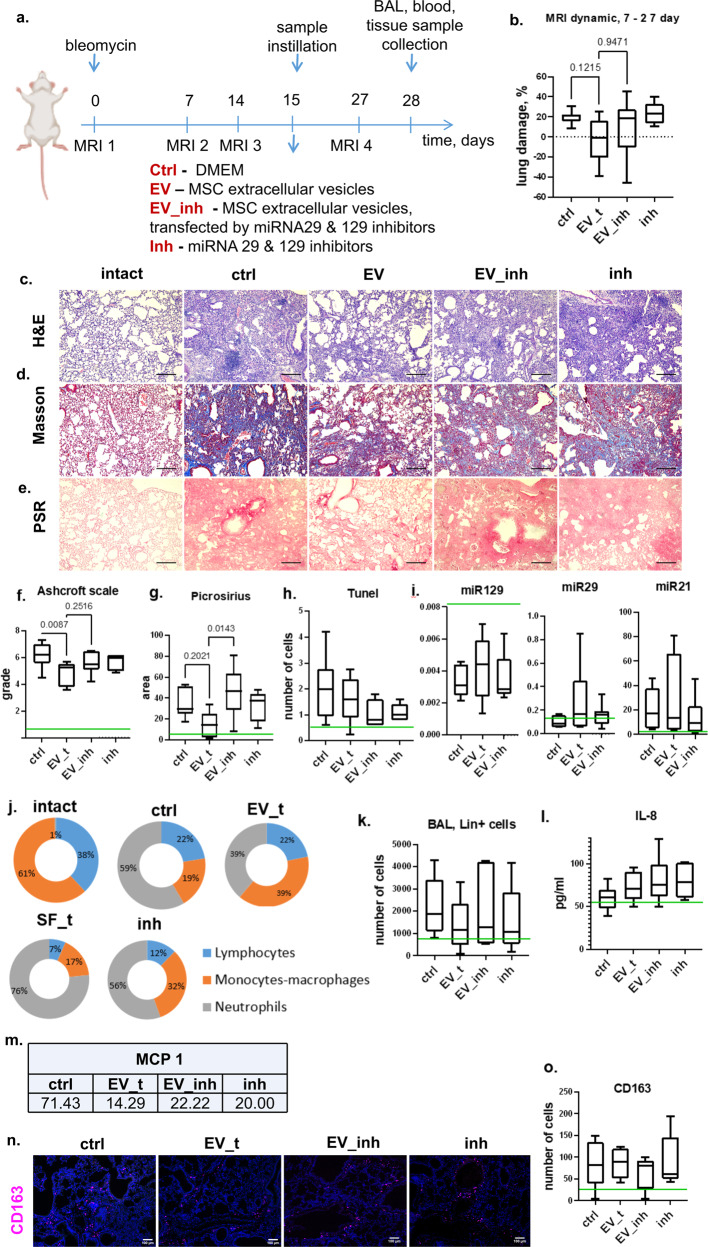
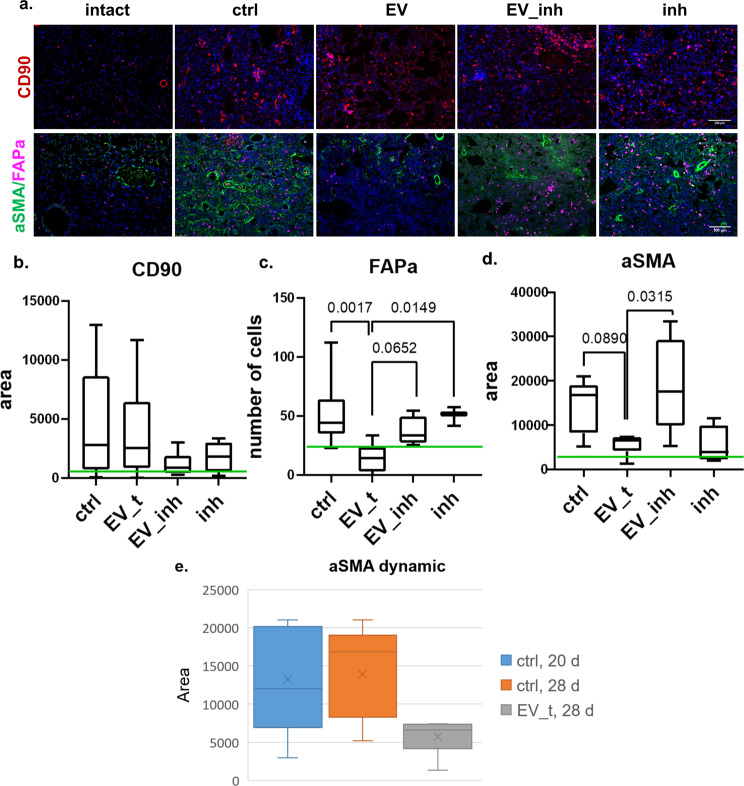
To date, pulmonary fibrosis remains an unmet medical need. In this study, we evaluated the potency of mesenchymal stromal cell (MSC) secretome components to prevent pulmonary fibrosis development and facilitate fibrosis resolution. Surprisingly, the intratracheal application of extracellular vesicles (MSC-EVs) or the vesicle-depleted secretome fraction (MSC-SF) was not able to prevent lung fibrosis when applied immediately after the injury caused by bleomycin instillation in mice. However, MSC-EV administration induced the resolution of established pulmonary fibrosis, whereas the vesicle-depleted fraction did not. The application of MSC-EVs caused a decrease in the numbers of myofibroblasts and FAPa+ progenitors without affecting their apoptosis. Such a decrease likely occurred due to their dedifferentiation caused by microRNA (miR) transfer by MSC-EVs. Using a murine model of bleomycin-induced pulmonary fibrosis, we confirmed the contribution of specific miRs (miR-29c and miR-129) to the antifibrotic effect of MSC-EVs. Our study provides novel insights into possible antifibrotic therapy based on the use of the vesicle-enriched fraction of the MSC secretome.


Conflict of interest statement

The authors declare no competing interests.

Figures

Fig. 1
Fig. 1. MSC-EV biodistribution in the lung region measured via fluorescence imaging (FI).
a Representative FI images acquired in the posterior position in healthy mice treated intravenously (IV) or intratracheally (IT) with labeled hMSC-EVs or with an equal volume of phosphate-buffered saline (PBS) (CTR). Additional FI images show mice following the IT administration of bleomycin 2 weeks before treatment with the same amount of labeled hMSC-EVs (BLEO). A total of 16 healthy mice were treated IV or IT with labeled hMSC-EVs; four mice received the same amount of labeled hMSC-EVs 2 weeks after bleomycin application. b Quantification of fluorescence intensity in regions-of-interest (ROI) drawn free hand in the lung region, expressed as the average radiance efficiency normalized to the CTR group. *P < 0.05. c Uptake of labeled hMSC-EVs (green/red) by fibroblasts and endothelial (HUVEC) and epithelial (A549) cells after 48 h of incubation in vitro. d Visualization of labeled hMSC-EVs (green) in the epithelial cells and surrounding stromal cells on lung cryosections 1 and 24 h after intratracheal administration; cell nuclei are labeled with DAPI.
Fig. 2
Fig. 2. MSC secretome components do not prevent pulmonary fibrosis development when applied during the acute injury period.
a Schematic design of the prevention of bleomycin-induced pulmonary fibrosis in C57BL/6 mice; Ctrl (DMEM 1 day after bleomycin administration), n = 11; EV_p (MSC extracellular vesicles 1 day after bleomycin administration), n = 9; SF_p (MSC soluble factors 1 day after bleomycin administration), n = 6, n = biologically independent animals per group. b Quantification of dynamic changes in the lung tissue density measured via MRI. ce Representative image of c hematoxylin–eosin (H&E), d Masson trichrome, and e Picrosirius Red (PSR) staining. Scale bar = 100 μm. f Quantification of pulmonary fibrosis severity using the Ashcroft scale. The assessment was conducted by two independent blinded experts. g Quantification of ECM deposition on PSR staining images. h Quantification of immune cell types in BAL smears. The assessment was performed by two independent blinded experts. i Quantification of the major hematopoietic cell lineages in the BAL fluid via flow cytometry. j Quantification of IL-6 in the BAL using ELISAs. k Percentage of animals with a detected rate of MCP-1 in the BAL via ELISAs. l Representative images of pulmonary tissue immunocytochemical analysis for CD163. Scale bar = 100 μm. m Quantification of CD163-positive cells in pulmonary tissue. n Representative images of pulmonary tissue immunocytochemical analysis for CD90 (top panel), aSMA (green), and fibroblast activation protein A (FAPa, red) (bottom panel) expression. Scale bar = 100 μm. oq Quantification of CD90- (o), aSMA- (p), and FAPa- (q) positive cells measured by average cell area (c, d) or number of cells (e) in the pulmonary tissue sections, n = 4, n = biological independent animals per group. The number of analyzed fields of view per sample = 5–9. The green line indicates the median for the intact group.
Fig. 3
Fig. 3. MSC-EVs attenuate pulmonary fibrosis and may cause its resolution.
a Schematic design of the treatment of bleomycin-induced pulmonary fibrosis in C57BL/6 mice; Ctrl (DMEM 14 days after bleomycin administration), n = 11; EV_t (MSC extracellular vesicles 14 days after bleomycin administration), n = 9; SF_t (MSC soluble factors 14 days after bleomycin administration), n = 6; n = biologically independent animals per group. b Quantification of dynamic changes in the lung tissue density measured via MRI. ce Representative image of c hematoxylin–eosin (H&E), d Masson trichrome, and e Picrosirius Red (PSR) staining. Scale bar = 100 μm. f Quantification of pulmonary fibrosis severity using the Ashcroft scale. The assessment was performed by two independent blinded experts. g Quantification of ECM deposition on the PSR staining image. h Quantification of immune cell types in BAL fluid smears. The assessment was performed by two independent blinded experts. i Quantification of the major hematopoietic cell lineages in the BAL fluid via flow cytometry. j Quantification of IL-6 in the BAL fluid using ELISAs. k Percentage of animals with a detected rate of MCP-1 in the BAL fluid using ELISAs. l Representative images of pulmonary tissue immunocytochemical analysis for CD163. Scale bar = 100 μm. m Quantification of CD163-positive cells in pulmonary tissue. n Representative images of pulmonary tissue immunocytochemical analysis for aSMA, FAPa, and CD90. Scale bar = 100 μm. o Quantification of FAPa-positive cells or CD90+ and aSMA+ areas in pulmonary tissue. The green line indicates the median for the intact group.
Fig. 4
Fig. 4. MSC-EVs stimulate myofibroblast dedifferentiation through the transfer of miR-29c and miR-129 in vitro.
a Representative image of myofibroblast immunocytochemical analysis for αSMA expression. Scale bar = 200 μm. n = 4 biological independent experiments. b Bioinformatics analysis of specific and common targets for miR-29c and miR-129. c Western blot analysis of aSMA. n = 3 biological independent experiments. d Dot blot analysis of collagen type I. n = 3 biologically independent experiments. HEK293 cells were used as a negative control for antibody labeling. e Biotinylated microRNA pulldown assay for miR-29c and miR-129 and their target collagen type I. NTC no template control, n = 3 biological independent experiments.
Fig. 5
Fig. 5. Transfer of microRNA-29c and microRNA-129 mediates the effects of MSC-EVs on pulmonary fibrosis resolution.
a Schematic design of the treatment of bleomycin-induced fibrosis in C57BL/6 mice; Ctrl (DMEM 14 days after bleomycin administration), n = 11; EV_t (MSC extracellular vesicles 14 days after bleomycin administration), n = 9; EV_inh (MSC extracellular vesicles transfected by miRNA-29 and miRNA-129 inhibitors 14 days after bleomycin administration), n = 9; inh (miRNA-29 and miRNA-129 inhibitors 14 days after bleomycin administration), n = 5; n = biologically independent animals per group. b Quantification of dynamic changes in the lung tissue density measured via MRI. ce Representative image of c hematoxylin–eosin (H&E), d Masson trichrome, and e Picrosirius Red (PSR) staining. Scale bar = 100 μm. f Quantification of pulmonary fibrosis severity using the Ashcroft scale. The assessment was conducted by two independent blinded experts. g Quantification of ECM deposition on the PSR staining image. h Quantification of apoptotic cells in the pulmonary tissue measured via TUNEL staining. i PCR analysis of the miRNA-129, miRNA-29c, and miRNA-21 levels in the lung tissue. j Quantification of immune cell types on the BAL smears. The assessment was conducted by two independent blinded experts. k Quantification of the major hematopoietic cell lineages in the BAL fluid via flow cytometry. l Quantification of IL-6 in the BAL fluid using ELISAs. m Percentage of animals with a detected rate of MCP-1 in the BAL using ELISA. n Representative images of pulmonary tissue immunocytochemical analysis for CD163. Scale bar = 100 μm. o Quantification of CD163-positive cells in the pulmonary tissue. The green line indicates the median for the intact group.
Fig. 6
Fig. 6. MSC-EVs stimulate the dedifferentiation of myofibroblasts and myofibroblast precursors (FAPa+) in fibrotic pulmonary tissue through the transfer of miR-29c and miR-129 in vivo.
a Representative images of pulmonary tissue immunocytochemical analysis for CD90 (top panel), aSMA (green), and fibroblast activation protein A (FAPa, red) (bottom panel) expression. Scale bar = 100 μm. bd Quantification of CD90- (c), aSMA- (d), and FAPa- (e) positive cells measured by average cell area (c, d) or number of cells (e) in pulmonary tissue sections. The green line indicates the median for the intact group. Ctrl (DMEM 14 days after bleomycin administration), n = 11; EV_t (MSC extracellular vesicles 14 days after bleomycin administration), n = 9; EV_inh (MSC extracellular vesicles transfected by miRNA-29c and miRNA-129 inhibitors 14 days after bleomycin administration), n = 9; inh (miRNA-29c and miRNA-129 inhibitors 14 days after bleomycin administration), n = 5; n = biologically independent animals per group. The number of analyzed fields of view per sample = 5–9. e aSMA dynamics.

References

    1. Herrera J, et al. Registration of the extracellular matrix components constituting the fibroblastic focus in idiopathic pulmonary fibrosis. JCI Insight. 2019;4:e125185. doi: 10.1172/jci.insight.125185. - DOI - PMC - PubMed
    1. Abreu SC, Lopes-Pacheco M, Weiss DJ, Rocco PRM. Mesenchymal stromal cell-derived extracellular vesicles in lung diseases: current status and perspectives. Front. Cell Dev. Biol. 2021;15:600711. doi: 10.3389/fcell.2021.600711. - DOI - PMC - PubMed
    1. Fan XL, Zhang Y, Li X, Fu QL. Mechanisms underlying the protective effects of mesenchymal stem cell-based therapy. Cell. Mol. Life Sci. 2020;77:2771–2794. doi: 10.1007/s00018-020-03454-6. - DOI - PMC - PubMed
    1. Gatti S, et al. Microvesicles derived from human adult mesenchymal stem cells protect against ischaemia-reperfusion-induced acute and chronic kidney injury. Nephrol. Dial. Transpl. 2011;26:1474–1483. doi: 10.1093/ndt/gfr015. - DOI - PubMed
    1. Tan CY, et al. Mesenchymal stem cell-derived exosomes promote hepatic regeneration in drug-induced liver injury models. Stem Cell Res. Ther. 2014;5:76. doi: 10.1186/scrt465. - DOI - PMC - PubMed

Publication types