. 2023 Jul;55(7):1437-1450.
doi: 10.1038/s12276-023-01027-8. Epub 2023 Jul 3.

Prolyl endopeptidase remodels macrophage function as a novel transcriptional coregulator and inhibits fibrosis

Affiliations

Prolyl endopeptidase remodels macrophage function as a novel transcriptional coregulator and inhibits fibrosis

Shuang-Zhe Lin et al. Exp Mol Med. 2023 Jul.

Abstract

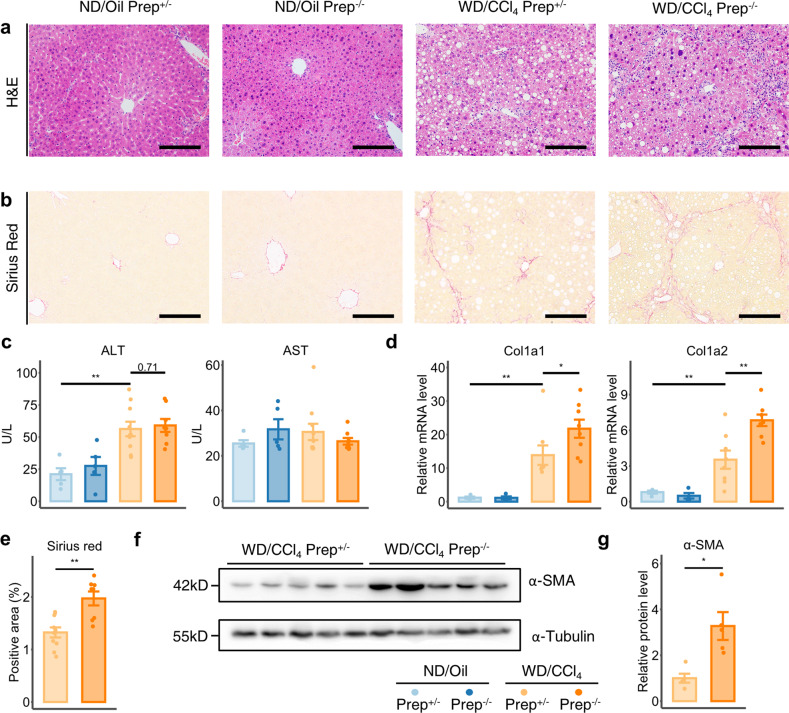
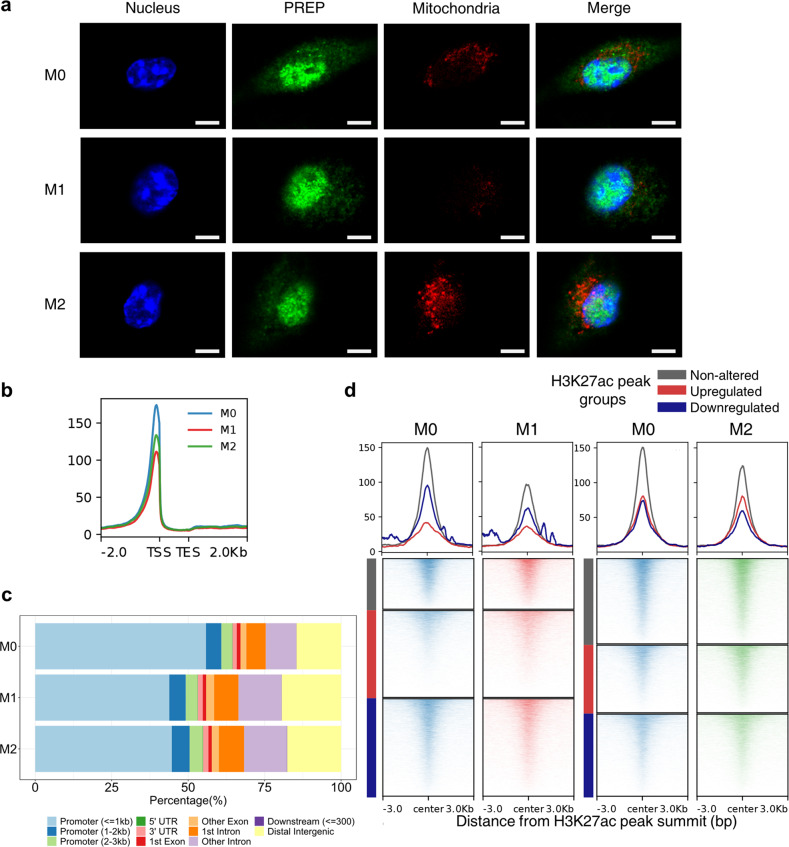
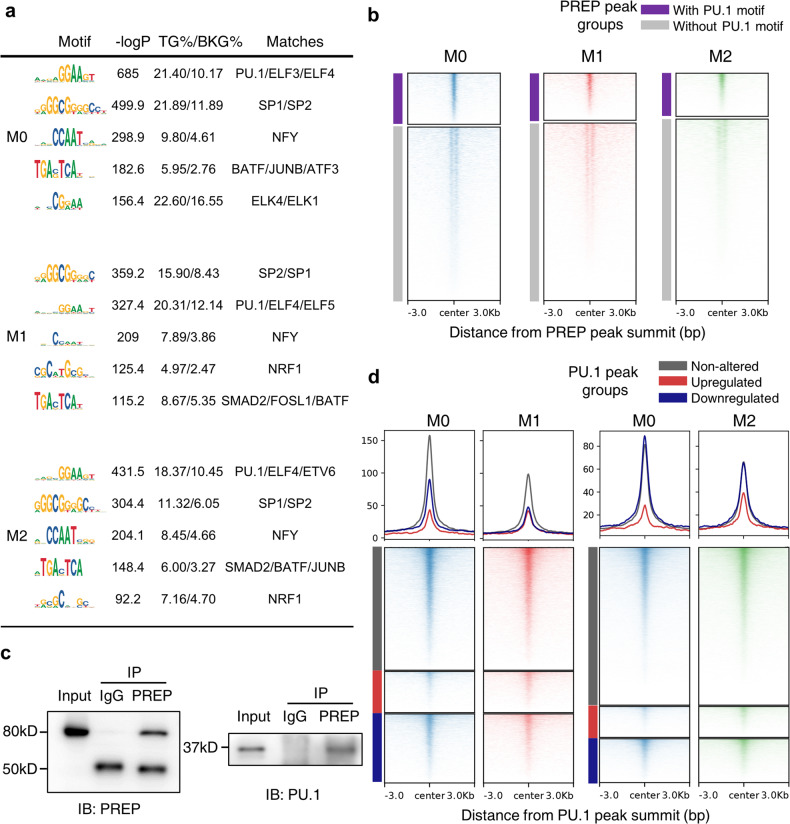
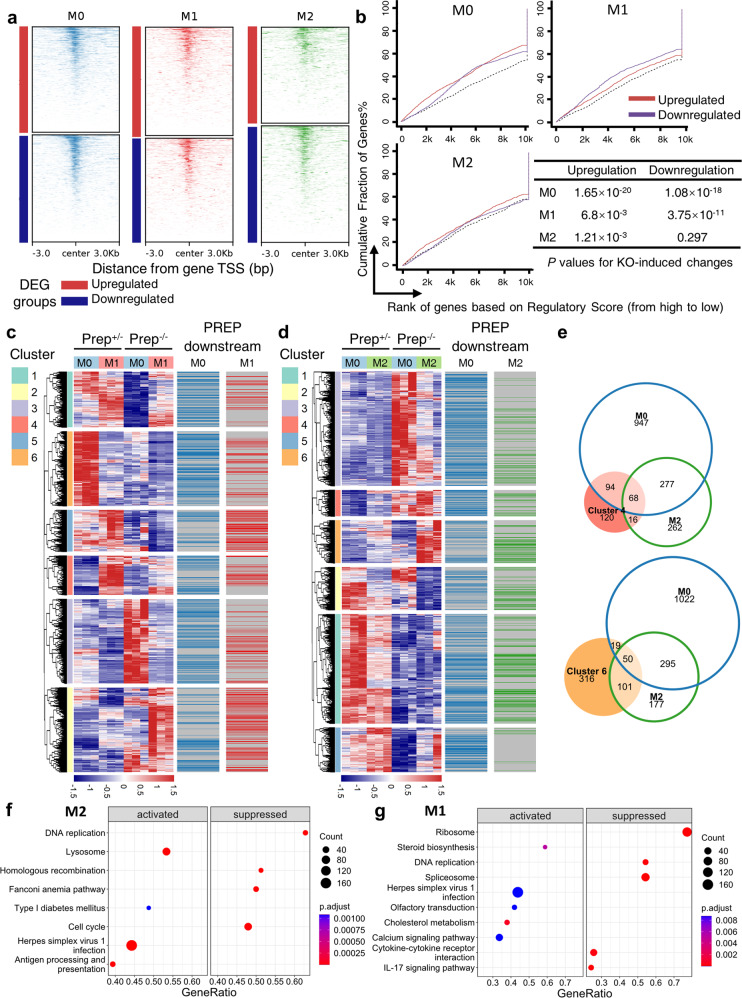
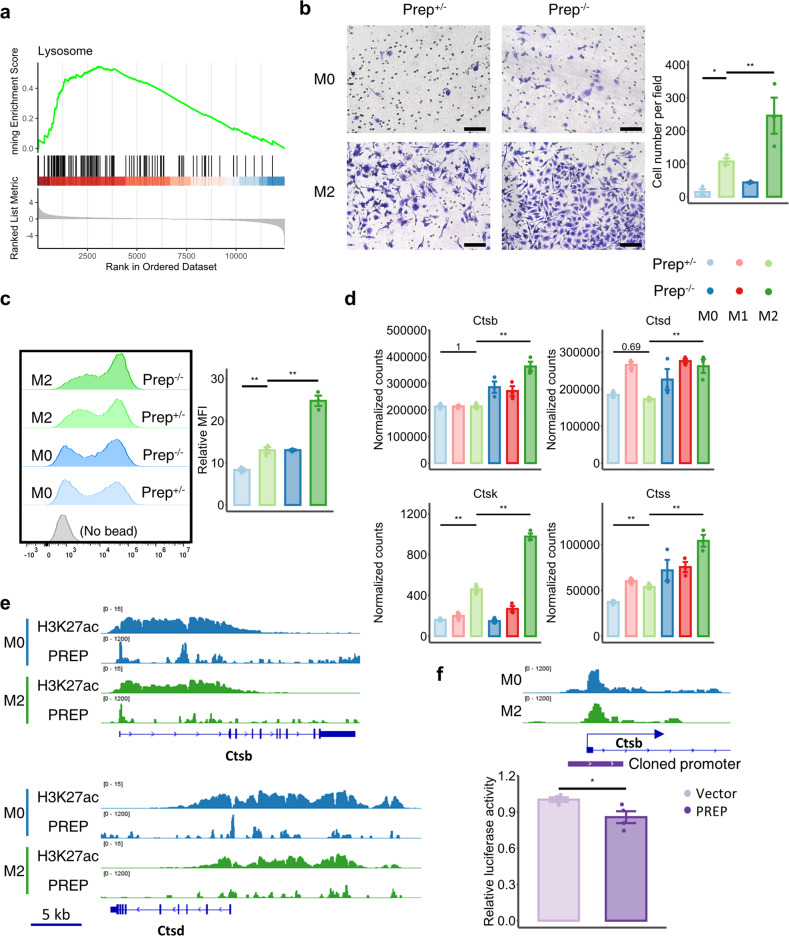
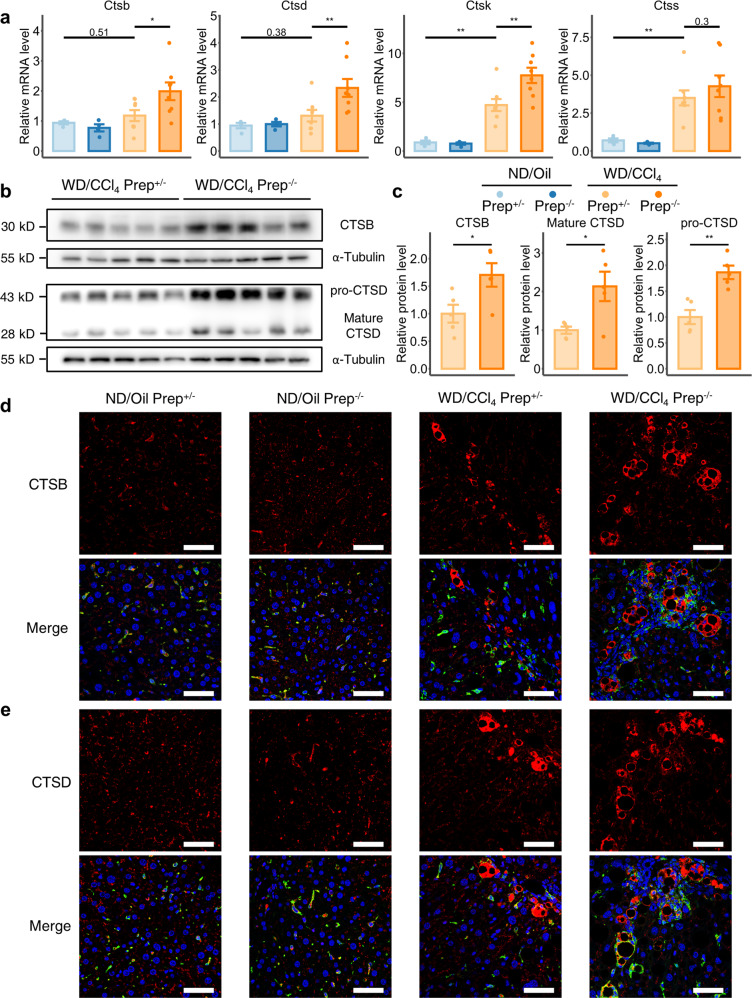
Macrophages are immune cells crucial for host defense and homeostasis maintenance, and their dysregulation is involved in multiple pathological conditions, such as liver fibrosis. The transcriptional regulation in macrophage is indispensable for fine-tuning of macrophage functions, but the details have not been fully elucidated. Prolyl endopeptidase (PREP) is a dipeptidyl peptidase with both proteolytic and non-proteolytic functions. In this study, we found that Prep knockout significantly contributed to transcriptomic alterations in quiescent and M1/M2-polarized bone marrow-derived macrophages (BMDMs), as well as aggravated fibrosis in an experimental nonalcoholic steatohepatitis (NASH) model. Mechanistically, PREP predominantly localized to the macrophage nuclei and functioned as a transcriptional coregulator. Using CUT&Tag and co-immunoprecipitation, we found that PREP was mainly distributed in active cis-regulatory genomic regions and physically interacted with the transcription factor PU.1. Among PREP-regulated downstream genes, genes encoding profibrotic cathepsin B and D were overexpressed in BMDMs and fibrotic liver tissue. Our results indicate that PREP in macrophages functions as a transcriptional coregulator that finely tunes macrophage functions, and plays a protective role against liver fibrosis pathogenesis.


Conflict of interest statement

The authors declare no competing interests.

Figures

Fig. 1
Fig. 1. Prep gene ablation significantly alters the transcriptome in unpolarized (M0) and M1/M2-polarized murine bone marrow-derived macrophages (BMDMs).
a Strategy used to generate differentially polarized BMDMs from Prep+/- and Prep-/- mice (created with BioRender.com). b-e Bulk RNA-seq data obtained from differentially polarized BMDMs of Prep+/- and Prep-/- mice. A Principal component analysis (PCA) was performed (b). Bar plots showing representative gene expression of M1/M2 polarization markers, with significance symbols representing the p-adj value obtained from DESeq2 (c). Differentially expressed genes (DEGs) between Prep-/- and Prep+/- BMDMs (Prep-/- vs. Prep+/-) in the M0, M1 or M2 state are presented in a heatmap (d) and volcano plots (e). Each group comprised three biological replicates. f Venn diagram showing the overlapping Prep knockout-induced upregulated or downregulated DEGs among M0, M1 and M2 BMDMs. Data information: Bars represent the mean ± SEM. *p < 0.05, **p < 0.01.
Fig. 2
Fig. 2. Prep gene ablation exacerbates WD/CCl4-induced murine liver fibrosis.
a, b Representative image of H&E-stained (a) and Sirius red-stained (b) liver sections of Prep+/- and Prep-/- mice treated with WD/CCl4 or ND/Oil. Scale bar indicates 100 μm. c Serum ALT and AST levels of Prep+/- and Prep-/- mice treated with WD/CCl4 or ND/Oil. The results were compared via one-way ANOVA and LSD post hoc test. n = 10 for WD/CCl4-treated Prep+/- mice group; n = 8 for WD/CCl4-treated Prep-/- mice group; n = 5 for ND/Oil-treated groups. (d) Relative mRNA levels of Col1a1 and Col1a2 in Prep+/- and Prep-/- mice treated with WD/CCl4 or ND/Oil. The results were compared by one-way ANOVA and LSD post hoc test. e Semiquantitative analysis of Sirius red-stained areas in Prep+/- and Prep-/- mice treated with WD/CCl4. The results were compared by unpaired two-tailed Student’s t test. n = 10 for Prep+/- mice group; n = 8 for Prep-/- mice group. f, g Western blot analysis (f) was performed on liver tissue lysates of Prep+/- and Prep-/- mice treated with WD/CCl4 for α-smooth muscle actin (α-SMA) and the housekeeping control α-tubulin; densitometry results (g) were normalized to the level of α-tubulin and compared by unpaired two-tailed Student’s t test. n = 5 for each group. Data information: Bars represent the mean ± SEM. *p < 0.05, **p < 0.01.
Fig. 3
Fig. 3. Prolyl endopeptidase is predominantly localized in the nuclei of macrophages and shows dynamic chromatin distribution during M1/M2 polarization.
a Confocal immunofluorescence images showing the subcellular localization of prolyl endopeptidase (PREP) in BMDMs in the M0, M1 or M2 state. Nuclei and mitochondria were labeled with DAPI and MitoTracker Red, respectively. Scale bar indicates 5 μm. b The average enrichment profile of PREP CUT&Tag signals ± 2 kb around genic regions of BMDMs. TSS, transcription start site; TES, transcription end site. c Barplot showing the PREP CUT&Tag peak distribution among different genomic features. d The average enrichment profile and heatmap showing PREP CUT&Tag signals ± 3 kb around H3K27ac ChIP peaks classified by alterations during M1/M2 polarization of BMDMs.
Fig. 4
Fig. 4. PREP interacts with PU.1.
a De novo motif enrichment analysis of PREP CUT&Tag peaks using a GC-matched genomic background. The top 5 motifs under each state are shown with summary statistics and the predicted matching transcription factors. b The average enrichment heatmap showing PU.1 ChIP signals ± 3 kb around PREP CUT&Tag peaks with/without the PU.1 motif in M0/M1/M2 BMDMs. c Coimmunoprecipitation of PREP and PU.1 in RAW264.7 cell protein extracts. d The average enrichment profile and heatmap of PREP CUT&Tag signals ± 3 kb around PU.1 ChIP peaks classified by alterations during the M1/M2 polarization of BMDMs.
Fig. 5
Fig. 5. The influence of PREP on the macrophage transcriptome is associated with PREP-mediated direct transcriptional regulation.
a Heatmap showing the average enrichment of PREP CUT&Tag signals ± 3 kb around the TSS of upregulated and downregulated DEGs in the M0/M1/M2 state. b Activating/repressive function prediction of the PREP CUT&Tag peaks in M0/M1/M2 BMDMs by BETA (binding and expression target analysis) using PREP CUT&Tag-seq (in Prep+/- BMDMs in the M0/M1/M2 state) and RNA-seq (of Prep-/- and Prep+/- BMDMs in the M0/M1/M2 state). The genes are cumulated by rank on the basis of the regulatory potential score from high to low, according to PREP CUT&Tag-seq data. The cumulative fractions of upregulated, downregulated and unaffected (used as the background) genes after Prep knockout as determined by RNA-seq are denoted by the red, purple and black lines, respectively. P values for activating/repressive function prediction were determined by Kolmogorov–Smirnov test. c, d Heatmap illustrating the differentially expressed genes (DEGs) between Prep-/- and Prep+/- BMDMs (Prep-/- vs. Prep+/-) in M0 and M2 states (c), as well as in M0 and M1 states (d). The hierarchical clustering based on RNA-seq data, together with directly PREP-regulated downstream genes identified by BETA, is annotated on the left side of the heatmap. (e) Venn diagrams showing overlapping genes between clusters 4 and 6 according to hierarchical clustering and PREP-regulated direct downstream genes in BMDMs in the M0 and/or M2 state. f, g Dotplot summarizing the results from gene set enrichment analysis (GSEA) of KEGG pathways enriched in DEGs between Prep-/- and Prep+/- BMDMs (Prep-/- vs. Prep+/-) in the M2 state (f) and M1 state (g).
Fig. 6
Fig. 6. PREP-mediated transcriptional regulation inhibits the expression of cathepsins in M2 -polarized macrophages.
a Gene set enrichment analysis (GSEA) plot showing the KEGG pathway “lysosome” in the DEGs between the Prep-/- and Prep+/- BMDMs (Prep-/- vs. Prep+/-) in the M2 state. b Phagocytosis assay of the Prep-/- and Prep+/- BMDMs in the M0/M2 state. The left panel shows representative flow cytometry histograms of FITC fluorescence intensity, and the right panel shows the relative median fluorescence intensity (MFI) in the FITC channel. The results were compared by one-way ANOVA and LSD post hoc test. n = 3 for each group. c Invasion assay of the Prep-/- and Prep+/- BMDMs in the M0/M2 state. Scale bar indicates 100 μm. The left panel shows representative microscopic fields, and the right panel shows the cell numbers per field. The results were compared by one-way ANOVA and LSD post hoc test. n = 3 for each group. d Representative gene expression of cathepsins in the bulk RNA-seq data obtained from differentially polarized BMDMs of Prep+/- and Prep-/- mice. e Representative PREP CUT&Tag peak tracks showing H3K27ac deposition and PREP distribution at the Ctsb and Ctsd, Ctsk and Ctss gene loci in BMDMs in the M0 and M2 states. f Relative luciferase activity of the Ctsb promoter in NIH-3T3 cells transfected with the PREP overexpression plasmid or control plasmid. The results were compared by unpaired two-tailed Student’s t test. n = 4 for each group. The relationship between the cloned Ctsb promoter and PREP distribution in BMDMs in the M0 and M2 states is shown. Data information: Bars represent the mean ± SEM. *p < 0.05, **p < 0.01.
Fig. 7
Fig. 7. Profibrogenic cathepsin B and D are further upregulated in WD/CCl4-induced liver fibrosis after mouse Prep gene ablation.
a Relative mRNA levels of the cathepsin family in Prep+/- and Prep-/- mice treated with WD/CCl4 or ND/Oil. The results were compared by one-way ANOVA and LSD post hoc test. n = 8 for WD/CCl4-treated groups; n = 4 for ND/Oil-treated groups. b, c Western blot analysis (b) performed on liver tissue lysates of Prep+/- and Prep-/- mice treated with WD/CCl4. The level of cathepsin B (CTSB) and cathepsin D (CTSD) were based on the housekeeping control α-tubulin; the densitometry results (c) were normalized to the quantity of α-tubulin and compared by unpaired two-tailed Student’s t test. n = 5 for each group. d, e Representative confocal immunofluorescence images showing the tissue distribution of two cathepsin members (red), i.e., CTSB (d) and CTSD (e) in liver sections of Prep+/- and Prep-/- mice treated with WD/CCl4 or ND/Oil. Macrophages were labeled by IBA1 immunoreactivity (green). Nuclei were labeled by DAPI (blue). Scale bar indicates 50 μm. Data information: Bars represent the mean ± SEM. *p < 0.05, **p < 0.01.
Fig. 8
Fig. 8. Schematic showing PREP-mediated transcriptional regulation in hepatic macrophages during liver fibrosis (created with BioRender.com).
PREP prolyl endopeptidase, Pol polymerase, ECM extracellular matrix, CTSB cathepsin B, and CTSD cathepsin D.

References

    1. Cox, N., Pokrovskii, M., Vicario, R. & Geissmann, F. Origins, Biology, and Diseases of Tissue Macrophages. Annu Rev Immunol. 39, 313–344 (2021). - PMC - PubMed
    1. Okabe Y, Medzhitov R. Tissue biology perspective on macrophages. Nat. Immunol. 2016;17:9–17. doi: 10.1038/ni.3320. - DOI - PubMed
    1. Mosser DM, Hamidzadeh K, Goncalves R. Macrophages and the maintenance of homeostasis. Cell Mol. Immunol. 2021;18:579–587. doi: 10.1038/s41423-020-00541-3. - DOI - PMC - PubMed
    1. Aegerter H, Lambrecht BN, Jakubzick CV. Biology of lung macrophages in health and disease. Immunity. 2022;55:1564–1580. doi: 10.1016/j.immuni.2022.08.010. - DOI - PMC - PubMed
    1. Guilliams M, Scott CL. Liver macrophages in health and disease. Immunity. 2022;55:1515–1529. doi: 10.1016/j.immuni.2022.08.002. - DOI - PubMed

Publication types

Substances