. 2023 Sep;10(26):e2301763.
doi: 10.1002/advs.202301763. Epub 2023 Jul 3.

Effect of Extracellular Ribonucleic Acids on Neurovascularization in Osteoarthritis

Affiliations

Effect of Extracellular Ribonucleic Acids on Neurovascularization in Osteoarthritis

Wen-Pin Qin et al. Adv Sci (Weinh). 2023 Sep.

Abstract

Osteoarthritis is a degenerative disease characterized by abnormal neurovascularization at the osteochondral junctions, the regulatory mechanisms of which remain poorly understood. In the present study, a murine osteoarthritic model with augmented neurovascularization at the osteochondral junction is used to examine this under-evaluated facet of degenerative joint dysfunction. Increased extracellular RNA (exRNA) content is identified in neurovascularized osteoarthritic joints. It is found that the amount of exRNA is positively correlated with the extent of neurovascularization and the expression of vascular endothelial growth factor (VEGF). In vitro binding assay and molecular docking demonstrate that synthetic RNAs bind to VEGF via electrostatic interactions. The RNA-VEGF complex promotes the migration and function of endothelial progenitor cells and trigeminal ganglion cells. The use of VEGF and VEGFR2 inhibitors significantly inhibits the amplification of the RNA-VEGF complex. Disruption of the RNA-VEGF complex by RNase and polyethyleneimine reduces its in vitro activities, as well as prevents excessive neurovascularization and osteochondral deterioration in vivo. The results of the present study suggest that exRNAs may be potential targets for regulating nerve and blood vessel ingrowth under physiological and pathological joint conditions.

Keywords: extracellular RNA; neurovascularization; osteoarthritis; osteochondral junction; vascular endothelial growth factor.


Conflict of interest statement

The authors declare no conflict of interest.

Figures
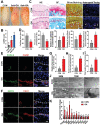
Figure 1
Figure 1
Extent of neurovascularization in OA. A,B) Representative photographs of the condyles derived from C57BL/6 mice (viewed from the top) (A), and the corresponding OARSI scores in each group (B). C,D) Representative images of H&E staining, SF staining, silver staining, and anterograde tracing of the murine condyles in the control (CON) and osteoarthritic (OA) groups at 3 weeks (C), with the corresponding statistical results (D). Arrows indicate nerve fibers. E) Representative images of PGP9.5 (green) and CGRP (red) co‐stained cells along the TMJ osteochondral junction in the CON and OA groups, at 3 weeks. F) Representative images of EMCN (green) and CD31 (red) co‐stained cells along the TMJ osteochondral junction in the CON and OA groups at 3 weeks. G,H) Semi‐statistical analysis of nerve (G) and neovascularization (H) in (E) and (F), respectively. I,J) Representative images of SEM and TEM of the mouse condyles in the CON group, and unilateral anterior crossbite (UAC) group, at 3 weeks (I), and the corresponding statistical results (J). Arrows and arrow heads in the SEM image indicate micro‐fractures and bone resorption pits, respectively. Arrows and arrow heads in the TEM image indicate new blood vessels and their accompanying nerves, respectively. K) qRT‐PCR analysis of the gene expression of neuro‐vascularization factors (Pdgfb, Ngf, Vegf, Hif1α, Hif2α, Ntn1, Ntn3, Ntn4, Slit1, Slit3, Slit4) in the condylar cartilage and subchondral bone in the two groups. Scale bars = 1 mm (A), 70 µm (C), 20 µm (E,F), and 10 µm (J). Data are shown as the means and standard deviations; p < 0.05 (n = 3). Different letters indicated statistically significant differences.
Figure 2
Figure 2
Neuro‐vascularization was accompanied by a local increase in exRNA. A–C) Representative CLSM images of the distribution of exRNA along the osteochondral junction of TMJs derived from the CON and OA groups at 3 weeks. RNA, green; E‐cadherin and α‐tublin, red; DAPI, blue. Arrows denote exRNA. D) Semi‐statistical analysis of exRNA (C,D) results. E) Statistical analysis of exRNA in the condylar cartilage and subchondral bone of the two groups at 3 weeks. F) Pearson correlation analysis of the relative fluorescent areas occupied by nerves and exRNA (n = 6, R 2 = 0.7003, p = 0.0377). Similar analysis of the relative fluorescent areas occupied by neovascularization and exRNA in G (n = 6, R 2 = 0.8022, p = 0.0158). H,I) CLSM images taken from the osteochondral junction showing that exRNA is adjacent to the nerves (H) and blood vessels (I). Arrows indicated exRNA and arrowheads represented nerves and vessels. Scale bars = 20 µm (A–C) and 15 µm (H,I). Data are shown as the mean and standard deviation; p < 0.05 (n = 3). Different letters indicated statistically significant differences.
Figure 3
Figure 3
exRNA does not directly promote the function of TG cells and EPCs. A) Representative microscopy images of TG cells showing the length of their dendrites and interactions after treatment for 24 h. B) Representative light microscopy images of EPCs showing migrated cells, cell migration, and tube formation, after treatment for 24 h. C,D) Quantification of dendritic length and interactions of TGs. E,F) Quantification of the numbers and distance of migrated EPCs. Scale bars = 50 µm (A), 100 µm (left and right in B), and 500 µm (middle in B). Data are shown as the mean and standard deviation; p < 0.05 (n = 3). Different letters indicate statistically significant differences.
Figure 4
Figure 4
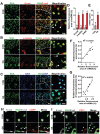
exRNA co‐localized with VEGF at the osteochondral junction. A) exRNA isolated from osteoarthritic condyles were examined with ICP‐MS to determine the concentration of the sulfur element. Veh refers to the vehicle (i.e., the elution buffer). B) Representative images illustrating the co‐localization of exRNA and VEGF at the osteochondral junction of osteoarthritic TMJs. Arrows indicated the co‐localization of exRNA and VEGF. C,D) The relative fluorescence area of VEGF (C) and the co‐localization of exRNA and VEGF (D) results. E) Pearson correlation analysis of the relative fluorescence area of VEGF and exRNA (n = 6, R 2 = 0.7600, p = 0.0236). F) The NanoDrop test verified the existence of the OD260‐positive fraction in the eluate containing the VEGF‐antibody affinity purified complex. Veh referred to vehicle (i.e., the 0.1 m glycine solution). Scale bars = 15 µm (B). Data are shown as the means and standard deviations; p < 0.05 (n = 3). Different letters indicate statistically significant differences.
Figure 5
Figure 5
VEGF binds to RNA. A) Design of the in vitro experiment. B) CLSM images showing that VEGF binds more efficiently to RNA(50 nt) than RNA(15 nt). C) Data in (B) were analyzed quantitatively. D) Size distribution of VEGF, RNA(50 nt), RNA(50 nt)‐VEGF, and the corresponding statistical analysis. E) Zeta potential of VEGF, RNA(50 nt), RNA(50 nt)‐VEGF, and the corresponding statistical analysis. F) Time‐lapse images of the RNA(50 nt)‐VEGF phase separation, and the corresponding statistical results. Liquid droplets formed after mixing of recombinant VEGF (Alexa Fluor 488‐labeled) with RNA(50 nt) (Cy3‐labeled) and matured over 15 min. The images shown are representative of all fields in the well. Scale bars = 30 µm (B), 10 µm (F). Data are shown as the means and standard deviations; p < 0.05 (n = 3). Different letters indicate statistically significant differences.
Figure 6
Figure 6
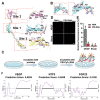
VEGF binds to RNA through electrostatic interaction. A,B) Binding patterns between RNA(50 nt) and VEGF (A), and between VEGF and RNA(15 nt) (B). The stick model represents RNA(50 nt). The cartoon represents VEGF. Light blue represents Site 1, carmine represents Site 2, and yellow represents Site 3. C) Design of the in vitro experiment. D) CLSM images showing that the cationic polymer PEI disrupts the interaction between RNA(50 nt) and VEGF. E) Data in (D) were analyzed quantitatively. Scale bars = 30 µm (D). F) Predicted intrinsically disordered regions of VEGF, NTF3, and FGF23. These processes were conducted by VSL2 in PONDR. Data are shown as the means and standard deviations; p < 0.05 (n = 3). Different letters indicate statistically significant differences.
Figure 7
Figure 7
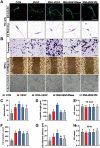
The exRNA‐VEGF complex stimulates angiogenesis and neurogenesis more than VEGF alone. A) Representative images of TG cells showing the length of their dendrites and their interactions after treatment for 24 h. B) Representative light microscopy images of EPCs showing cell migration and tube formation after treatment for 24 h. C,D) Quantification of dendritic length and interactions of TGs. E) CCK‐8 assay of the viability of TGs under the stimulation of different groups. F,G) Quantification of the numbers and distance of migrated EPCs. H) CCK‐8 assay of the viability of EPCs under the stimulation of different groups. Scale bars = 50 µm (A), 100 µm (top and bottom in B), and 500 µm (middle in B). Data are shown as the mean and standard deviation; p < 0.05 (n = 3). Different letters indicate statistically significant differences.
Figure 8
Figure 8
The exRNA‐VEGF complex promotes angiogenesis and neurogenesis through action on VEGFR2. A) Representative microscopy images of TG cells showing the dendritic length and interactions after 24 h treatment. B) Representative light microscopy images of EPCs showing migrated cells, cell migration, and tube formation after 24 h treatment. C,D) Quantification of dendritic length and interactions of TGs. E,F) Quantification of the numbers and distance of migrated EPCs. G) Western blot results showing expression of VEGFR2 and p‐VEGFR2 of TG cells and EPCs after treatment for 24 h. Scale bars = 50 µm (A), 100 µm (top and bottom in B), and 500 µm (middle in B). Data are shown as the means and standard deviations; p < 0.05 (n = 3). Different letters indicate statistically significant differences.
Figure 9
Figure 9
RNA(50 nt) promotes binding between VEGF and the VEGFR2 extracellular segment. A) Binding pattern between RNA(50 nt)‐VEGF and VEGFR2 extracellular segment. B) Binding pattern between VEGF and VEGFR2 extracellular segment. The VEGFR2 extracellular segment is displayed as a blue ribbon, VEGF is displayed as a cyan ribbon, and RNA is displayed as an orange ribbon. C) Calculation of binding free energy between VEGFR2 extracellular segment and RNA‐VEGF complex/VEGF (kcal mol−1).
Figure 10
Figure 10
exRNA scavengers alleviate OA in murine TMJ. A) Schematic of the UAC mouse model and related interventions. B) Infrared spectra of OHA, PEI, and OHA‐PEI. C) SEM images of the surface of OHA‐PEI. D) Representative images of H&E and SF stainings of the condyles of the control (CON) and experimental (OA) groups at 3 weeks. E) Representative CLSM images of exRNA (i), macrophotographs (ii), nerves (CGRP, red), and vessels (CD31, red) (iii) after treatment. F–K) Statistical analysis of (D) and (E). L) Schematic summarizing the findings. During the progression of OA, exRNAs accumulated in the osteochondral junction. The exRNAs recruited positively‐charged neurovascular cytokines such as VEGF, and amplified the effect of VEGF on neurogenesis and angiogenesis. Veh referred to vehicle (i.e., saline). Scale bars = 70 µm (D), 1 mm (E, i), 20 µm (E, ii), 20 µm (E, iii). Data are shown as the mean and standard deviation; p < 0.05 (n = 3). Different letters indicated statistically significant differences.

References

    1. Wen C., Xiao G., J. Orthop. Translat. 2022, 32, A1. - PMC - PubMed
    1. Lu K., Ma F., Yi D., Yu H., Tong L., Chen D., J. Orthop. Translat. 2022, 32, 21. - PMC - PubMed
    1. Qin W. P., Zhang Z. B., Yan J. F., Han X. X., Niu L. N., Jiao K., Front. Bioeng. Biotechnol. 2022, 10, 901749. - PMC - PubMed
    1. Vincent TL T. L., Pain 2020, 161, S138. - PMC - PubMed
    1. Chen D. Y., Sun N. H., Chen X., Gong J. J., Yuan S. T., Hu Z. Z., Lu N. N., Körbelin J., Fukunaga K., Liu Q. H., Lu Y. M., Han F., J. Clin. Invest. 2021, 131. - PMC - PubMed

LinkOut - more resources