. 2023 Aug 11;51(14):e79.
doi: 10.1093/nar/gkad557.

PEPseq quantifies transcriptome-wide changes in protein occupancy and reveals selective translational repression after translational stress

Affiliations

PEPseq quantifies transcriptome-wide changes in protein occupancy and reveals selective translational repression after translational stress

Jakob Trendel et al. Nucleic Acids Res. .

Abstract

Post-transcriptional gene regulation is accomplished by the interplay of the transcriptome with RNA-binding proteins, which occurs in a dynamic manner in response to altered cellular conditions. Recording the combined occupancy of all proteins binding to the transcriptome offers the opportunity to interrogate if a particular treatment leads to any interaction changes, pointing to sites in RNA that undergo post-transcriptional regulation. Here, we establish a method to monitor protein occupancy in a transcriptome-wide fashion by RNA sequencing. To this end, peptide-enhanced pull-down for RNA sequencing (or PEPseq) uses metabolic RNA labelling with 4-thiouridine (4SU) for light-induced protein-RNA crosslinking, and N-hydroxysuccinimide (NHS) chemistry to isolate protein-crosslinked RNA fragments across all long RNA biotypes. We use PEPseq to investigate changes in protein occupancy during the onset of arsenite-induced translational stress in human cells and reveal an increase of protein interactions in the coding region of a distinct set of mRNAs, including mRNAs coding for the majority of cytosolic ribosomal proteins. We use quantitative proteomics to demonstrate that translation of these mRNAs remains repressed during the initial hours of recovery after arsenite stress. Thus, we present PEPseq as a discovery platform for the unbiased investigation of post-transcriptional regulation.


Figures

Graphical Abstract
Graphical Abstract
Figure 1.
Figure 1.
PEPseq captures RNA fragments UV-crosslinked to protein interactors. (A) Experimental outline for peptide-enhanced pull-down for RNA sequencing. Cells are 4SU labeled for 24 h, UV irradiated and protein-crosslinked RNA extracted with XRNAX. Trypsin digestion of the XRNAX input leaves behind peptides crosslinked to the RNA, whereas non-crosslinked peptides are removed using conventional silica columns. Ultrasonicated RNA fragments are applied for the pull-down and also sequenced as matched input control. For the pull-down primary amines are reacted to NHS-activated beads thereby covalently capturing fragments carrying crosslinking sites. Elution occurs with proteinase K, cleaving captured fragments off the beads while avoiding harsh elutions that release non-covalently captured background fragments. (B) Agarose gel electrophoresis comparing the NHS-mediated pull-down of protein-crosslinked RNA and non-crosslinked, protein-free RNA. Protein-free RNA (total RNA) was extracted from untreated MCF7 cells using standard silica spin columns with additional proteinase K digestion. The preparation of peptide-crosslinked RNA (peptide-XL-RNA) and the NHS-mediated pull-down occurred as described in (A). (C) Bar graph comparing nucleotide transition frequencies in unique sequencing reads for different versions of the PEPseq protocol and the previously published protein occupancy profiling by Schueler et al., all in MCF7 cells. The final protocol is displayed in red (proteinase K elution). For details see text. (D) Linegraph illustrating the combined read coverage around positions in the transcriptome with T-C transition frequencies ten times higher in the pull-down than in the input (red line, see also Figure S1B) or similar to the one in the input (light red line, see also Figure S1B). Coverage at each position was normalized to the maximum. (E) Bar graph comparing read counts within GENCODE RNA biotypes between the pull-down and input.
Figure 2.
Figure 2.
Changes in protein occupancy across mRNA upon arsenite-induced translational arrest. (A) Metagene plot summarizing T-C transitions in the 5’ untranslated region (5’UTR), the coding region (CDS) and the 3’ untranslated region (3’UTR) of all detected mRNAs in untreated (left), 15 min (middle) and 30 min (right) arsenite treated MCF7 cells. The T-C count was normalized to the length of each region for each particular transcript and to the number of reads mapping to mRNA in the individual sample. (B) Metagene plot illustrating the change in T-C transitions upon arsenite stress across all detected mRNAs. Ratios of ratios comparing the indicated time point to the untreated control, and normalizing the pull-down to the XRNAX input. Thick lines indicate ratio means, shaded areas one composite standard deviation. See also Figure S2C. (C) Same as in B but read coverage is used as proxy for protein occupancy instead of T-C transitions. See also Figure S2D.
Figure 3.
Figure 3.
The changing sequence context of protein–RNA crosslinking sites during translational arrest. (A–C) Linegraphs showing nucleotide frequencies around protein–RNA crosslinking sites on mRNA defined by 2-fold higher T-C transition frequency in the pull-down than in the matched input control. Within the 5’UTR (A), CDS (B) and 3’ UTR (C), the sequence context of crosslinks is compared between time points; for a comparison of all time points combined see Figure S3A. D)-F) Sequence logos for the most abundant motifs discovered in 100 nucleotide windows around protein–RNA crosslinking sites. The upper logos show motifs enriched in sequences from 30 min arsenite-treated cells compared to untreated cells (differential STREME analysis, see Materials and Methods), the lower logos from the inverse comparison (see also Supplementary Files 1). (G–I) Sequence logos of the position weight matrices reported by Ray et al. (24) for cytosolic RNA-binding proteins, whose binding sites showed the strongest enrichment in 100 nucleotide sequence windows around protein–RNA crosslinking sites in the 5′UTR (G), CDS (H) and 3′UTR (I) (see also Supplementary Files 2). The top three binding site motifs enriched in arsenite-treated cells compared to untreated cells are displayed on top, the inverse comparison below.
Figure 4.
Figure 4.
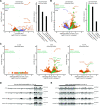
Arsenite stress leads to distinctive changes in protein occupancy across specific transcripts. (A) Left: volcano plot illustrating DEseq2 results for the combined effect between pull-down and XRNAX input upon 30 min arsenite stress. Each point represents one transcript/ gene. Right: ranked GO enrichment on protein coding transcripts in the DEseq2 analysis sorted by their foldchange. Shown are the top 3 non-redundant GO terms. (B) Same as in (A) but for the differential effect detected by DESeq2 between pull-down and XRNAX input. (C) Same as in (B) but for functional regions of protein coding transcripts. DEseq2 was applied to test for the differential effect within the 5’ UTR (left), CDS (middle) and 3’ UTR (right) using the differential effect between pull-down and XRNAX input. (D) Exemplary genome browser view for an iPO mRNA coding for a ribosomal protein with strongly increased protein occupancy in the CDS as detected in (C). More examples are shown in Figures S4D. (E) Exemplary genome browser view for an iPO mRNA with known cap-independent translation activity. See also Figure S4E.
Figure 5.
Figure 5.
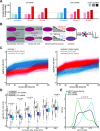
Protein production during the recovery from arsenite-induced translational arrest. (A) Barplot comparing the likelihood for a protein-crosslink detected by PEPseq to occur at a certain codon position. The frequency of protein crosslinks at each position was normalize to the frequency of this position to carry a T – the only base that can crosslink in 4SU-treated cells. (B) Experimental scheme for the quantification of nascent protein during recovery from arsenite stress. For details see text. (C) Timeline displaying the protein produced in MCF7 cells after 30 min of arsenite stress. Each line represents one protein. Only proteins quantified across all time points with a relative standard error of the mean (REM) smaller 30% are displayed. (D) Boxplot comparing the protein production after stress for all detected proteins (arsenite, untreated) to protein produced from iPO mRNAs. Proteins were filtered for REM < 30% within each time point and treatment. Testing occurred with a two-sided Kolmogorov-Smirnov test and Bonferroni–Holm correction. (E) Density plots comparing the GC3 content of mRNA groups.
Figure 6.
Figure 6.
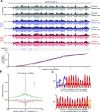
Changes in protein occupancy across the lncRNA MALAT1 during arsenite stress. (A) Gene browser view of MALAT1. For each replicate the pair of pull-down (up, dark) and the matched input (down, light) are shown. T-C transitions with an allele frequency >10% are indicated with black bars. For better visibility scaling is logarithmic and ranges in all plots from 0 to 3200 reads. Occurrence of the SRSF1/2 motifs GAAGAA are indicated below. The density plot at the bottom shows the cumulative distribution of T-C transitions along the transcript for each replicate of the pull-down. (B) Linegraphs showing nucleotide frequencies around protein–RNA crosslinking sites on mRNA defined by 2-fold higher T-C transition frequency in the pull-down than in the matched input control. Displayed are nucleotide frequencies for all time points in the arsenite treatment combined. (C) Sequence logos for the most abundant motifs discovered in 100 nucleotide windows around protein–RNA crosslinking sites. The upper motif was found enriched in sequences from cells treated with arsenite for 15 min (upper panel) or 30 min (lower panel), each compared to sequences from untreated cells (differential STREME analysis, see Material and Methods).

References

    1. Cech T.R., Steitz J.A.. The noncoding RNA revolution - trashing old rules to forge new ones. Cell. 2014; 157:77–94. - PubMed
    1. Uniacke J., Holterman C.E., Lachance G., Franovic A., Jacob M.D., Fabian M.R., Payette J., Holcik M., Pause A., Lee S.. An oxygen-regulated switch in the protein synthesis machinery. Nature. 2012; 486:126–129. - PMC - PubMed
    1. Ho J.J.D., Balukoff N.C., Theodoridis P.R., Wang M., Krieger J.R., Schatz J.H., Lee S.. A network of RNA-binding proteins controls translation efficiency to activate anaerobic metabolism. Nat. Commun. 2020; 11:2677. - PMC - PubMed
    1. Ramanathan M., Porter D.F., Khavari P.A.. Methods to study RNA–protein interactions. Nat. Methods. 2019; 16:225–234. - PMC - PubMed
    1. Lee F.C.Y., Ule J.. Advances in CLIP technologies for studies of protein–RNA interactions. Mol. Cell. 2018; 69:354–369. - PubMed

Publication types