. 2023 Jun 16:14:1089023.
doi: 10.3389/fgene.2023.1089023. eCollection 2023.

The diagnostic significance of the ZNF gene family in pancreatic cancer: a bioinformatics and experimental study

Affiliations

The diagnostic significance of the ZNF gene family in pancreatic cancer: a bioinformatics and experimental study

Lei Zhu et al. Front Genet. .

Abstract

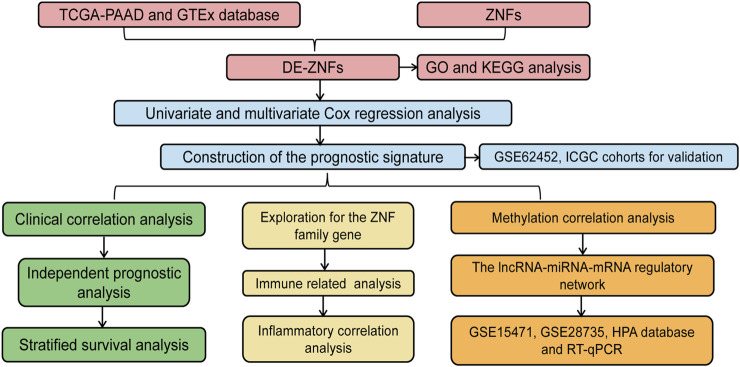
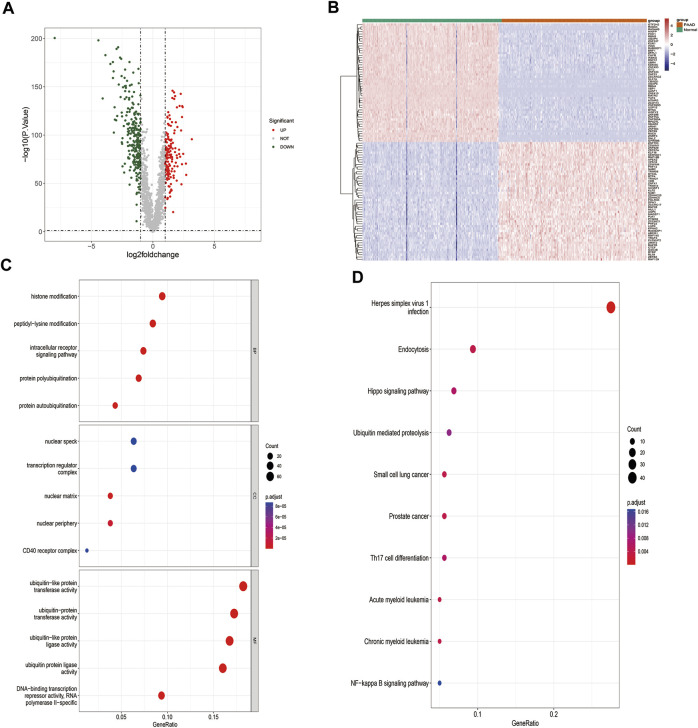
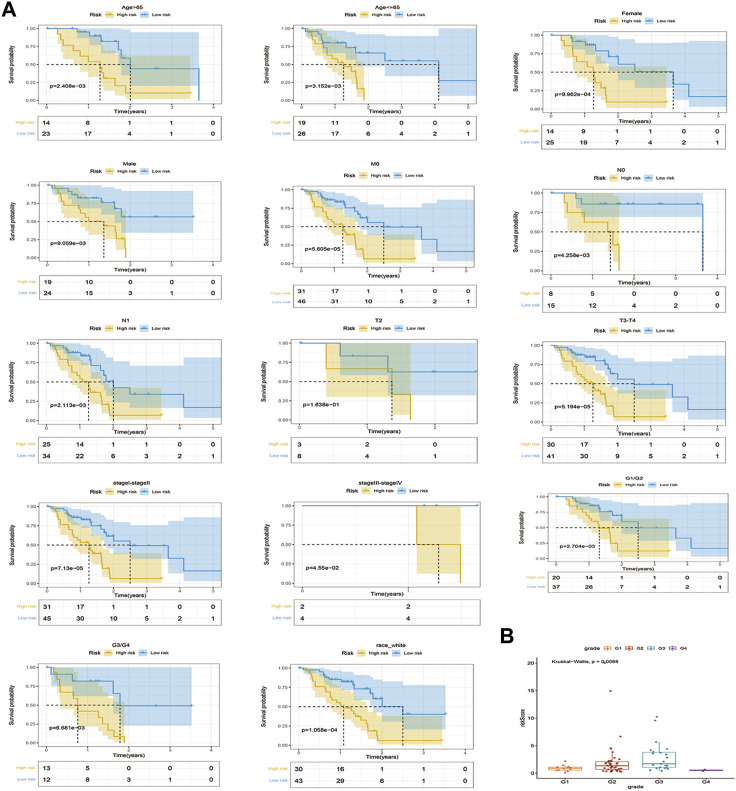
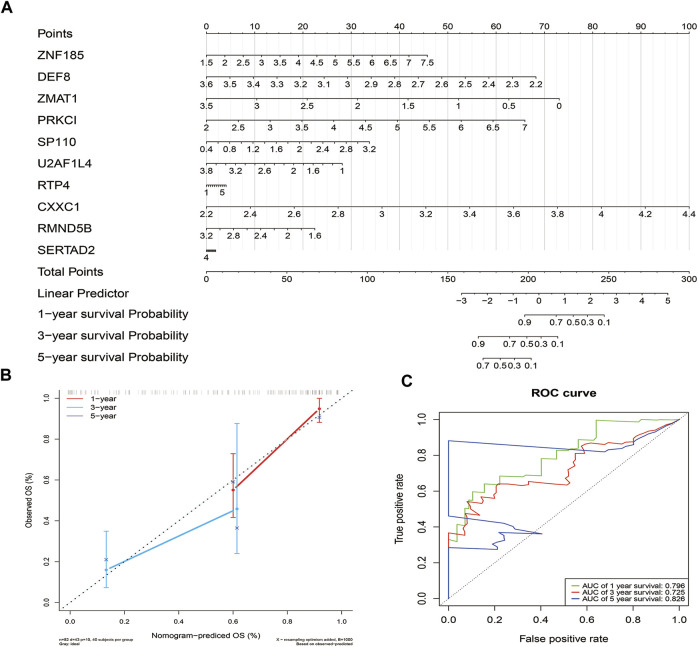
Background: Pancreatic adenocarcinoma (PAAD) is among the most devastating of all cancers with a poor survival rate. Therefore, we established a zinc finger (ZNF) protein-based prognostic prediction model for PAAD patients. Methods: The RNA-seq data for PAAD were downloaded from The Cancer Genome Atlas (TCGA) and the Gene Expression Omnibus (GEO) databases. Differentially expressed ZNF protein genes (DE-ZNFs) in PAAD and normal control tissues were screened using the "lemma" package in R. An optimal risk model and an independent prognostic value were established by univariate and multivariate Cox regression analyses. Survival analyses were performed to assess the prognostic ability of the model. Results: We constructed a ZNF family genes-related risk score model that is based on the 10 DE-ZNFs (ZNF185, PRKCI, RTP4, SERTAD2, DEF8, ZMAT1, SP110, U2AF1L4, CXXC1, and RMND5B). The risk score was found to be a significant independent prognostic factor for PAAD patients. Seven significantly differentially expressed immune cells were identified between the high- and low-risk patients. Then, based on the prognostic genes, we constructed a ceRNA regulatory network that includes 5 prognostic genes, 7 miRNAs and 35 lncRNAs. Expression analysis showed ZNF185, PRKCI and RTP4 were significantly upregulated, while ZMAT1 and CXXC1 were significantly downregulated in the PAAD samples in all TCGA - PAAD, GSE28735 and GSE15471 datasets. Moreover, the upregulation of RTP4, SERTAD2, and SP110 were verified by the cell experiments. Conclusion: We established and validated a novel, Zinc finger protein family - related prognostic risk model for patients with PAAD, that has the potential to inform patient management.

Keywords: TCGA; bioinformatics; pancreatic adenocarcinoma; prognostic risk model; zinc finger protein family.


Conflict of interest statement

The authors declare that the research was conducted in the absence of any commercial or financial relationships that could be construed as a potential conflict of interest.

Figures

FIGURE 1
FIGURE 1
Workflow diagram of this paper.
FIGURE 2
FIGURE 2
Identification and functional analysis of DE-ZNFs. (A). Volcano plot of differentially expressed genes in PAAD-vs-Normal comparison group (B). Heat map of differentially expressed genes, 150 upregulated, 257 downregulated, |log2 (fold change)|>1 and p < 0.05 (C). Top 5 GO BP, CC, and MF enrichment results of DE-ZNFs (D). Top 10 enriched KEGG pathways of DE-ZNFs.
FIGURE 3
FIGURE 3
Evaluation and validation of the prognostic risk models. (A). Cox regression analysis forest plot shows that 10 DE-ZNFs were used as parameters to construct the best prognosticis model (B). OS survival curves showing thes survival probabilities of high and low risk groups (C). The scatter plot of the risk score and survival time as well as heatmap of gene expression for each PAAD sample in high and low risk groups, which were sorted from left to right according to the risk score (D). ROC curves of the prognostic model at the 1-, 3-, and 5-year time nodes.
FIGURE 4
FIGURE 4
Stratified survival analysis of risk scores and correlation analysis of clinicopathological characteristics. (A). K-M curves of PAAD patients in high and low risk groups of Age > 65, Age <= 65, female, male, M0, T2, T3-T4, stageI-stage II, stage III-stageIⅤ, Race white, G1/G2, and G3/G4 (B). Correlations between stages of grade and risk models.
FIGURE 5
FIGURE 5
Univariate and multivariate independent prognostic analysis. (A). Univariate Cox independent prognostic analysis of stage, age, gender, grade, race, T stage, M stage, N stage, and riskScore (B). Multivariate Cox independent prognostic analysis of stage, age, gender, grade, race, T stage, M stage, N stage, and riskScore.
FIGURE 6
FIGURE 6
Construction and validation of the nomogram. (A). The nomogram based on the 10 prognostic genes of the risk score (B). Calibration curve of the nomogram.The diagonal dotted line slope is 1. (C) ROC curves of the nomogram.
FIGURE 7
FIGURE 7
Biological processes involved in ZNF family gene signaling. (A). Heatmap of 115 genes that were closely related to the risk score (B). Correlation network of 115 genes that were closely related to the risk score (C). GO enrichment analysis results of 115 genes that were closely related to the risk score, top 10 BP, CC and MF enriched terms (D). Eight enriched KEGG pathways in which the115 genes that were closely related to risk score were enriched.
FIGURE 8
FIGURE 8
Correlation analysis of ZNF family gene signaling with cellular immunity and inflammation. (A). Heat map of the proportions of 22 immune cells in high and low risk groups (B). Violin plot of the infiltration abundance of 22 immune cells in the high and low risk groups (C). Correlation plot of the risk score and seven metagene clusters.
FIGURE 9
FIGURE 9
Correlation analysis of ZNF family gene risk signals and immunotherapy. (A). Differences in abundance of TMB, neoantigens, cloned neoantigens and subcloned neoantigens between high and low risk groups (B). Expressions of TIDE, Dysfunction, Exclusion and PD-L1 in high and low risk groups.
FIGURE 10
FIGURE 10
Regulatory mechanisms of risk model genes. (A). Scatter plot of the correlation between risk model genes RTP4 and their methylation levels (B). Scatter plot of the correlation between risk model genes SP110 and their methylation levels. (C). Volcano plot of differentially expressed miRNAs in PAAD-vs-Normal comparison group (D). Volcano plot of differentially expressed lncRNAs in PAAD-vs- Normal comparison group (E). The ceRNA regulatory network with 5 risk model genes, 7 miRNAs and 35 lncRNAs. The green circles represent the risk model genes, the pink hexagons represent miRNAs, and the orange diamonds represent lncRNAs.
FIGURE 11
FIGURE 11
Validation of expressions of risk model genes in TCGA and GEO datasets. (A). The expressions of 10 risk genes between PAAD TCGA-PAAD and normal samples GTEx-normal cohorts in TCGA (B). The expressions of 10 risk genes between TCGA-PAAD and ANTE-normal cohorts. The expressions of 10 risk genes in GSE28735 (C). and GSE15471 (D) datasets.
FIGURE 12
FIGURE 12
Expression levels of 9 risk model genes were validated in HPA database.
FIGURE 13
FIGURE 13
Validation of expression levels of 10 risk model genes in pancreatic cancer cells by Cell RT-qPCR validation * represents p < 0.05, **, represents p < 0.01, *** represents p < 0.001, and **** represents p < 0.0001.

References

    1. Alahdal M., Xing Y., Tang T., Liang J. (2018). 1-Methyl-D-tryptophan reduces tumor CD133+ cells, wnt/β-catenin and NF-κβp65 while enhances lymphocytes NF-κβ2, STAT3, and STAT4 pathways in murine pancreatic adenocarcinoma. Sci. Rep. 8, 9869. 10.1038/s41598-018-28238-8 - DOI - PMC - PubMed
    1. Amedei A., Niccolai E., Benagiano M., Della Bella C., Cianchi F., Bechi P., et al. (2013). Ex vivo analysis of pancreatic cancer-infiltrating T lymphocytes reveals that ENO-specific Tregs accumulate in tumor tissue and inhibit Th1/Th17 effector cell functions. Cancer Immunol. Immunother. 62, 1249–1260. 10.1007/s00262-013-1429-3 - DOI - PMC - PubMed
    1. Chang K. W., Lin C. E., Tu H. F., Chung H. Y., Chen Y. F., Lin S. C. (2020). Establishment of a p53 null murine oral carcinoma cell line and the identification of genetic alterations associated with this carcinoma. Int. J. Mol. Sci. 21, 9354. 10.3390/ijms21249354 - DOI - PMC - PubMed
    1. Chellappa S., Hugenschmidt H., Hagness M., Line P. D., Labori K. J., Wiedswang G., et al. (2016). Regulatory T cells that co-express RORγt and FOXP3 are pro-inflammatory and immunosuppressive and expand in human pancreatic cancer. Oncoimmunology 5, e1102828. 10.1080/2162402X.2015.1102828 - DOI - PMC - PubMed
    1. Chen B., Khodadoust M. S., Liu C. L., Newman A. M., Alizadeh A. A. (2018). Profiling tumor infiltrating immune cells with CIBERSORT. Methods Mol. Biol. 1711, 243–259. 10.1007/978-1-4939-7493-1_12 - DOI - PMC - PubMed

LinkOut - more resources