

Impact of Applicability Domains to Generative Artificial Intelligence
- PMID: 37396211
- PMCID: PMC10308412
- DOI: 10.1021/acsomega.3c00883
Impact of Applicability Domains to Generative Artificial Intelligence
Abstract
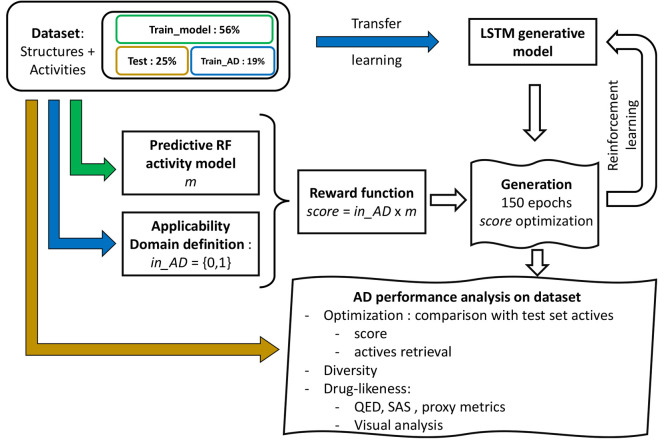
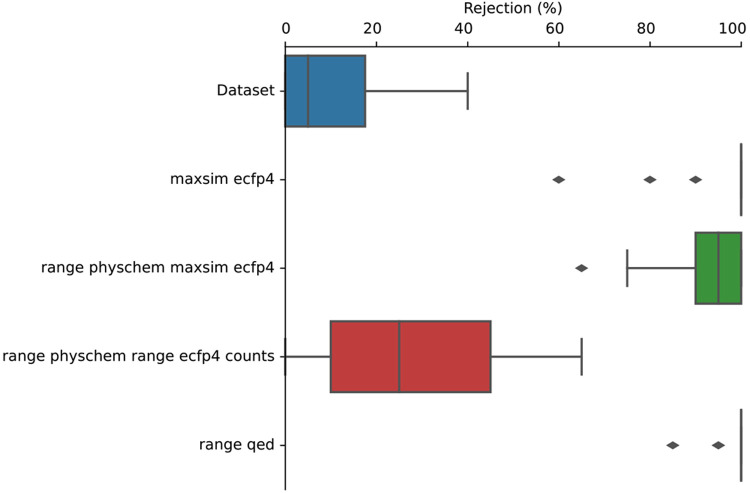
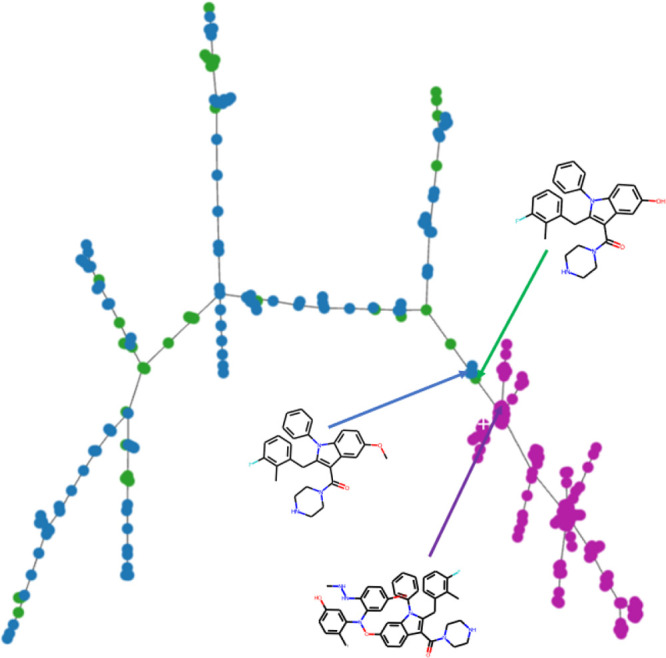
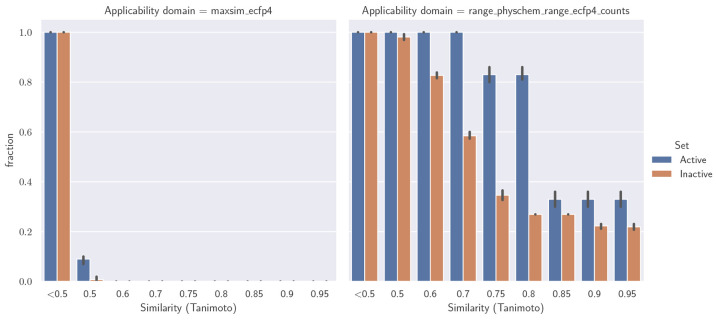
Molecular generative artificial intelligence is drawing significant attention in the drug design community, with several experimentally validated proof of concepts already published. Nevertheless, generative models are known for sometimes generating unrealistic, unstable, unsynthesizable, or uninteresting structures. This calls for methods to constrain those algorithms to generate structures in drug-like portions of the chemical space. While the concept of applicability domains for predictive models is well studied, its counterpart for generative models is not yet well-defined. In this work, we empirically examine various possibilities and propose applicability domains suited for generative models. Using both public and internal data sets, we use generative methods to generate novel structures that are predicted to be actives by a corresponding quantitative structure-activity relationships model while constraining the generative model to stay within a given applicability domain. Our work looks at several applicability domain definitions, combining various criteria, such as structural similarity to the training set, similarity of physicochemical properties, unwanted substructures, and quantitative estimate of drug-likeness. We assess the structures generated from both qualitative and quantitative points of view and find that the applicability domain definitions have a strong influence on the drug-likeness of generated molecules. An extensive analysis of our results allows us to identify applicability domain definitions that are best suited for generating drug-like molecules with generative models. We anticipate that this work will help foster the adoption of generative models in an industrial context.
© 2023 The Authors. Published by American Chemical Society.
Conflict of interest statement
The authors declare the following competing financial interest(s): All authors are or have been employed by Sanofi and may hold shares and/or stock options in the company.
Figures


Similar articles
-
Generative artificial intelligence in drug discovery: basic framework, recent advances, challenges, and opportunities.Front Pharmacol. 2024 Feb 7;15:1331062. doi: 10.3389/fphar.2024.1331062. eCollection 2024. Front Pharmacol. 2024. PMID: 38384298 Free PMC article. Review.
-
Explore drug-like space with deep generative models.Methods. 2023 Feb;210:52-59. doi: 10.1016/j.ymeth.2023.01.004. Epub 2023 Jan 19. Methods. 2023. PMID: 36682423
-
Drug-likeness analysis of traditional Chinese medicines: prediction of drug-likeness using machine learning approaches.Mol Pharm. 2012 Oct 1;9(10):2875-86. doi: 10.1021/mp300198d. Epub 2012 Sep 20. Mol Pharm. 2012. PMID: 22738405
-
Genetic Algorithm-Based Receptor Ligand: A Genetic Algorithm-Guided Generative Model to Boost the Novelty and Drug-Likeness of Molecules in a Sampling Chemical Space.J Chem Inf Model. 2024 Feb 26;64(4):1213-1228. doi: 10.1021/acs.jcim.3c01964. Epub 2024 Feb 1. J Chem Inf Model. 2024. PMID: 38302422
-
Deep generative models for 3D molecular structure.Curr Opin Struct Biol. 2023 Jun;80:102566. doi: 10.1016/j.sbi.2023.102566. Epub 2023 Mar 29. Curr Opin Struct Biol. 2023. PMID: 37001378 Review.
Cited by
-
G4-QuadScreen: A Computational Tool for Identifying Multi-Target-Directed Anticancer Leads against G-Quadruplex DNA.Cancers (Basel). 2023 Jul 27;15(15):3817. doi: 10.3390/cancers15153817. Cancers (Basel). 2023. PMID: 37568632 Free PMC article.
-
A data-driven generative strategy to avoid reward hacking in multi-objective molecular design.Nat Commun. 2025 Mar 11;16(1):2409. doi: 10.1038/s41467-025-57582-3. Nat Commun. 2025. PMID: 40069140 Free PMC article.
-
Applicability Domain for Trustable Predictions.Methods Mol Biol. 2025;2834:131-149. doi: 10.1007/978-1-0716-4003-6_6. Methods Mol Biol. 2025. PMID: 39312163
-
A molecular representation system with a common reference frame for analyzing triterpenoid structural diversity.Plant Commun. 2025 May 12;6(5):101320. doi: 10.1016/j.xplc.2025.101320. Epub 2025 Mar 24. Plant Commun. 2025. PMID: 40134219 Free PMC article.
-
MolScore: a scoring, evaluation and benchmarking framework for generative models in de novo drug design.J Cheminform. 2024 May 30;16(1):64. doi: 10.1186/s13321-024-00861-w. J Cheminform. 2024. PMID: 38816825 Free PMC article.
References
-
- Wildman S. A.; Crippen G. M. Prediction of Physicochemical Parameters by Atomic Contributions. J. Chem. Inf. Comput. Sci. 1999, 39, 868–873. 10.1021/ci990307l. - DOI
LinkOut - more resources
Full Text Sources
