Review
. 2023 Jun 13;8(25):22268-22284.
doi: 10.1021/acsomega.3c00205. eCollection 2023 Jun 27.

The Realm of Unconventional Noncovalent Interactions in Proteins: Their Significance in Structure and Function

Affiliations
Review

The Realm of Unconventional Noncovalent Interactions in Proteins: Their Significance in Structure and Function

Vishal Annasaheb Adhav et al. ACS Omega. .

Abstract

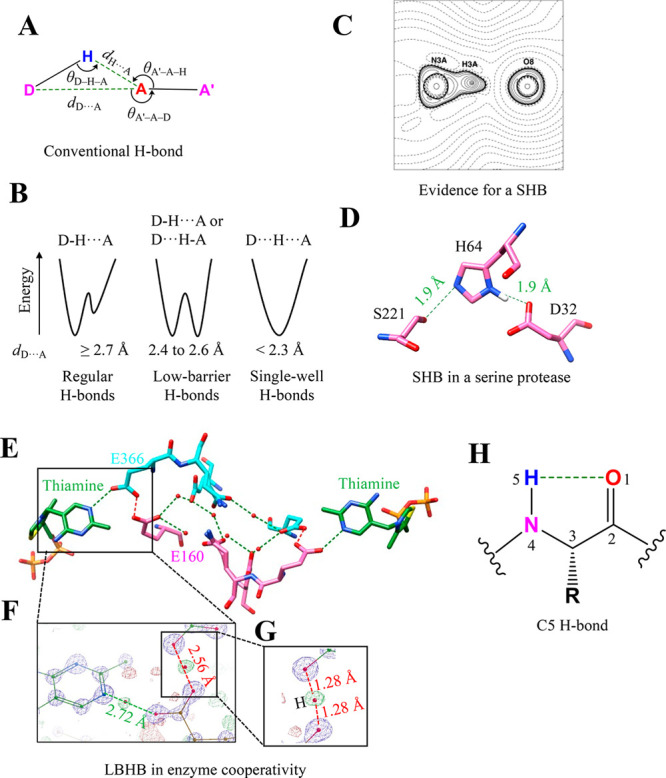
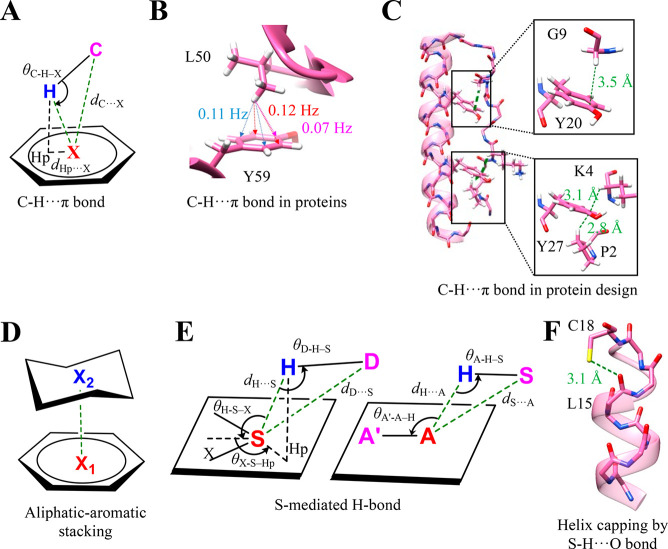
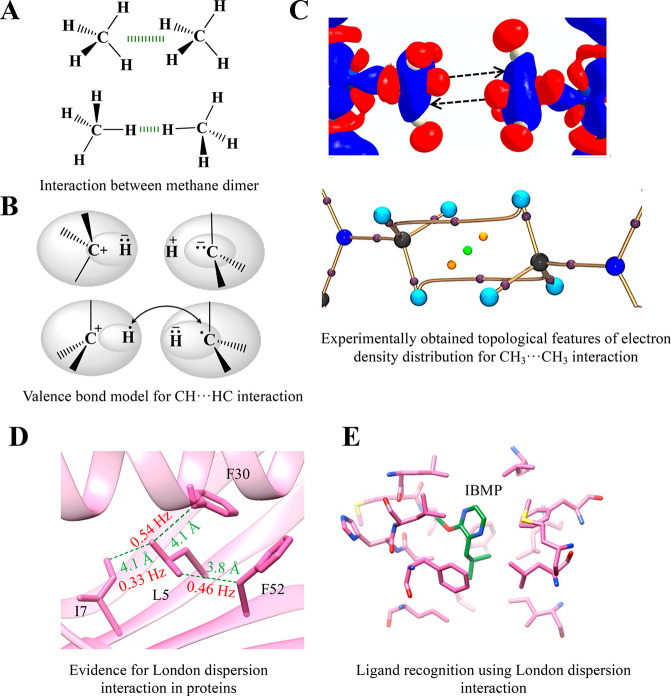
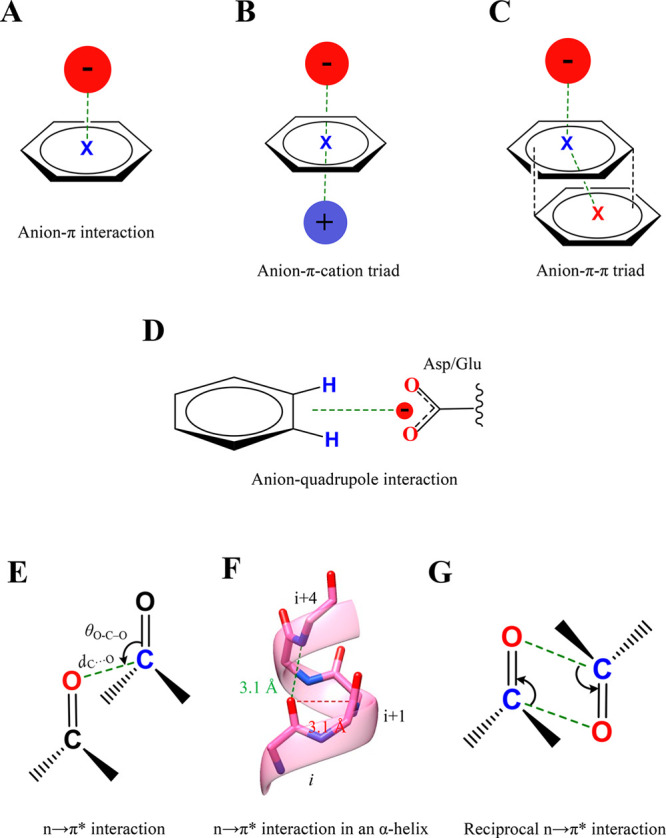
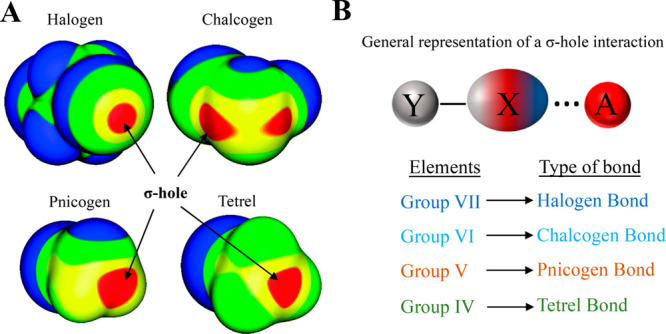
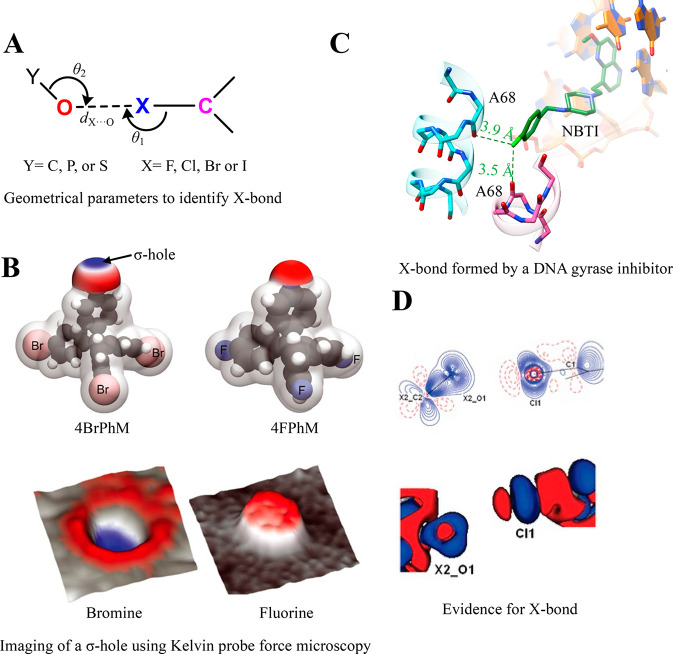
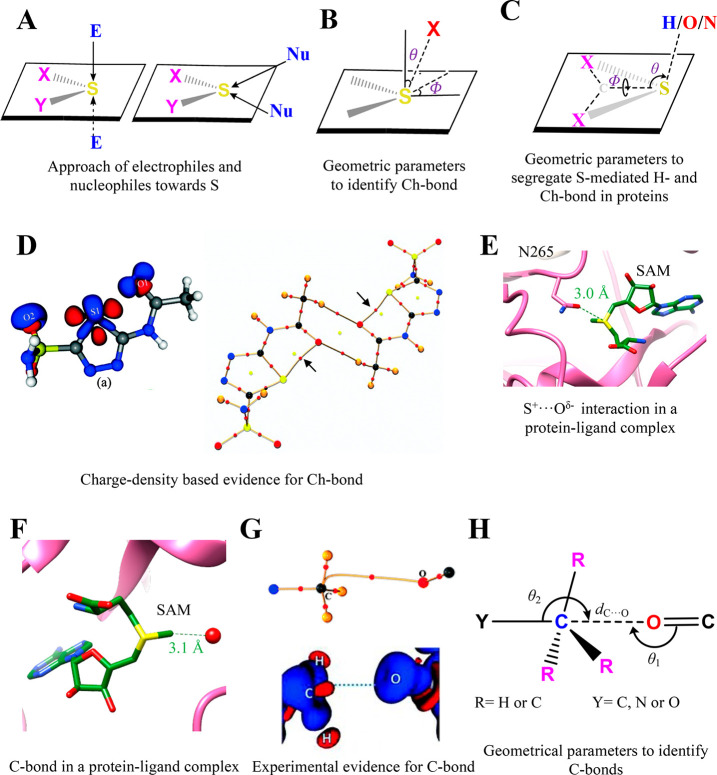
Proteins and their assemblies are fundamental for living cells to function. Their complex three-dimensional architecture and its stability are attributed to the combined effect of various noncovalent interactions. It is critical to scrutinize these noncovalent interactions to understand their role in the energy landscape in folding, catalysis, and molecular recognition. This Review presents a comprehensive summary of unconventional noncovalent interactions, beyond conventional hydrogen bonds and hydrophobic interactions, which have gained prominence over the past decade. The noncovalent interactions discussed include low-barrier hydrogen bonds, C5 hydrogen bonds, C-H···π interactions, sulfur-mediated hydrogen bonds, n → π* interactions, London dispersion interactions, halogen bonds, chalcogen bonds, and tetrel bonds. This Review focuses on their chemical nature, interaction strength, and geometrical parameters obtained from X-ray crystallography, spectroscopy, bioinformatics, and computational chemistry. Also highlighted are their occurrence in proteins or their complexes and recent advances made toward understanding their role in biomolecular structure and function. Probing the chemical diversity of these interactions, we determined that the variable frequency of occurrence in proteins and the ability to synergize with one another are important not only for ab initio structure prediction but also to design proteins with new functionalities. A better understanding of these interactions will promote their utilization in designing and engineering ligands with potential therapeutic value.


Conflict of interest statement

The authors declare no competing financial interest.

Figures

Figure 1
Figure 1
Unconventional H-bonds. (A) Geometrical and stereochemical parameters used to identify a conventional H-bond in biomolecules. (B) Energy profile of a H-bond as a function of the location of the H atom between D and A highlighting the difference between a regular, low-barrier, and single-well H-bond. (C) A charge-density analysis showing a contour plot of the negative of the Laplacian of the electron density in the plane of the N–H···O bond in a model compound mimicking the catalytic triad in serine proteases. Solid lines indicate positive contours, and broken lines indicate a negative contour. Adapted from ref (26). Copyright 2001 Wiley. (D) A 0.78 Å structure showing a short H-bond (dH···O = 1.60 Å) in the Ser-His-Asp catalytic triad of serine protease subtilisin (PDB ID: 1GCI). (E) The 0.97 Å resolution crystal structure of the human transketolase with substrate–thiamine intermediates bound (green) zoomed to show a channel and intervening residues communicating with two active sites of the homodimer (each monomer colored in cyan and pink) (PDB ID: 4KXW). The H-bond network that connects these sites is highlighted in green (regular H-bonds) and red (LBHB). (F) Zoomed section showing residues Glu160, Glu366, and a portion of thiamine with the 2FOFC electron density map at the 6σ contour level and FOFC at the 2.7σ contour level. The regular H-bond between thiamine and Glu366 (green) and the LBHB between Glu366 and Glu160 (red) are also highlighted. (G) A magnified section shows the occurrence of electron density almost precisely halfway between Glu366 and Glu160, confirming an LBHB. Mutation of Glu160 to glutamine disrupts the LBHB, resulting in a 5-fold decrease in the enzyme’s catalytic constant (kcat). Parts F and G were adapted from ref (32). Copyright 2019 Springer. (H) Definition and geometry of the C5 H-bond.
Figure 2
Figure 2
C–H···π bond and S-mediated H-bond. (A) Geometry and stereochemical parameters used to identify the C–H···π bond in the biomolecules. (B) The observation of J-coupling in an NMR-based experiment between the methyl and π groups in ubiquitin (PDB ID: 1UBQ) because of the C–H···π interaction. The values are adapted from ref (46). (C) NMR structure of a designed miniprotein, PPα-Tyr, and magnified regions showing the C–H···π interactions stabilizing the association of the α-helix and polyproline II helix in PPα-Tyr (PDB ID: 5LO2). The distances for all C–H···π interactions were <2.6 Å. (D) The geometry of aliphatic and aromatic stacking driven by multiple C–H···π interactions. (E) The geometrical and stereochemical parameters used to identify the S-mediated H-bonds in biomolecules. The favorable values of these parameters are as follows: dH···S = 2.74 Å, dD···S = 3.52 Å, dH···A = 2.51 Å, dS···A = 3.50 Å, θD–H–S = 141.1°, θH–S–X = 119°, θX–S–Hp = 137°, θA–H–S = 136.5°, and θA′–A–H = 117.4°. (F) A representative example of the S-mediated H-bond (S–H···O interaction) stabilizing the C-terminus of an α-helix by helix capping (PDB ID: 1CPV).
Figure 3
Figure 3
London dispersion interaction. (A) The two standard geometries of methane dimer forming the London dispersion interaction. The favorable distances for the C···C interaction are 4.2 (for the geometry in the top panel) and 5.0 Å (for the geometry in the bottom panel), respectively. (B) A valence bond model showing the domination of the CH···HC interaction by charge alteration (top panel) for small alkanes and recoupling of bonding electrons to form H···H, C···C, and C···H bonds for large alkanes (bottom panel). Reproduced with pemission from ref (84). Copyright 2013 American Chemical Society. (C) Experimental 3D deformation density map (top panel) and a molecular graph (bottom panel) with bond path and bond critical point for the CH3···CH3 interaction. The red regions in the 3D deformation density map represent charge depletion, and the blue regions represent charge concentration. Adapted from ref (85). Copyright 2019 American Chemical Society. (D) The observation of vdWJCC coupling in the NMR-based experiment between nonpolar residues in protein GB3 (PDB ID: 1IGD) because of the CH···CH London dispersion interaction (the values are from ref (86)). (E) The enthalpy-driven bonding of 2-methoxy-3-isobutylpyrazine (IBMP) to a variant of MUP (PDB ID: 1YP6). IBMP does not form any polar interaction with the surrounding protein residues.
Figure 4
Figure 4
Anion−π, anion–aromatic, and n → π* interactions. (A) A general representation of the anion···π interaction. (B) Anion−π–cation and (C) anion−π–π triads representing the cooperative nature of anion···π interactions. (D) The geometry of an anion–quadrupole interaction. (E) A general representation of the n → π* interaction formed between two carbonyl groups with the geometrical parameters that characterize the interaction. (F) The n → π* interaction formed between the ith and i+1th residues in the α-helix (red). (G) A representation of a reciprocal n → π* interaction.
Figure 5
Figure 5
The σ-hole bonding interaction. (A) Molecular electrostatic potential maps for ICF2CF2I, SeFCl, GeH3Br, and PH2Cl adapted from ref (141) (Copyright 2013 Royal Society of Chemistry), showing the σ-hole on a representative example from Type VII (halogen), VI (chalcogen), V (pnicogen), and IV (tetrel) elements, respectively. Maps were computed on the 0.001 au density level. Strength of the σ-holes is highlighted with color coding: red represents >25 kcal mol–1; yellow represents between 15 and 25 kcal mol–1; green represents between 0 and 15 kcal mol–1; and blue represents <0 kcal mol–1. (B) A general representation of the σ-hole bonding interaction formed between a σ-hole donating atom (X) with an electron-rich acceptor atom/molecule (A). Here, Y represents any electron-withdrawing atom/group. The classification of σ-hole bonding interactions on the basis of the type of element from the periodic table that donates the σ-hole.
Figure 6
Figure 6
Halogen bond. (A) The geometric parameters used to investigate the X-bond in biomolecules. The value of dX···O is less than or equal to the sum of the van der Waals radii of X and O. The most favorable values of θ1 and θ2 are ∼170–180° and ∼113°, respectively. (B) The top panel shows the molecular electrostatic maps of the tetrakis (4-bromophenyl) methane (4BrPhM) and tetrakis (4-fluorophenyl) methane (4FPhM) molecules, revealing the presence of a σ-hole on Br. The bottom panel shows the 3D representation of the VLCPD maps acquired using Kelvin probe force microscopy for the 4BrPhM and 4FPhM molecules, providing evidence of the presence of a σ-hole on the Br atom. For the VLCPD maps, blue represents low values, whereas red indicates high values. Adapted from ref (148). Copyright 2021 AAAS. (C) A structural snapshot of a derivative of bacterial type II topoisomerase inhibitors (NBTIs) bound to Staphylococcus aureus DNA gyrase. A bifurcated X-bond is shown between Cl (light green) of the derivative of NBTI and the main-chain O of alanine from a symmetry-related protein molecule (PDB ID: 6Z1A). (D) A segment of the 2D static (top panel) and 3D (bottom panel) deformation density maps obtained from the experimentally determined charge-density distribution for 2,5-dichloro-1,4-benzoquinone evidencing C–Cl···O=C halogen bond formation. Adapted from ref (159). Copyright 2011 American Chemical Society. Red regions in the 3D deformation density map represent charge depletion, and blue regions represent charge concentration.
Figure 7
Figure 7
Chalcogen and tetrel bonding interaction. (A) A representation showing the distinct approach of electrophiles and nucleophiles toward divalent S. (B) The geometric parameters used to investigate the Ch-bond in proteins. The most common value of dS···O is 3.6 Å, where θ > 50° and φ ranges from 30°–60°. (C) The definition of angular parameters used to delineate the S-mediated Ch- from the H-bond. The most favorable values of θ are within 95–145°, whereas values of δ range from −90° to −50° or from 50° to 90° for H-bonds in proteins. In the case of the Ch-bond, the most common values of θ are from 115° to 155°, and δ ranges from −50° ≤ δ ≤ 50°. (D) Static 3D deformation density map for acetazolamide (left) and a molecular graph showing the bond path and critical bond point in the dimer of acetazolamide (right), evidencing intramolecular Ch-bond formation. The BCP for the S···O interaction is highlighted with black arrows. Adapted from ref (187). Copyright 2015 Royal Society of Chemistry. Red regions in the 3D deformation density map represent charge depletion, and blue regions represent charge concentration. (E) An electrostatic S+···Oδ− interaction at the active site of histone-lysine N-methyltransferase SET7/9 (PDB ID: 4J83). (F) A representative example showing the conserved C···O tetrel bond in AdoMet-dependent methyltransferase (PDB ID: 5VSC). (G) A segment of the 3D deformation density map and the experimentally obtained bond path with BCP C···O C-bonding in dimethylammonium 4-hydroxybenzoate. Red regions in the 3D deformation density map represent charge depletion, and blue regions represent charge concentration. Adapted from ref (200). Copyright 2014 Royal Society of Chemistry. (H) The geometric parameters used to investigate the C-bond in proteins. The following distance and angular criteria are used to find the C-bond in proteins: dC···O = 2.5–3.6 Å, θ1 that is within 160–180°, and θ2 that is within 160–180°. Adapted from ref (198). Copyright 2018 Wiley.

Similar articles

Cited by

References

    1. van der Waals D. J.On the Continuity of the Gaseous and Liquid States; Leiden University: Leiden, The Netherlands, 1873.
    1. Müller-Dethlefs K.; Hobza P.; Mu K.; Hobza P. Noncovalent Interactions: A Challenge for Experiment and Theory. Chem. Rev. 2000, 100 (1), 143–168. 10.1021/cr9900331. - DOI - PubMed
    1. Kollman P. A. Noncovalent Interactions. Acc. Chem. Res. 1977, 10 (10), 365–371. 10.1021/ar50118a003. - DOI
    1. Mahadevi A. S.; Sastry G. N. Cooperativity in Noncovalent Interactions. Chem. Rev. 2016, 116 (5), 2775–2825. 10.1021/cr500344e. - DOI - PubMed
    1. Kollman P. Chapter 2 Non-Covalent Forces of Importance in Biochemistry. New Compr.Biochem. 1984, 6, 55–71. 10.1016/S0167-7306(08)60373-7. - DOI