. 2022 May 10;10(3):1040-1054.
doi: 10.1016/j.gendis.2022.04.013. eCollection 2023 May.

LncRNA H19 mediates BMP9-induced angiogenesis in mesenchymal stem cells by promoting the p53-Notch1 angiogenic signaling axis

Affiliations

LncRNA H19 mediates BMP9-induced angiogenesis in mesenchymal stem cells by promoting the p53-Notch1 angiogenic signaling axis

Chengcheng Du et al. Genes Dis. .

Abstract

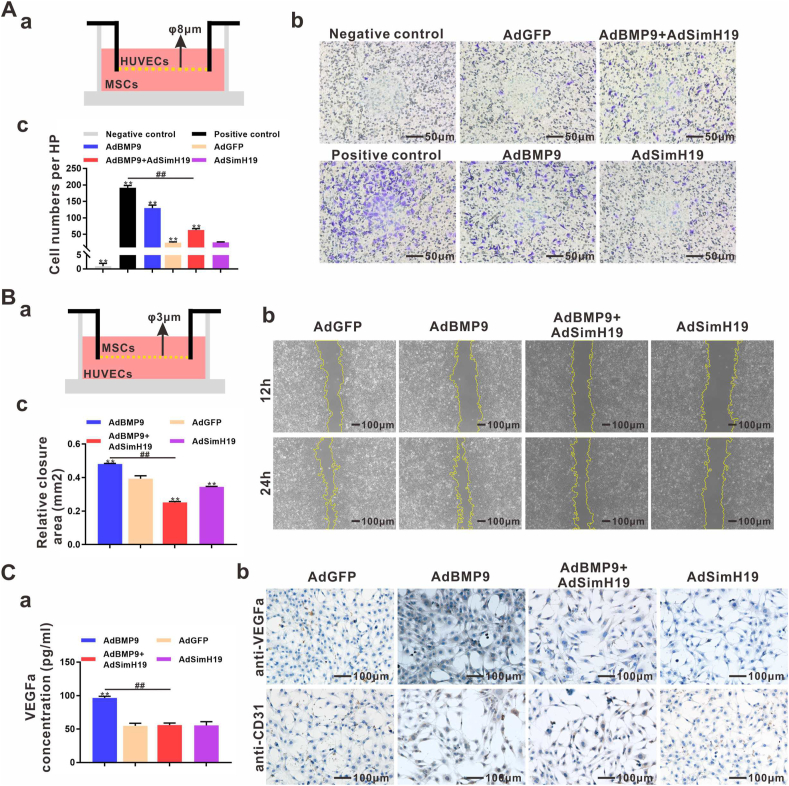
BMP9 mediated osteogenic differentiation mechanisms of MSCs were widely explored, however, mechanisms of BMP9-induced angiogenesis still need to be clarified. We previously characterized that Notch1 promoted BMP9-induced osteogenesis-angiogenesis coupling process in mesenchymal stem cells (MSCs). Here, we explored the underlying mechanisms of lncRNA H19 (H19) mediated regulation of BMP9-induced angiogenesis through activating Notch1 signaling. We demonstrated that basal expression level of H19 was high in MSCs, and silencing H19 attenuates BMP9-induced osteogenesis and angiogenesis of MSCs both in vitro and in vivo. Meanwhile, we identified that BMP9-induced production of CD31+ cells was indispensable for BMP9-induced bone formation, and silencing H19 dramatically blocked BMP9-induced production of CD31+ cells. In addition, we found that down-regulation of H19 inhibited BMP9 mediated blood vessel formation and followed subsequent bone formation in vivo. Mechanistically, we clarified that H19 promoted p53 phosphorylation by direct interacting and phosphorylating binding, and phosphorylated p53 potentiated Notch1 expression and activation of Notch1 targeting genes by binding on the promoter area of Notch1 gene. These findings suggested that H19 regulated BMP9-induced angiogenesis of MSCs by promoting the p53-Notch1 angiogenic signaling axis.

Keywords: Angiogenesis; BMP9; Bone tissue engineering; LncRNA H19; Mesenchymal stem cells.


Figures

Figure 1
Figure 1
Silencing H19 attenuated BMP9-induced osteogenic differentiation of MSCs. (A) Silencing H19 inhibited BMP9-induced HUVECs migration. A diagram summarized co-culture system of MSCs and HUVECs (a). Viable cells were detected by crystal violet staining (b), MSCs in the upper chamber were used as negative control and HUVECs in the lower chamber were used as positive control, scale bar, 50 μm. Quantitative analysis of viable cells (c) showed that BMP9-induced HUVECs migration was inhibited by silencing H19. (B) Silencing H19 inhibited BMP9-induced HUVECs migration by wound closure. A diagram summarized co-culture system of MSCs and HUVECs (a). Cell closure at 12 and 24 h were presented (b) and quantitative analysis of closure areas showed that BMP9-induced HUVECs migration to close the wound was inhibited by silencing H19 (c). Scale bar, 100 μm. (C) Silencing H19 inhibited BMP9-induced VEGFa and the production of CD31+ cells. BMP9-induced secretion of VEGFa was determined by ELISA on day 5 after adenovirus infection (a), BMP9-induced VEGFa secretion was inhibited by silencing H19. The cytoplasmic VEGFa and CD31 expressions were identified by IHC (b) on day 5 after BMP9 stimulation and the results showed that BMP9 mediated VEGFa and CD31 expressions were inhibited by AdSimH19 mediated down-regulation of H19, scale bar, 100 μm. The one-way ANOVA, ∗∗P < 0.01, compared with control (AdGFP) group, ##P < 0.01, compared with indicated group.
Figure 2
Figure 2
BMP9-induced production of CD31+ cells was indispensable for BMP9-induced bone formation. (A) Proportions of CD31+ cells increased gradually with the stimulation of BMP9. MSCs were infected with AdBMP9 and subjected to flow cytometry screening for CD31+ cells, proportions of CD31+ cells were recorded at day 0, 1, 3, 5, and 7, respectively (a), day 0 means without BMP9 treatment. Quantitative analysis (b) of three independent tests showed that with the stimulation of BMP9, CD31+ cells proportions increased form day 3 to day 7, and reach the peak on day 5. The one-way ANOVA, ∗∗P < 0.01, ∗P < 0.05, compared with control (AdGFP) group, ##P < 0.01, compared with indicated group. (B) Morphologies (a) and identification of CD31+ and CD31 cells (b). CD31+ cells were cells identified as positive with flow cytometry, and CD31 cells were all other types of cells except CD31+ cells, scale bar 50 μm. (C) Decreased osteogenic differentiation potential of MSCs lack of CD31+ cells. MSCs lack of CD31+ cells and normal MSCs were infected with AdBMP9, 48 h later, cells were re-suspended and subcutaneously injected in the nude mice, 4 weeks later, ectopic masses were harvested and subjected to following analysis. Micro-CT reconstructed ectopic masses (a), bone volume (b) and BV/TV (c) analysis showed that, although MSCs lack of CD31+ cells obtained larger volume with the stimulation of BMP9, trabecular bone volume was statically less than normal MSCs. Histologically (d), H&E staining showed that normal MSCs formed trabecular bone with abundant blood vessels with the treatment of BMP9 for 4 weeks, MSCs lack of CD31+ cells formed less trabecular bone with a mass of undifferentiated cells without obvious blood vessels formation. IHC staining showed the undifferentiated cells were CD31 cells. TB, trabecular bone, UC, undifferentiated cells, arrows indicated blood vessels. Unpaired Student's t test, ∗P < 0.05, compared with normal group.
Figure 3
Figure 3
Down-regulation of H19 attenuated BMP9-induced angiogenesis and followed ectopic bone formation. (A) Silencing H19 attenuated BMP9-induced production of CD31+ cells. MSCs were treated with AdBMP9 and/or AdSimH19; AdGFP was used as control. Five days after infections, each treatment group was subjected to flow cytometry for screening CD31+ cells (a), quantitative analysis (b) showed that BMP9 up-regulated CD31+ cells proportion significantly compared with control group, and silencing H19 blocked CD31+ cells generation significantly compared with AdBMP9 group. The one-way ANOVA, ∗∗P < 0.01, compared with control (AdGFP) group, ##P < 0.01, compared with indicated group. (B, C) Silencing H19 attenuated BMP9-induced bone and blood vessels formation in vivo. MSCs were treated with AdBMP9 and/or AdSimH19; AdGFP was used as control. At indicated time points, ectopic masses (no obvious mass formation in AdGFP and AdSimH19 groups) were subjected to micro-CT and histological analysis. Reconstructed ectopic masses at 2, 4 and 6 weeks were shown (a). Bone volume analysis (b) showed that silencing H19 delayed BMP9-induced bone volume increasing, and bone mineral density analysis (c) showed that silencing H19 statistically decreased BMP9-induced bone mature in 4 and 6 weeks. The one-way ANOVA, ∗∗P < 0.01, ∗P < 0.05, compared with 2 weeks, ##P < 0.05, compared with indicated group. Histologically, in AdBMP9 group, obvious blood vessels were found in 2 weeks, and vascularized trabecular bone formation gradually from 4 to 6 weeks. When silencing H19, no obvious blood vessels formation in 2 weeks, and less trabecular bone and more undifferentiated cells were found in both 4 weeks and 6 weeks compared with AdBMP9 group. Scale bar 100 μm.
Figure 4
Figure 4
Trichrome, Safranin O-fast green staining and IHC assay for detecting trabecular bone and angiogenic activities. (A) Trichrome and Safranin O-fast green staining were used to identify the collagen formation, when down-regulation H19, less and more immature trabecular bone were found compared with AdBMP9 group. (B) IHC assay for detecting blood vessels. VEGFR2 were used for detecting angiogenic activities in 2, 4 and 6 weeks. VEGFR2+ cells mainly expressed around blood vessels, and more blood vessels were identified in AdBMP9 group compared with AdBMP9 + AdSimH19 group. Dotted box indicated the area in high power field. (C) Quantitative analysis of trabecular bone area (a) and number of blood vessels per high power field (HP) (b) showed decreased angiogenic activities and vascularized bone formation abilities when silencing H19. The two-way ANOVA, ∗∗P < 0.01, ∗P < 0.05, compared with 2 weeks, ##P < 0.05, compared with indicated group.
Figure 5
Figure 5
H19 promoted BMP9-induced phosphorylation of p53 by directly interaction. (A) Down-regulation of H19 attenuated BMP9-induced phosphorylation of p53. Total p53 and p-p53 were detected by Western blot (a), no statistical difference was found among each treatment group for the expressions of total p53 (b). As for p-p53, BMP9-induced up-regulation of p-p53 was dramatically inhibited by silencing H19. The one-way ANOVA, ∗∗P < 0.01, compared with control (AdGFP) group, ##P < 0.01, compared with indicated group. (B) Interaction of p53 and H19 by RIP analysis. The expression of p53 was confirmed before immunoprecipitation, and GAPDH was used as reference protein (a). Post immunoprecipitation (IP), Western blot analysis with p53 antibody was used to detecting p53, 10% input, and IgG group were used as controls (c). H19 expression levels in IP and IgG groups were determined by RT-qPCR(c), the levels of H19 were presented as fold enrichment in anti-RUNX2 relative to IgG immunoprecipitations. Unpaired Student's t test, ∗∗P < 0.01, compared with normal group.
Figure 6
Figure 6
Phosphorylated p53 promoted Notch1 expression by interacting with Notch1 promoter. (A) Down-regulation of H19 attenuated Notch1 expressions at both mRNA and protein level. MSCs in each treatment group were subjected to RT-qPCR on day 3, BMP9 dramatically up-regulated Notch1 mRNA expression compared with control group, and silencing H19 statistically inhibited the up-regulation of Notch1 (b). Western blot analysis (b) was carried out three days after adenovirus infection, quantitative analysis showed that BMP9-induced up-regulation of Notch1 was inhibited by silencing H19 (c). The one-way ANOVA, ∗∗P < 0.01, compared with control (AdGFP) group, ##P < 0.01, compared with indicated group. (B)γ-secretase inhibitor DAPT attenuated BMP9-induced production of CD31+ cells. MSCs were induced with AdBMP9; AdGFP was used as control. 24 h after infection, γ-secretase inhibitor DAPT or DMSO was added into the medium and flow cytometry was carried out on day 5 (a), quantitative analysis (b) showed that DAPT significantly inhibited BMP9-induced production of CD31+ cells. The one-way ANOVA, ∗∗P < 0.01, compared with control (AdGFP) group, ##P < 0.01, compared with indicated group. (C) Phosphorylated p53 promote Notch1 expression by interacting with Notch1promoter. About 1 × 107 C3H10T1/2 cells were lysed and subjected to sonication, fragmented DNA was detected on 1% agarose gel (a). After immunoprecipitation, p-p53 was detected by Western blot assay and GAPDH was used as control (b). A diagram indicated the distribution of three pairs of primers for detection about 2000 bp prior to the coding sequence (CDS) of Notch1 (c). RT-qPCR for detecting the enrichment of Notch1 promoter area respectively, IgG was used as control. The two-way ANOVA, ∗∗P < 0.01, compared with control (IgG) group, ##P < 0.01, compared with indicated group, ns, not significant. (D) A diagram summarizing the main findings of the research. H19 regulates BMP9-induced angiogenesis of MSCs by regulating the phosphorylation of p53, p-p53 interacts with Notch1 promoter and promotes the activation of Notch1.
None
Supplementary Figure 1. H19 highly expressed in BMP9-induced MSCs differentiation. (A) A diagram indicated the construction of silencing H19. Three (Si-1, Si-2 and Si-3) small interfering RNAs (siRNAs) targeting mouse H19 were cloned between three pairs of U6-H1 promoters respectively with Gibson Assembly system. (B) Adenovirus mediated gene transduction in C3H10T1/2 cell. Adenovirus was added into the cell culture medium and the fluorescence indicated the infection of AdBMP9 (green), AdGFP (Green) and/ or AdSimH19 (Red) respectively. (C) The basal expression of H19 was close to β-actin, with the stimulation of BMP9, H19 expressions is higher than β-actin on day 3 and day 5. (D) Silencing efficiency of AdSimH19 on day 3. The expression of H19 was determined three days after adenovirus infection, GAPDH was used as reference gene. The two-way ANOVA, ∗∗P < 0.01, compared with control (IgG) group, ##P < 0.01, compared with indicated group, ns, not significant. (E) Silencing H19 did not influence AdBMP9 mediated BMP9 protein expression. BMP9 protein expressions were detected on day 3 after adenovirus infection (a) and quantitative analysis (b) found silencing H19 did not influence the expression of BMP9, GAPDH was used as reference protein. The one-way ANOVA ∗∗P < 0.01, compared with control (AdGFP) group, ##P < 0.01, compared with indicated group.
None
Supplementary Figure 2. Down-regulation of H19 inhibited BMP9-induced osteogenic differentiation of MSCs. (A) Silencing H19 attenuated BMP9-induced early osteogenic differentiation of MSCs. ALP staining (a) and quantitative analysis (b) were done on 2 and 5 days in each treatment group respectively. ALP activities were dramatically up-regulated by AdBMP9 compared with AdGFP group, and AdSimH19 inhibited BMP9 mediated up-regulating ALP activities on both 2 and 5 days. The two-way ANOVA, ∗∗P < 0.01, compared with control (AdGFP) group, ##P < 0.01, compared with indicated group. (B) Silencing H19 attenuated BMP9-induced late osteogenic differentiation of MSCs. MSCs were infected with indicated adenovirus and cultured in osteogenic medium, on 14 and 21 days, mineralized nodules were detected by Alizarin staining. (Scale bar 100 μm). (C) Silencing H19 attenuated BMP9-induced early osteogenic markers expression. Key osteogenic transcription factor Runx2 was detected by Western blot (a) 3 days after adenovirus infection, quantitative analysis (b) showed that silencing H19 inhibited BMP9-induced up-regulating of Runx2. The one-way ANOVA, ∗∗P < 0.01, compared with control (AdGFP) group, ##P < 0.01, compared with indicated group. (D) Silencing H19 attenuated BMP9-induced late osteogenic markers expression. Late osteogenic differentiation markers Col1a1 and OC (a) were detected by Western blot on day 7, quantitative analysis (b) showed that silencing H19 inhibited BMP9-induced up-regulating of Col1a1 and OC. Each assay condition was done in triplicate, GAPDH was used as reference protein. The one-way ANOVA, ∗∗P < 0.01, compared with control (AdGFP) group, ##P < 0.01, compared with indicated group.

Similar articles

Cited by

References

    1. Collon K., Gallo M.C., Lieberman J.R. Musculoskeletal tissue engineering: regional gene therapy for bone repair. Biomaterials. 2021;275:120901. - PubMed
    1. Ho-Shui-Ling A., Bolander J., Rustom L.E., et al. Bone regeneration strategies: engineered scaffolds, bioactive molecules and stem cells current stage and future perspectives. Biomaterials. 2018;180:143–162. - PMC - PubMed
    1. Soldner F., Jaenisch R. Stem cells, genome editing, and the path to translational medicine. Cell. 2018;175(3):615–632. - PMC - PubMed
    1. Mostafa S., Pakvasa M., Coalson E., et al. The wonders of BMP9: from mesenchymal stem cell differentiation, angiogenesis, neurogenesis, tumorigenesis, and metabolism to regenerative medicine. Genes Dis. 2019;6(3):201–223. - PMC - PubMed
    1. Liao J., Wei Q., Zou Y., et al. Notch signaling augments BMP9-induced bone formation by promoting the osteogenesis-angiogenesis coupling process in mesenchymal stem cells (MSCs) Cell Physiol Biochem. 2017;41(5):1905–1923. - PubMed