

PILRA is associated with immune cells infiltration in atrial fibrillation based on bioinformatics and experiment validation
- PMID: 37396579
- PMCID: PMC10311564
- DOI: 10.3389/fcvm.2023.1082015
PILRA is associated with immune cells infiltration in atrial fibrillation based on bioinformatics and experiment validation
Abstract
Background and aims: inflammation plays an important role in atrial fibrillation (AF). In this study, we investigated the significance of immune cell infiltration in AF and identified the potential Hub genes involved in the regulation of immune cell infiltration in AF.
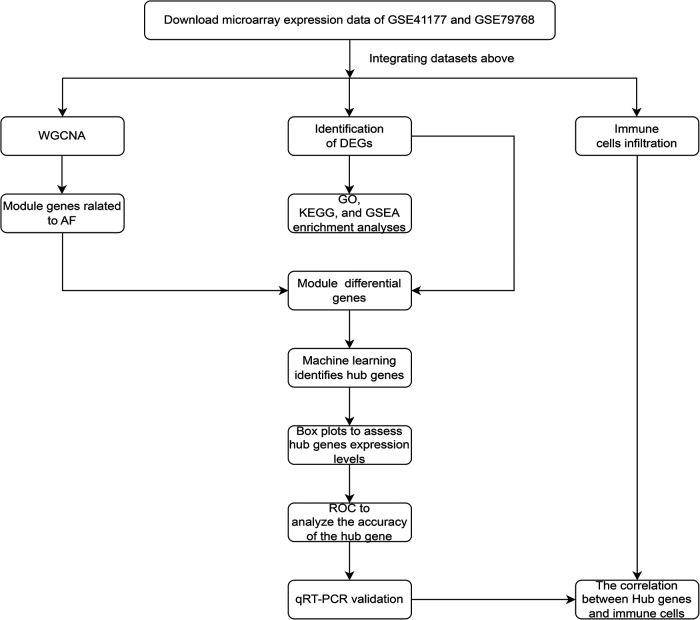
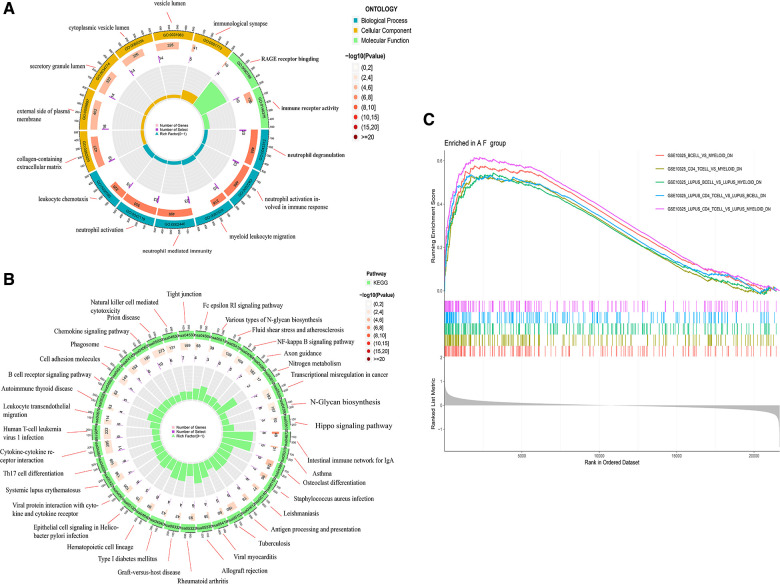
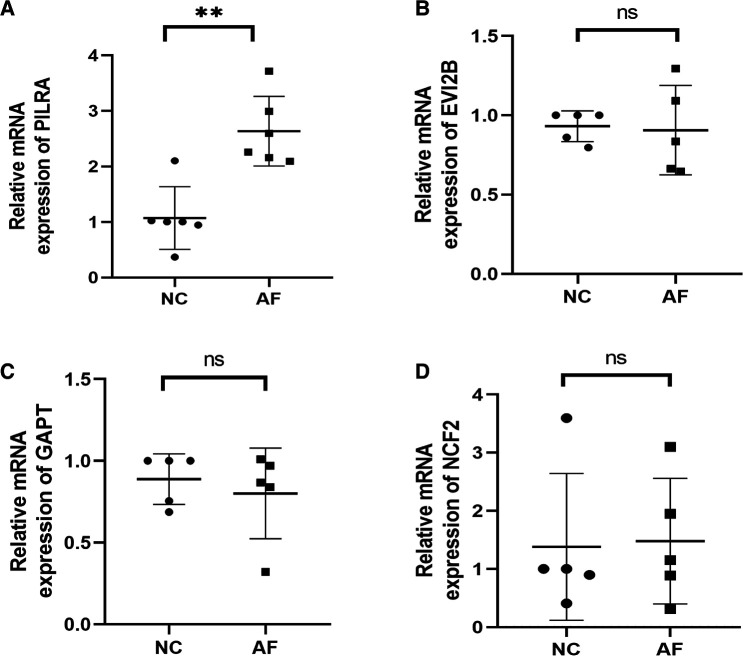
Methods: we obtained AF datasets from the GEO database and analyzed them for obtaining differentially expressed genes (DEGs) by R software. Then, we performed GO, KEGG, and GSEA enrichment analyses of DEGs. The Hub genes of AF were determined by least absolute shrinkage selection operator (LASSO) regression analysis and weighted gene co-expression network analysis (WGCNA). Their validation was verified by using quantitative polymerase chain reaction (qPCR) in the AF rat model. Finally, we used a single sample GSEA (ssGSEA) to analyze immune cell infiltration and its relationship with hub genes.
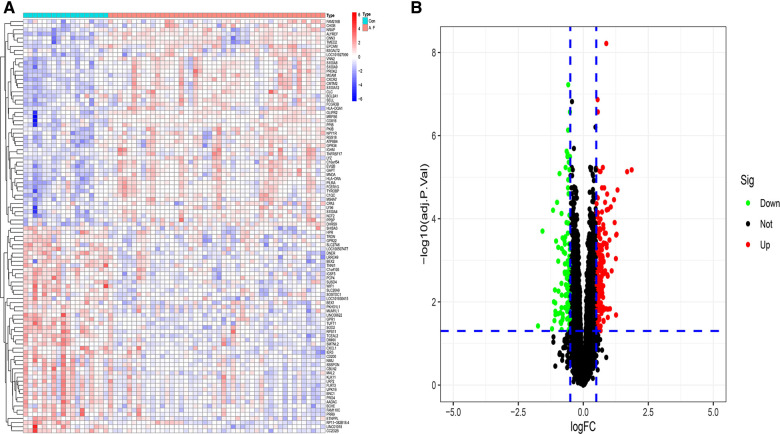
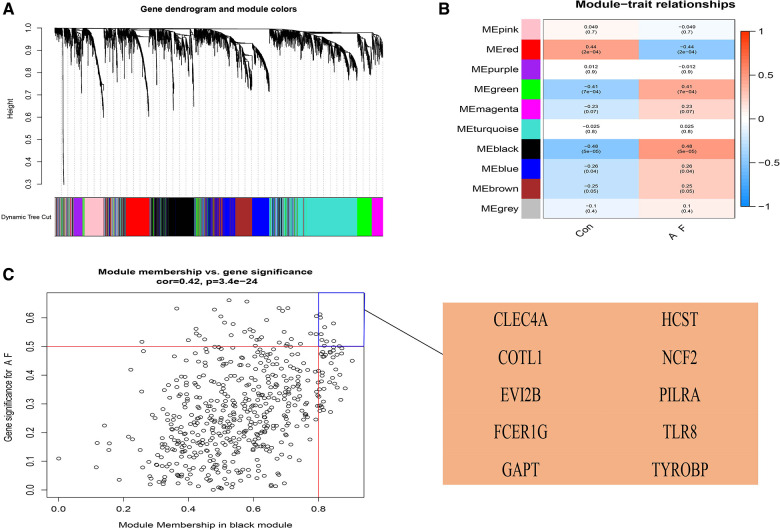
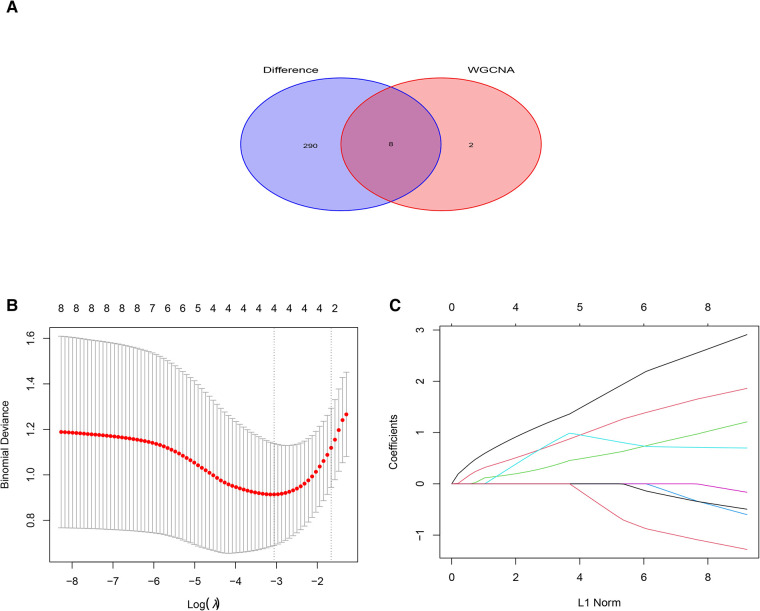
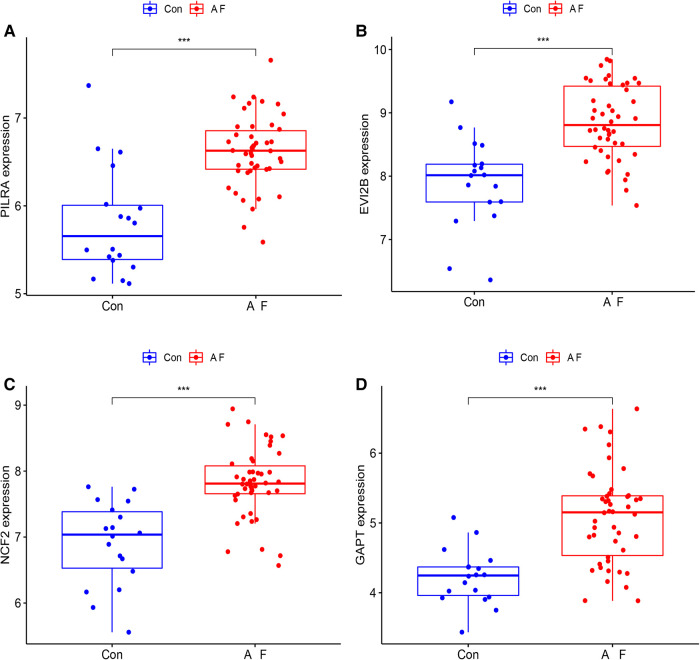
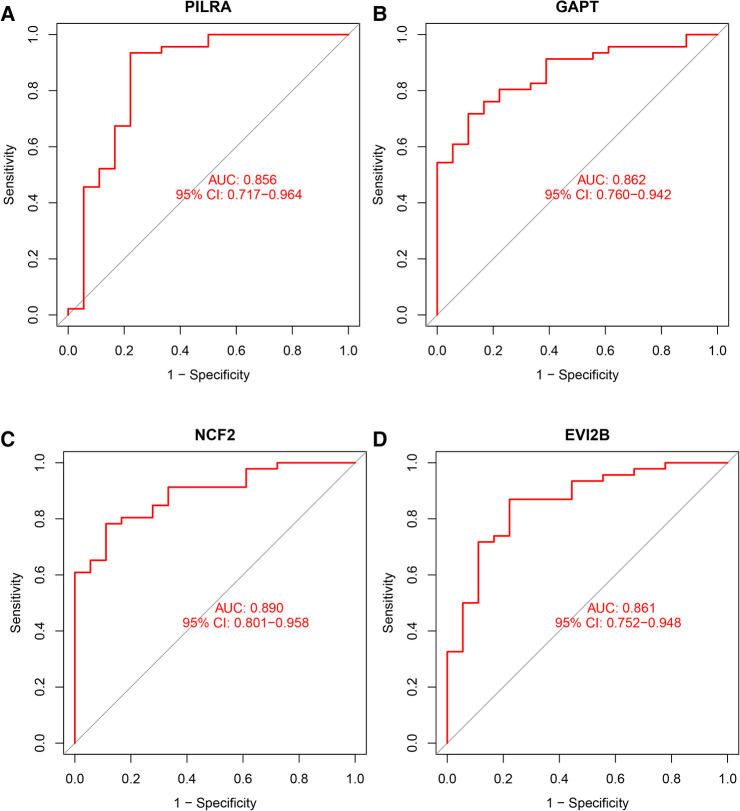
Results: We obtained 298 DGEs from the heatmap and found that DGEs were closely related to inflammation, immunity, and cytokine interactions by enrichment analyses. We obtained 10 co-expression modules by WGCNA. Among them, the module including CLEC4A, COTL1, EVI2B, FCER1G, GAPT, HCST, NCF2, PILRA, TLR8, and TYROBP had the highest correlation with AF. Four Hub genes (PILRA, NCF2, EVI2B, GAPT) were obtained further by LASSO analysis. The results suggested that the expression level of PILRA was significantly elevated in the rats with AF by qPCR, compared to the rats without AF. The results revealed that the infiltration of neutrophils, macrophages, monocytes, mast cells, immature B cells, myeloid-derived suppressor cell (MDSC), dendritic cell, and T cells and their partial subpopulations were closely related to AF by ssGSEA analysis, and PILRA was positively correlated with immature B cell, monocyte, macrophage, mast cell, dendritic cell, and T cells and their partial subpopulations by Spearman correlation analysis.
Conclusions: PILRA was closely related to multiple types of immune cell infiltration, which may be associated with AF. PILRA may be a novel target of intervention for AF.
Keywords: atrial fibrillation; immune cells 1nfiltration; inflammation; least absolute shrinkage selection operator (LASSO) regression analysis; weighted gene co-expression network analysis (WGCNA).
© 2023 Shi, Li, Su, Liu, Wu, Li, He, Zhong and Jiang.
Conflict of interest statement
The authors declare that the research was conducted in the absence of any commercial or financial relationships that could be construed as a potential conflict of interest.
Figures

Similar articles
-
[Pathogenesis and potential diagnostic biomarkers of atrial fibrillation in Chinese population: a study based on bioinfor-matics].Zhejiang Da Xue Xue Bao Yi Xue Ban. 2024 Oct 25;53(5):593-603. doi: 10.3724/zdxbyxb-2024-0027. Zhejiang Da Xue Xue Bao Yi Xue Ban. 2024. PMID: 39319462 Free PMC article. Chinese.
-
Dysregulation and imbalance of innate and adaptive immunity are involved in the cardiomyopathy progression.Front Cardiovasc Med. 2022 Sep 6;9:973279. doi: 10.3389/fcvm.2022.973279. eCollection 2022. Front Cardiovasc Med. 2022. PMID: 36148059 Free PMC article.
-
Comprehensive analysis to identify a novel diagnostic marker of lung adenocarcinoma and its immune infiltration landscape.Front Oncol. 2023 Jun 20;13:1199608. doi: 10.3389/fonc.2023.1199608. eCollection 2023. Front Oncol. 2023. PMID: 37409245 Free PMC article.
-
Identification of hub biomarkers and immune cell infiltration characteristics of polymyositis by bioinformatics analysis.Front Immunol. 2022 Sep 26;13:1002500. doi: 10.3389/fimmu.2022.1002500. eCollection 2022. Front Immunol. 2022. PMID: 36225941 Free PMC article.
-
Bioinformatics analysis reveals the potential common genes and immune characteristics between atrial fibrillation and periodontitis.J Periodontal Res. 2024 Feb;59(1):104-118. doi: 10.1111/jre.13192. Epub 2023 Nov 16. J Periodontal Res. 2024. PMID: 37971162
Cited by
-
Integrative bioinformatics analysis reveals STAT2 as a novel biomarker of inflammation-related cardiac dysfunction in atrial fibrillation.Open Med (Wars). 2023 Nov 9;18(1):20230834. doi: 10.1515/med-2023-0834. eCollection 2023. Open Med (Wars). 2023. PMID: 38025532 Free PMC article.
-
Knockdown of BATF alleviates lung injury in septic neonates through transcriptional regulation of COTL1.Cent Eur J Immunol. 2024;49(3):238-251. doi: 10.5114/ceji.2024.144865. Epub 2024 Nov 18. Cent Eur J Immunol. 2024. PMID: 39720271 Free PMC article.
-
[Pathogenesis and potential diagnostic biomarkers of atrial fibrillation in Chinese population: a study based on bioinfor-matics].Zhejiang Da Xue Xue Bao Yi Xue Ban. 2024 Oct 25;53(5):593-603. doi: 10.3724/zdxbyxb-2024-0027. Zhejiang Da Xue Xue Bao Yi Xue Ban. 2024. PMID: 39319462 Free PMC article. Chinese.
-
Comprehensive analysis of sialylation-related genes and construct the prognostic model in sepsis.Sci Rep. 2024 Aug 5;14(1):18110. doi: 10.1038/s41598-024-69185-x. Sci Rep. 2024. PMID: 39103477 Free PMC article.
-
Therapeutic implications of endoplasmic reticulum stress gene CCL3 in cervical squamous cell carcinoma.Cell Biol Toxicol. 2025 Feb 20;41(1):47. doi: 10.1007/s10565-024-09949-3. Cell Biol Toxicol. 2025. PMID: 39976849 Free PMC article.
References
LinkOut - more resources
Full Text Sources
Miscellaneous