. 2023 Jun 16:10:1136760.
doi: 10.3389/fcvm.2023.1136760. eCollection 2023.

Pixel-wise statistical analysis of myocardial injury in STEMI patients with delayed enhancement MRI

Affiliations

Pixel-wise statistical analysis of myocardial injury in STEMI patients with delayed enhancement MRI

Nicolas Duchateau et al. Front Cardiovasc Med. .

Abstract

Objectives: Myocardial injury assessment from delayed enhancement magnetic resonance images is routinely limited to global descriptors such as size and transmurality. Statistical tools from computational anatomy can drastically improve this characterization, and refine the assessment of therapeutic procedures aiming at infarct size reduction. Based on these techniques, we propose a new characterization of myocardial injury up to the pixel resolution. We demonstrate it on the imaging data from the Minimalist Immediate Mechanical Intervention randomized clinical trial (MIMI: NCT01360242), which aimed at comparing immediate and delayed stenting in acute ST-Elevation Myocardial Infarction (STEMI) patients.

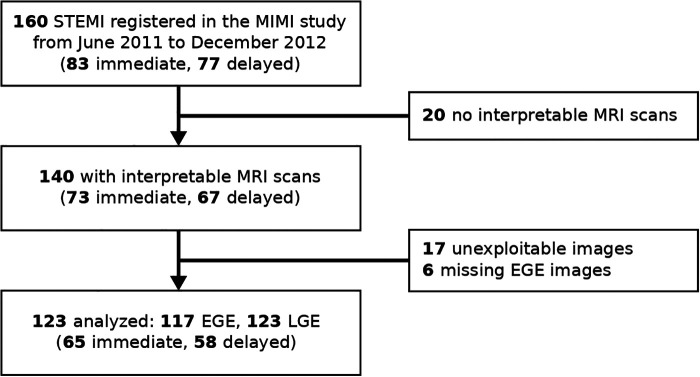
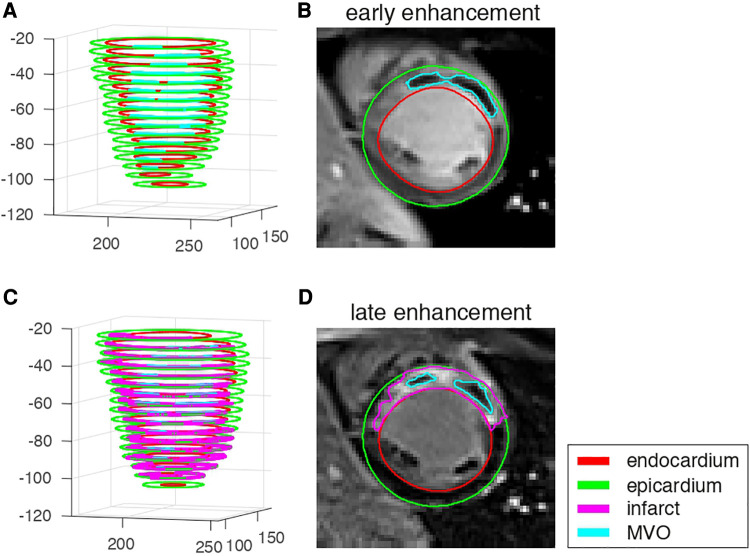
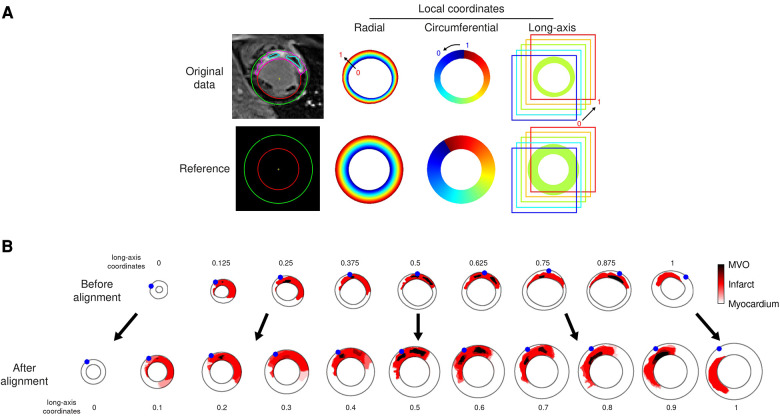
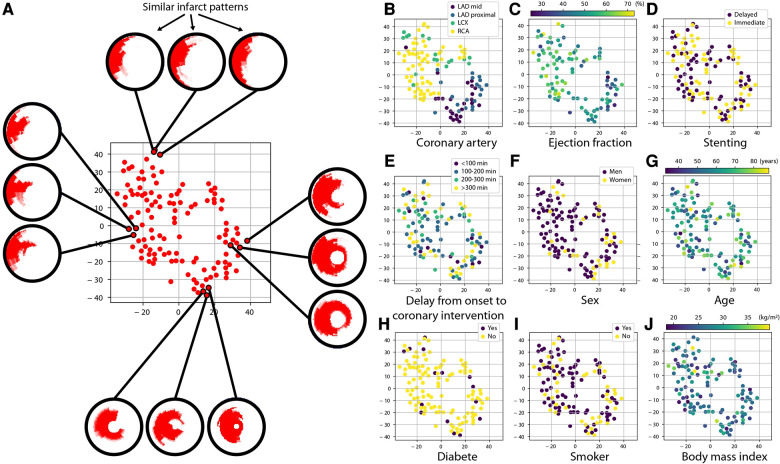
Methods: We analyzed 123 patients from the MIMI trial (62 ± 12 years, 98 male, 65 immediate 58 delayed stenting). Early and late enhancement images were transported onto a common geometry using techniques inspired by statistical atlases, allowing pixel-wise comparisons across population subgroups. A practical visualization of lesion patterns against specific clinical and therapeutic characteristics was also proposed using state-of-the-art dimensionality reduction.

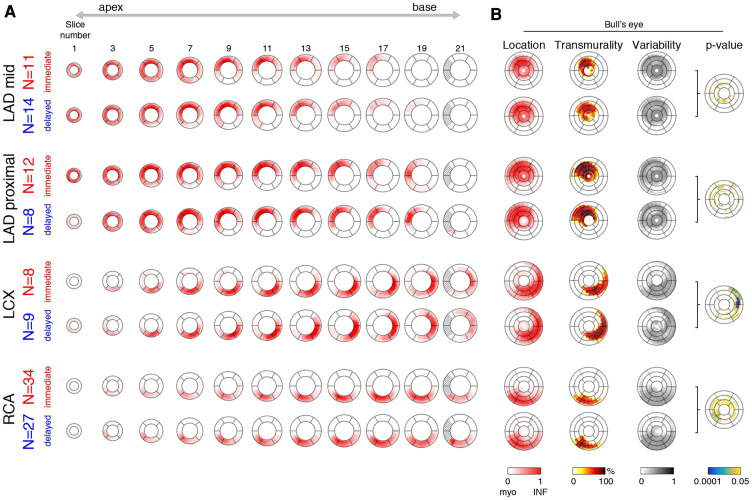
Results: Infarct patterns were roughly comparable between the two treatments across the whole myocardium. Subtle but significant local differences were observed for the LCX and RCA territories with higher transmurality for delayed stenting at lateral and inferior/inferoseptal locations, respectively (15% and 23% of myocardial locations with a p-value <0.05, mainly in these regions). In contrast, global measurements were comparable for all territories (no statistically significant differences for all-except-one measurements before standardization / for all after standardization), although immediate stenting resulted in more subjects without reperfusion injury.

Conclusion: Our approach substantially empowers the analysis of lesion patterns with standardized comparisons up to the pixel resolution, and may reveal subtle differences not accessible with global observations. On the MIMI trial data as illustrative case, it confirmed its general conclusions regarding the lack of benefit of delayed stenting, but revealed subgroups differences thanks to the standardized and finer analysis scale.

Keywords: acute myocadial infarction; delayed enhancement MRI; infarct size; microvascular obstruction; statistical atlas.


Conflict of interest statement

MV and PCr have research agreements with Siemens and Circle Cardiovascular Imaging. However, these agreements did not influence the contents of this work, which was not sponsored. The other authors have no relationships to disclose.

Figures

Figure 1
Figure 1
Study flow chart. EGE, early Gadolinium enhancement; LGE, late Gadolinium enhancement; STEMI, ST-elevation myocardial infarction.
Figure 2
Figure 2
EGE and LGE data from one representative patient with microvascular obstruction and infarct. (A,C): 3D stacks of the segmented structures on each slice. (B,D): image data and segmented structures on a mid-cavity slice.
Figure 3
Figure 3
Data alignment steps illustrated on the representative patient from Figure 1. (A): automatically defined radial-circumferential-long axis coordinates on the studied subject’s anatomy, and on the reference used for the statistical analysis of the whole population. The color encodes the coordinates value ranging from 0 to 1 (long-axis coordinate = 0.625 for this slice). (B): standardization of the image data onto the reference (one slice out of two displayed for the sake of clarity, numbers indicate the standardized long-axis coordinates). The red and dark colors encode the segmented infarct and MVO, respectively. The blue dots stand for the location of the LV-RV junction on each slice.
Figure 4
Figure 4
Representative infarct patterns depending on treatment (immediate vs. delayed) and territories (LAD mid or proximal, LCX, and RCA). (A): average pattern for each subgroup, from apex to base (one slice out of two displayed for the sake of clarity). The dashed region corresponds to incomplete myocardium at the basal level. (B): Bull’s eye representation that summarizes this information across slices: infarct location and variability, transmurality, and statistical differences between the two treatment options (p-value displayed in a logarithmic color scale).
Figure 5
Figure 5
Link between infarct patterns and other variables of interest. Each subplot depicts the same cloud of points, which is a simplified two-dimensional visualization (of arbitrary units) obtained with the t-SNE algorithm of how subjects differ regarding their infarct shape: two subjects with similar/dissimilar infarct shape are placed close/far from each other, as illustrated on subplot (A). Beforehand, infarct patterns of any territory were realigned to match the LAD territory, so that observations focus on the actual pattern shape and not its position around the myocardium. On subplots (BJ), the color code indicates the value of a specific clinical and therapeutic characteristic of the patients. Infarct shapes appear consistent across a given coronary artery territory and differ more between different territories. A slightly similar trend is observed regarding ejection fraction. In contrast, no link is observed for the other variables.

Similar articles

Cited by

References

    1. Wince WB, Suranyi P, Schoepf UJ. Contemporary cardiovascular imaging methods for the assessment of at-risk myocardium. J Am Heart Assoc. (2013) 3:e000473. 10.1161/JAHA.113.000473 - DOI - PMC - PubMed
    1. Ibanez B, Aletras AH, Arai AE, Arheden H, Bax J, Berry C, et al. Cardiac MRI endpoints in myocardial infarction experimental and clinical trials: JACC scientific expert panel. J Am Coll Cardiol. (2019) 74:238–56. 10.1016/j.jacc.2019.05.024 - DOI - PMC - PubMed
    1. Beijnink CWH, van der Hoeven NW, Konijnenberg LSF, Kim RJ, Bekkers SCAM, Kloner RA, et al. Cardiac MRI to visualize myocardial damage after ST-segment elevation myocardial infarction: a review of its histologic validation. Radiology. (2021) 301:4–18. 10.1148/radiol.2021204265 - DOI - PubMed
    1. Ortiz-Pérez JT, Meyers SN, Lee DC, Kansal P, Klocke FJ, Holly TA, et al. Angiographic estimates of myocardium at risk during acute myocardial infarction: validation study using cardiac magnetic resonance imaging. Eur Heart J. (2007) 28:1750–8. 10.1093/eurheartj/ehm212 - DOI - PubMed
    1. Alexandre J, Saloux E, Dugué AE, Lebon A, Lemaitre A, Roule V, et al. Scar extent evaluated by late gadolinium enhancement CMR: a powerful predictor of long term appropriate ICD therapy in patients with coronary artery disease. J Cardiovasc Magn Reson. (2013) 15:12. 10.1186/1532-429X-15-12 - DOI - PMC - PubMed

LinkOut - more resources