

Divergence of wastewater SARS-CoV-2 and reported laboratory-confirmed COVID-19 incident case data coincident with wide-spread availability of at-home COVID-19 antigen tests
- PMID: 37397016
- PMCID: PMC10312197
- DOI: 10.7717/peerj.15631
Divergence of wastewater SARS-CoV-2 and reported laboratory-confirmed COVID-19 incident case data coincident with wide-spread availability of at-home COVID-19 antigen tests
Abstract
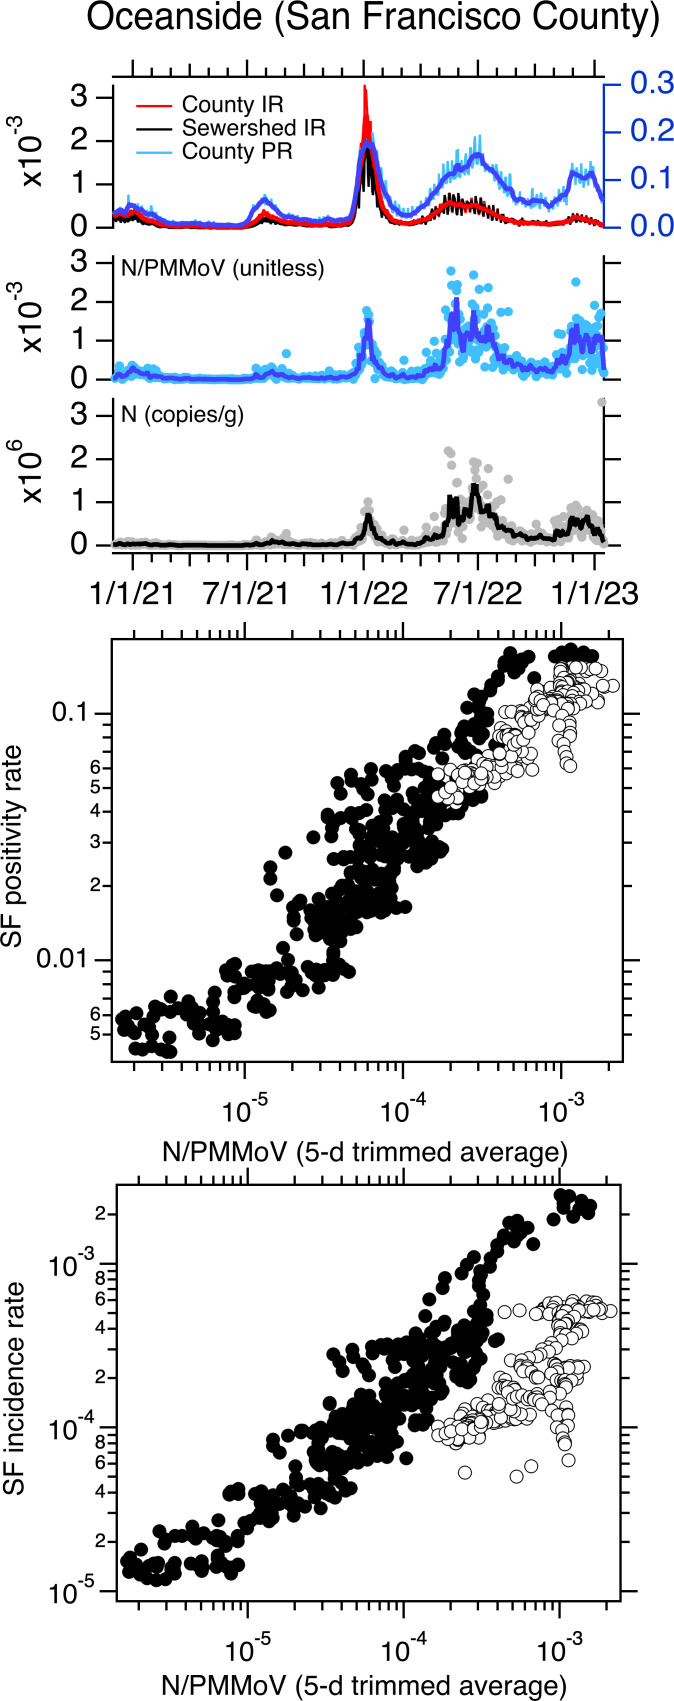
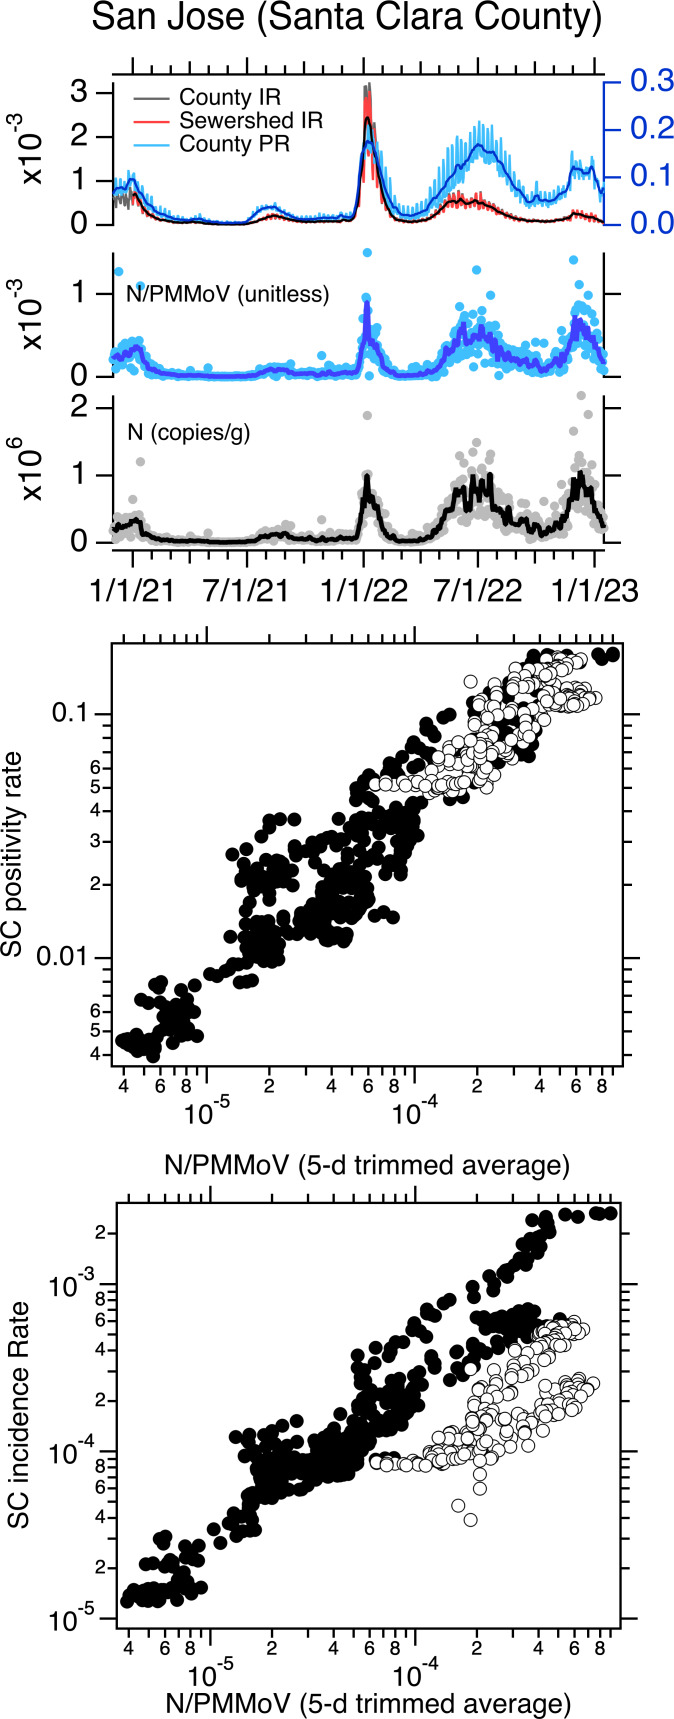
Concentrations of SARS-CoV-2 RNA in wastewater settled solids from publicly owned treatment works (POTWs) historically correlated strongly with laboratory confirmed incident COVID-19 case data. With the increased availability of at-home antigen tests since late 2021 and early 2022, laboratory test availability and test seeking behavior has decreased. In the United States, the results from at-home antigen tests are not typically reportable to public health agencies and thus are not counted in case reports. As a result, the number of reported laboratory-confirmed incident COVID-19 cases has decreased dramatically, even during times of increased test positivity rates and wastewater concentrations of SARS-CoV-2 RNA. Herein, we tested whether the correlative relationship between wastewater concentrations of SARS-CoV-2 RNA and reported laboratory-confirmed COVID-19 incidence rate has changed since 1 May 2022, a point in time immediately before the onset of the BA.2/BA.5 surge, the first surge to begin after at-home antigen test availability was high in the region. We used daily data from three POTWs in the Greater San Francisco Bay Area of California, USA for the analysis. We found that although there is a significant positive association between wastewater measurements and incident rate data collected after 1 May 2022, the parameters describing the relationship are different than those describing the relationship between the data collected prior to 1 May 2022. If laboratory test seeking or availability continues to change, the relationship between wastewater and reported case data will continue to change. Our results suggest, assuming SARS-CoV-2 RNA shedding remains relatively stable among those infected with the virus as different variants emerge, that wastewater concentrations of SARS-CoV-2 RNA can be used to estimate COVID-19 cases as they would have been during the time when laboratory testing availability and test seeking behavior were at a high (here, before 1 May 2022) using the historical relationship between SARS-CoV-2 RNA and COVID-19 case data.
Keywords: COVID-19; COVID-19 antigen tests; Public health; SARS-CoV-2; Viruses; Wastewater-based epidemiology.
©2023 Boehm et al.
Conflict of interest statement
Bradley J. White, Dorothea Duong, and Bridgette Hughes are employees of Verily Life Sciences, LLC. There are no other competing interests.
Figures

References
-
- Ahmed W, Bertsch PM, Angel N, Bibby K, Bivins A, Dierens L, Edson J, Ehret J, Gyawali P, Hamilton KA, Hosegood I, Hugenholtz P, Jiang G, Kitajima M, Sichani HT, Shi J, Shimko KM, Simpson SL, Smith WJM, Symonds EM, Thomas KV, Verhagen R, Zaugg J, Mueller JF. Detection of SARS-CoV-2 RNA in commercial passenger aircraft and cruise ship wastewater: a surveillance tool for assessing the presence of COVID-19 infected travellers. Journal of Travel Medicine. 2020;27:taaa116. doi: 10.1093/jtm/taaa116. - DOI - PMC - PubMed
-
- Anjos D, Fiaccadori FS, do Servian PC, da Fonseca SG, Guilarde AO, Borges MASB, Franco FC, Ribeiro BM, Souza M. SARS-CoV-2 loads in urine, sera and stool specimens in association with clinical features of COVID-19 patients. Journal of Clinical Virology Plus. 2022;2(1):100059. doi: 10.1016/j.jcvp.2021.100059. - DOI - PMC - PubMed
-
- Boehm AB, Hughes B, Doung D, Chan-Herur V, Buchman A, Wolfe MK, White BJ. Wastewater surveillance of human influenza, metapneumovirus, parainfluenza, respiratory syncytial virus (RSV), rhinovirus, and seasonal coronaviruses during the COVID-19 pandemic. medRxiv. 2022a doi: 10.1101/2022.09.22.22280218.2022.09.22.22280218 - DOI - PMC - PubMed
Publication types
MeSH terms
Substances
LinkOut - more resources
Full Text Sources
Medical
Research Materials
Miscellaneous
