. 2023 Jun 15:17:1172856.
doi: 10.3389/fnsys.2023.1172856. eCollection 2023.

Diversity of electroencephalographic patterns during propofol-induced burst suppression

Affiliations

Diversity of electroencephalographic patterns during propofol-induced burst suppression

Keith G Jones et al. Front Syst Neurosci. .

Abstract

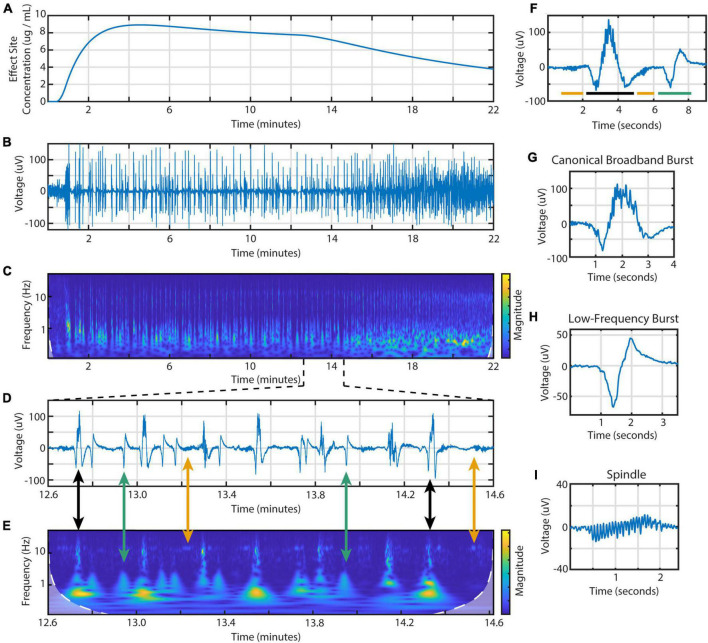
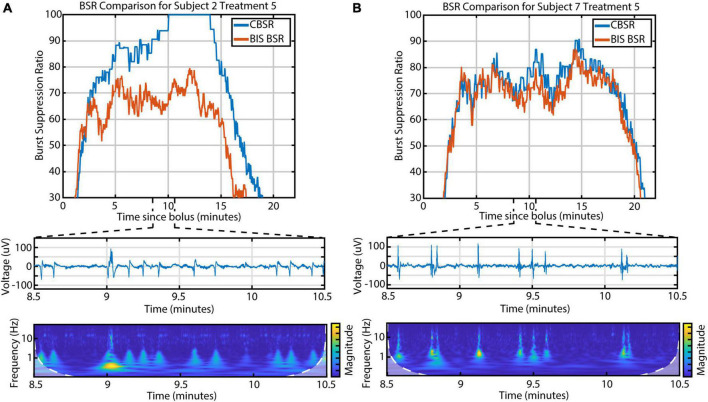
Burst suppression is a brain state consisting of high-amplitude electrical activity alternating with periods of quieter suppression that can be brought about by disease or by certain anesthetics. Although burst suppression has been studied for decades, few studies have investigated the diverse manifestations of this state within and between human subjects. As part of a clinical trial examining the antidepressant effects of propofol, we gathered burst suppression electroencephalographic (EEG) data from 114 propofol infusions across 21 human subjects with treatment-resistant depression. This data was examined with the objective of describing and quantifying electrical signal diversity. We observed three types of EEG burst activity: canonical broadband bursts (as frequently described in the literature), spindles (narrow-band oscillations reminiscent of sleep spindles), and a new feature that we call low-frequency bursts (LFBs), which are brief deflections of mainly sub-3-Hz power. These three features were distinct in both the time and frequency domains and their occurrence differed significantly across subjects, with some subjects showing many LFBs or spindles and others showing very few. Spectral-power makeup of each feature was also significantly different across subjects. In a subset of nine participants with high-density EEG recordings, we noted that each feature had a unique spatial pattern of amplitude and polarity when measured across the scalp. Finally, we observed that the Bispectral Index Monitor, a commonly used clinical EEG monitor, does not account for the diversity of EEG features when processing the burst suppression state. Overall, this study describes and quantifies variation in the burst suppression EEG state across subjects and repeated infusions of propofol. These findings have implications for the understanding of brain activity under anesthesia and for individualized dosing of anesthetic drugs.

Keywords: anesthesia; burst suppression; depression; electroencephalograph (EEG); propofol.


Conflict of interest statement

The authors declare that the research was conducted in the absence of any commercial or financial relationships that could be construed as a potential conflict of interest.

Figures

FIGURE 1
FIGURE 1
Time- and frequency-domain representations of burst suppression during an individual propofol infusion session. Data is from the BIS Monitor EEG of subject 2, infusion 4. (A) The estimated effect site concentration, (B) raw EEG and (C) scalogram from 22 min of a propofol infusion. (D) A zoomed in section showing the three types of EEG activity and (E) scalogram. Black arrows indicate canonical broadband bursts; green, low-frequency bursts; yellow, spindles. (F) Individual examples of all three features including a (G) canonical broadband burst, (H) low-frequency burst, and (I) spindle.
FIGURE 2
FIGURE 2
The three different EEG burst-suppression features can be differentiated by their frequency parameters. Canonical broadband bursts (CBBs) exhibit the highest power in the 3–10 Hz range, spindles show the highest 13–17 Hz power, and low-frequency bursts (LFBs) are low in both. Example from subject 2 across five high-dose propofol infusions. Color indicates feature categorization by an automated algorithm.
FIGURE 3
FIGURE 3
The variation in occurrence and power makeup of all three burst suppression features across 21 subjects. (A) The number of features per propofol infusion is shown for each subject. Boxplots indicate median, upper and lower quartiles (blue rectangle), non-outlier range (black), and outliers (blue circles, greater than 1.5 interquartile range outside upper and lower quartiles). (B) The relative spectral power composition of each feature type, averaged across propofol infusions, for each subject.
FIGURE 4
FIGURE 4
Correlation of onset times between burst suppression feature types. Blue lines denote upper and lower 99% confidence intervals. Time series data consisted of all BIS Monitor burst suppression EEG from all subjects (approximately 2820 min). (A) Cross-correlograms between CBB, LFB, and spindle onset. Spindles tend to occur immediately after canonical broadband bursts. (B) Auto-correlograms of CBB, LFB, and spindle onset. Spindles were most likely to occur about 8 s after another spindle.
FIGURE 5
FIGURE 5
Different burst suppression features show consistently different EEG patterns across the scalp in subject 20 during a single infusion. Data is from the 64-channel EEG of subject 20, infusion 6. Values shown are current source density from a Laplacian transform. (A) Canonical broadband bursts exhibit different amplitudes and polarities in an anterior/posterior pattern. (B) Low-frequency bursts are localized and primarily detected in the left or right frontotemporal region in this subject. (C) Spindles are seen across all electrodes but are mostly negative and largest in amplitude in medial frontal electrodes.
FIGURE 6
FIGURE 6
The discrepancy between the BIS BSR and CBSR is largely driven by the occurrence of LFBs and spindles. (A) An example infusion with a high occurrence of LFBs, recognizable in both the raw EEG and scalogram, shows a large difference between BSR calculations. (B) An example infusion with few-to-no LFBs shows consistency between BSR calculations.

Similar articles

Cited by

References

    1. Akrawi W. P., Drummond J. C., Kalkman C. J., Patel P. M. (1996). A comparison of the electrophysiologic characteristics of EEG burst-suppression as produced by isoflurane, thiopental, etomidate, and propofol. J. Neurosurg. Anesthesiol. 8 40–46. 10.1097/00008506-199601000-00010 - DOI - PubMed
    1. An J., Jonnalagadda D., Moura V., Purdon P. L., Brown E. N., Westover M. B. (2015). Spatial variation in automated burst suppression detection in pharmacologically induced coma. Annu. Int. Conf. IEEE Eng. Med. Biol. Soc. 2015 7430–7433. 10.1109/embc.2015.7320109 - DOI - PMC - PubMed
    1. Andresen J. M., Girard T. D., Pandharipande P. P., Davidson M. A., Ely E. W., Watson P. L. (2014). Burst suppression on processed electroencephalography as a predictor of postcoma delirium in mechanically ventilated ICU patients. Crit. Care Med. 42 2244–2251. 10.1097/ccm.0000000000000522 - DOI - PMC - PubMed
    1. Besch G., Liu N., Samain E., Pericard C., Boichut N., Mercier M., et al. (2011). Occurrence of and risk factors for electroencephalogram burst suppression during propofol–remifentanil anaesthesia. Br. J. Anaesth. 107 749–756. 10.1093/bja/aer235 - DOI - PubMed
    1. Brandon Westover M., Ching S., Kumaraswamy V. M., Akeju O., Pierce E., Cash S. S., et al. (2015). The human burst suppression electroencephalogram of deep hypothermia. Clin. Neurophysiol. 126 1901–1914. 10.1016/j.clinph.2014.12.022 - DOI - PMC - PubMed