. 2023 Jun 15:11:1181040.
doi: 10.3389/fcell.2023.1181040. eCollection 2023.

Promising AAV.U7snRNAs vectors targeting DMPK improve DM1 hallmarks in patient-derived cell lines

Affiliations

Promising AAV.U7snRNAs vectors targeting DMPK improve DM1 hallmarks in patient-derived cell lines

Camila F Almeida et al. Front Cell Dev Biol. .

Abstract

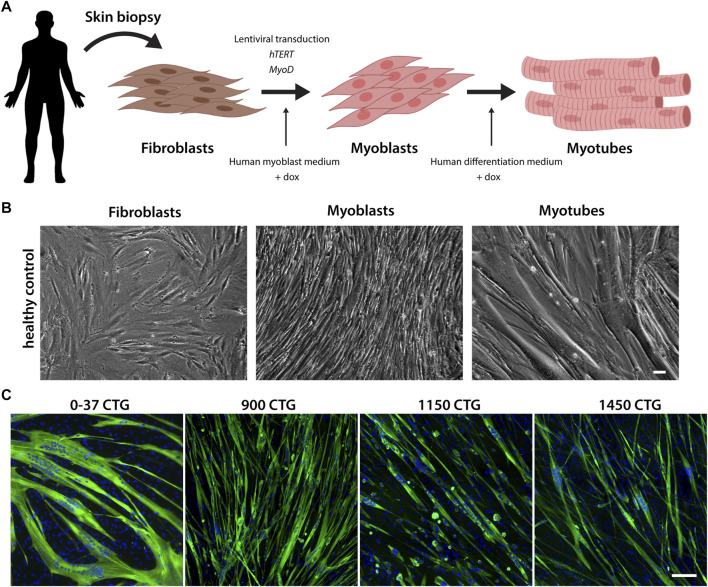
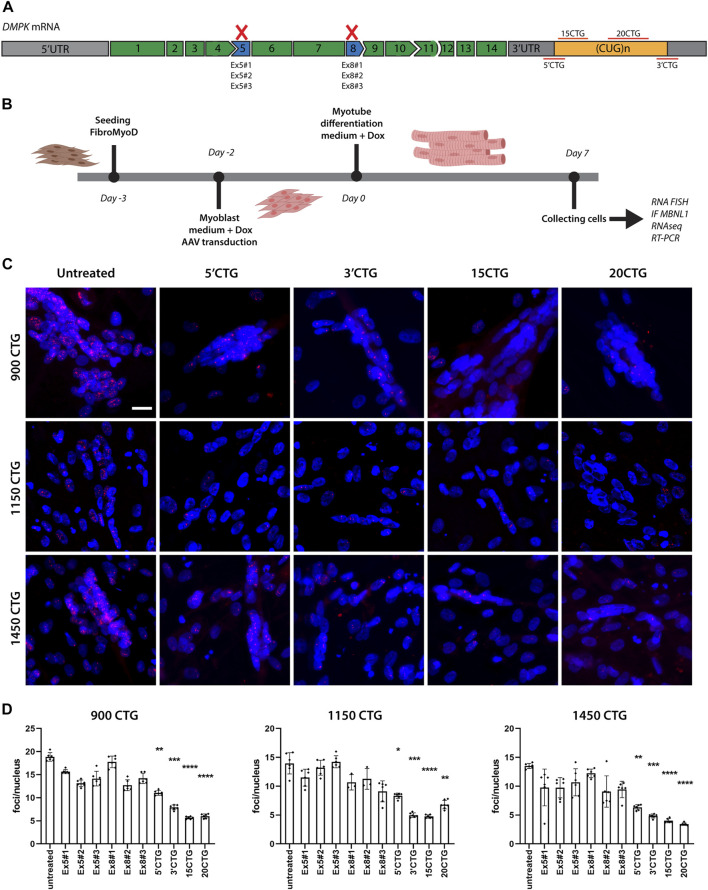
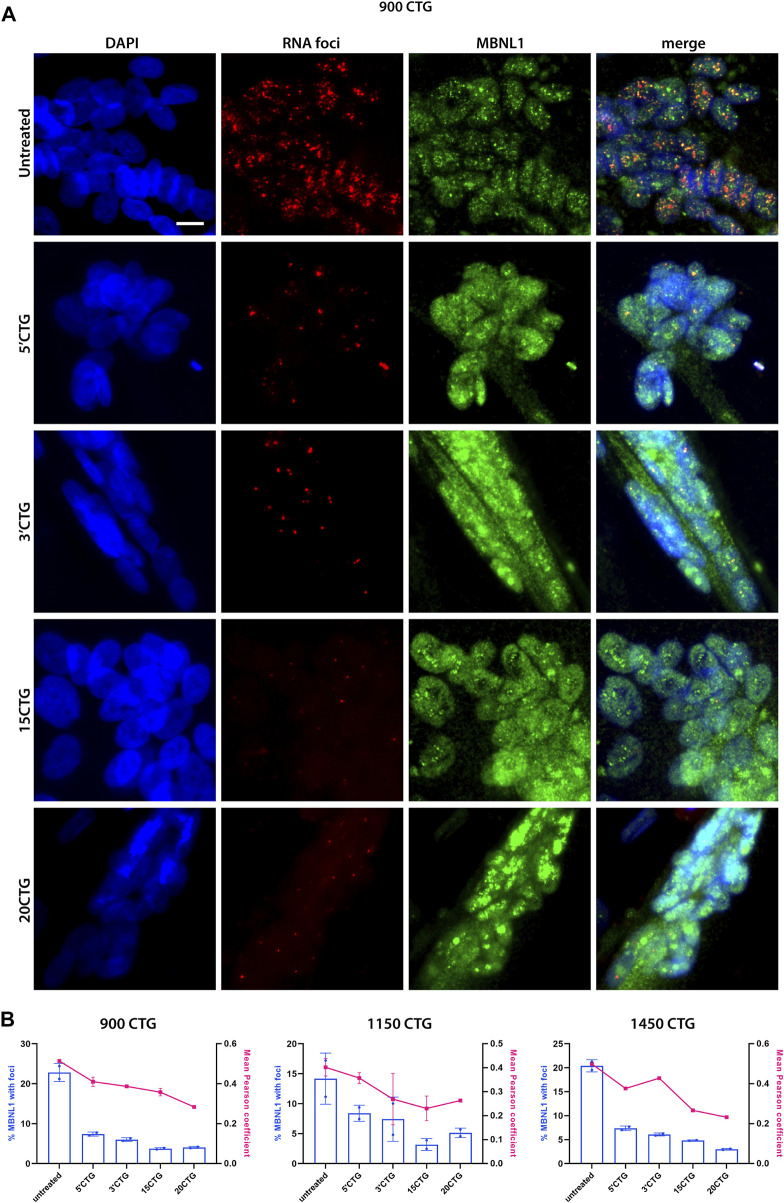
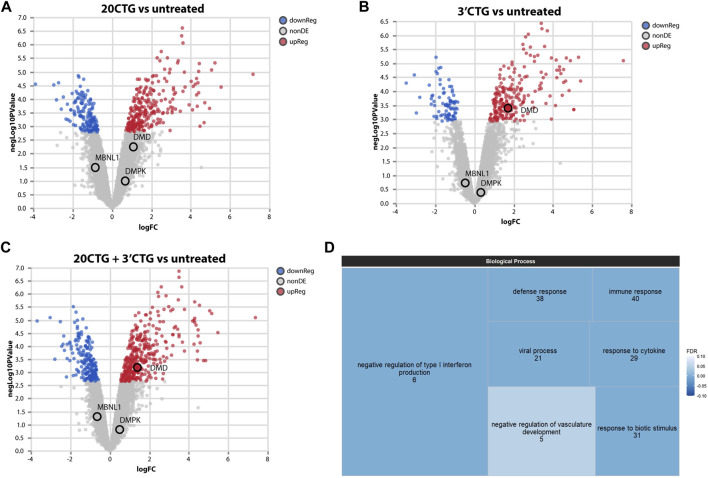
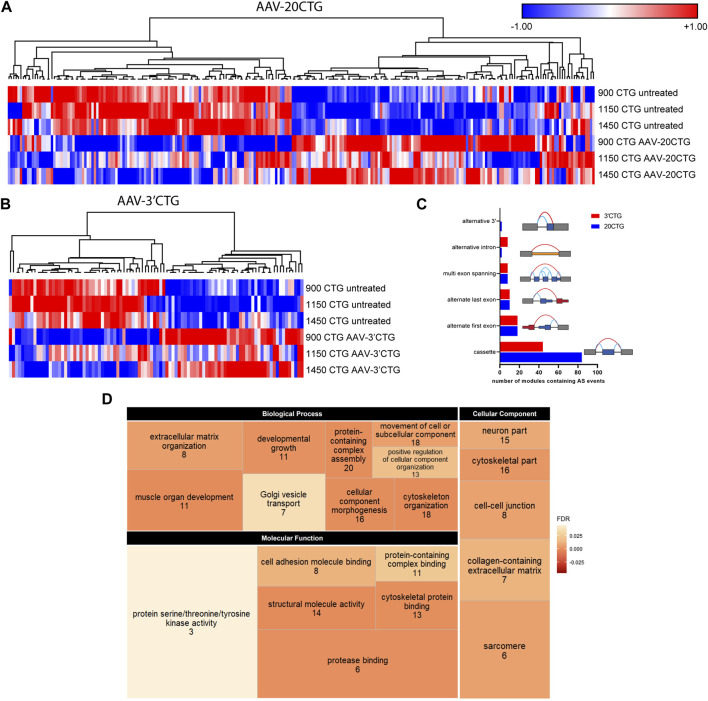
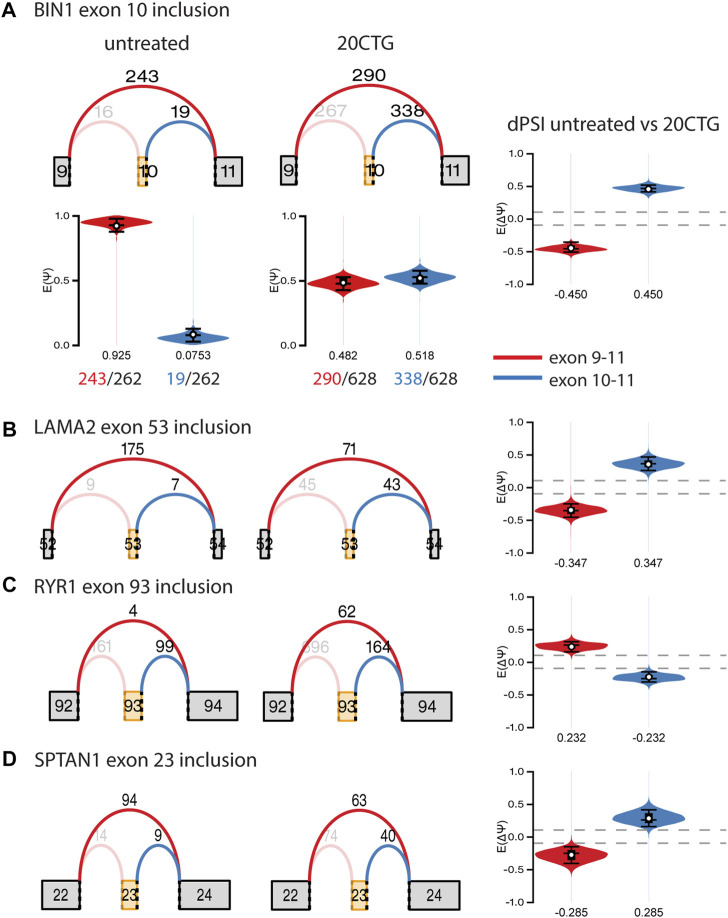
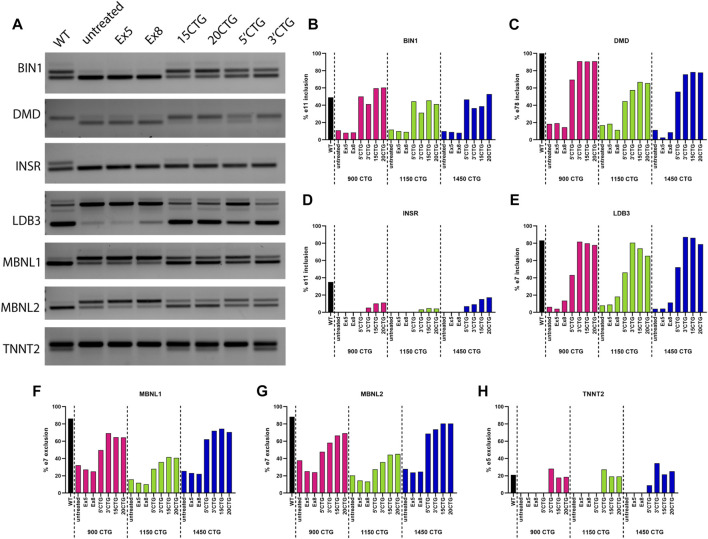
Myotonic dystrophy type 1 (DM1) is the most common form of muscular dystrophy in adults and affects mainly the skeletal muscle, heart, and brain. DM1 is caused by a CTG repeat expansion in the 3'UTR region of the DMPK gene that sequesters muscleblind-like proteins, blocking their splicing activity and forming nuclear RNA foci. Consequently, many genes have their splicing reversed to a fetal pattern. There is no treatment for DM1, but several approaches have been explored, including antisense oligonucleotides (ASOs) aiming to knock down DMPK expression or bind to the CTGs expansion. ASOs were shown to reduce RNA foci and restore the splicing pattern. However, ASOs have several limitations and although being safe treated DM1 patients did not demonstrate improvement in a human clinical trial. AAV-based gene therapies have the potential to overcome such limitations, providing longer and more stable expression of antisense sequences. In the present study, we designed different antisense sequences targeting exons 5 or 8 of DMPK and the CTG repeat tract aiming to knock down DMPK expression or promote steric hindrance, respectively. The antisense sequences were inserted in U7snRNAs, which were then vectorized in AAV8 particles. Patient-derived myoblasts treated with AAV8. U7snRNAs showed a significant reduction in the number of RNA foci and re-localization of muscle-blind protein. RNA-seq analysis revealed a global splicing correction in different patient-cell lines, without alteration in DMPK expression.

Keywords: U7snRNA; aav; gene therapy; myotonic dystrophy; spliceopathy.


Conflict of interest statement

Since the performance of this work, Nationwide Children’s Hospital licensed the vector described herein to Audentes/Astellas Therapeutics. NW and KF have received royalty payments as a result of this license. NW is a Scientific Advisor for Alcyone Therapeutics. The remaining authors declare that the research was conducted in the absence of any commercial or financial relationships that could be construed as a potential conflict of interest.

Figures

FIGURE 1
FIGURE 1
Reprogramming of fibroblasts into myogenic cells. (A). Schematic representation of the fibroblast conversion into myotubes. Primary fibroblasts are derived from skin biopsies and co-transfected with lentiviruses carrying the hTERT and MYOD genes. Upon the addition of doxycycline, the transcription of MYOD is activated, inducing the activation of the myogenic program. Within 2–4 days, the fibroblasts acquire a myoblast morphology, and when differentiation medium is added, they start to fuse and form mature multinucleated myotubes. (B) Representative brightfield images of the conversion stages. Scale bar = 100 µm. (C) Differentiation of FM lines was confirmed by myosin heavy chain expression (green). Nuclei in blue. Scale bar = 100 µm.
FIGURE 2
FIGURE 2
Delivery of U7snRNAs containing antisense sequences targeting the 3'UTR/CUG tract region decreases the number of RNA foci. (A) Schematic representation of antisense sequence targets. (B) Experimental design. (C) RNA FISH with Cy3-(CAG)10 probes in untreated and treated DM1 cell lines. RNA foci are recognized as discrete bright dots (in red) in nuclei. Nuclei counterstained with Hoechst 33342 (blue). Scale bar = 20 μm. (D) Quantification of foci number per nucleus before and after treated with the different constructs. Over 10,000 nuclei were quantified in each condition. Data are presented as mean with standard deviation. Kruskal-Wallis test followed by Dun's multiple comparisons to untreated samples. *p < 0.05; **p < 0.01; ***p < 0.001; ****p < 0.0001.
FIGURE 3
FIGURE 3
MBNL1 is released from RNA foci and re-localizes in the nucleoplasm. (A) RNA FISH (red) combined with immunofluorescence staining for MBNL1 (green) on 900CTG DM1 cell line, before and after treatment with AAV8.U7snRNAs targeting the 3’UTR/CUG tract region. In untreated cells, MBNL1 staining shows a dotted pattern and co-localizes with RNA foci, as seen in the merged image. After treatment, the number of RNA foci reduces dramatically, releasing MBNL1 which now shows a diffuse localization in the nucleus. Scale bar = 20 µm. (B) MBNL1 signal quantitative analysis. The bars represent the percentage of MBNL1 that co-localizes with foci and the line indicates the mean Pearson coefficient of correlation.
FIGURE 4
FIGURE 4
Transcriptome analyses of differentially expressed genes. Volcano plots showing up and downregulated genes in DM1 myotubes treated with 20CTG (A) and 3′CTG constructs (B). (C) Volcano plot of the combined transcriptomes of 20CTG and 3′CTG treated myotubes in comparison to untreated cells, highlighting DMD transcript that is upregulated, and MBNL1 and DMPK transcripts that are unchanged. (D) Tree map representing the Gene Ontology analysis of DEGs from C comparison. The size of the rectangles is proportional to the enrichment of the GO term. The numerals correspond to the number of DEGs from the input list involved in the GO term. The color gradient corresponds to the false discovery rate (FDR) where darker blue represents smaller FDR values. FDR cutoff was <0.05.
FIGURE 5
FIGURE 5
Alternative splicing profile by RNA-seq. Heatmap of LSVs between the untreated and 20CTG (A) and 3′CTG (B) treated myotubes with significant ΔΨ. (C) Number of LSVs belonging to each of the categories and the respective schematic representation of the splicing modules. (D) Tree map depicting the three Gene Ontology categories found enriched in the list of LSVs found in the 20CTG treated myotubes. The size of the rectangles is proportional to the enrichment of the GO term. The numerals correspond to the number of genes from the input list involved in the GO term. The color gradient corresponds to the false discovery rate (FDR) where darker orange represents smaller FDR values. FDR cutoff was <0.05.
FIGURE 6
FIGURE 6
Graphs of selected local splice variants with junction read counts and violin plots showing the variation of percent of spliced in (ΔΨ/dPSI) values after treatment with 20CTG. (A) BIN1 exon 10 inclusion. The red and blue arcs represent the junctions, and the numbers above the arcs are the junction read counts. The red and blue violins correspond to the PSI (E(Ψ)) or dPSI values of the respective junctions, where negative values correspond to increased differential inclusion in untreated condition compared with treated condition whereas a positive E [ΔΨ] denotes preference for treated vs. untreated. We show a detailed representation of BIN1 LSV as an example of how the dPSI is generated based on the individual PSI values obtained in each condition. (B) LAMA2 exon 53 inclusion. (C) RYR1 exon 93 inclusion. (D) SPTAN1 exon 23 inclusion.
FIGURE 7
FIGURE 7
Validation of splicing pattern by RT-PCR. (A) Representative gel image of RT-PCR amplification of exons with differential splicing detected by RNA-seq and commonly altered in DM1. The first lane shows the expected normal pattern in healthy control cells. The subsequent lanes show the bands in 900CTG cell line untreated and treated with the different constructs tested in this study. Graphs (B–H) show the quantification of the band intensity of the included/excluded exons for each gene analyzed in the three cell lines. The constructs targeting the 3′UTR/CUG repeats region showed the best splicing correction, equivalent to normal levels.

Similar articles

Cited by

References

    1. Ait Benichou S., Jauvin D., De Serres-Bérard T., Pierre M., Ling K. K., Bennett C. F., et al. (2022). Antisense oligonucleotides as a potential treatment for brain deficits observed in myotonic dystrophy type 1. Gene Ther. 29, 698–709. 10.1038/S41434-022-00316-7 - DOI - PMC - PubMed
    1. Botta A., Malena A., Loro E., Del Moro G., Suman M., Pantic B., et al. (2013). Altered Ca2+ homeostasis and endoplasmic reticulum stress in Myotonic Dystrophy type 1 muscle cells. Genes (Basel) 4, 275–292. 10.3390/genes4020275 - DOI - PMC - PubMed
    1. Carrell S. T., Carrell E. M., Auerbach D., Pandey S. K., Bennett C. F., Dirksen R. T., et al. (2016). Dmpk gene deletion or antisense knockdown does not compromise cardiac or skeletal muscle function in mice. Hum. Mol. Genet. 25, 4328–4338. 10.1093/hmg/ddw266 - DOI - PMC - PubMed
    1. Dansithong W., Paul S., Comai L., Reddy S. (2005). MBNL1 is the primary determinant of focus formation and aberrant insulin receptor splicing in DM1. J. Biol. Chem. 280, 5773–5780. 10.1074/jbc.M410781200 - DOI - PubMed
    1. Davis B. M., Mccurrach M. E., Taneja K. L., Singer R. H., Housman D. E. (1997). Expansion of a CUG trinucleotide repeat in the 3′ untranslated region of myotonic dystrophy protein kinase transcripts results in nuclear retention of transcripts. Proc. Natl. Acad. Sci. U. S. A. 94, 7388–7393. 10.1073/pnas.94.14.7388 - DOI - PMC - PubMed