. 2023 Jun 15:11:1178533.
doi: 10.3389/fcell.2023.1178533. eCollection 2023.

Maternal obesity alters the placental transcriptome in a fetal sex-dependent manner

Affiliations

Maternal obesity alters the placental transcriptome in a fetal sex-dependent manner

Amy Kelly et al. Front Cell Dev Biol. .

Abstract

Infants born to obese mothers have an increased risk of developing obesity and metabolic diseases in childhood and adulthood. Although the molecular mechanisms linking maternal obesity during pregnancy to the development of metabolic diseases in offspring are poorly understood, evidence suggests that changes in the placental function may play a role. Using a mouse model of diet-induced obesity with fetal overgrowth, we performed RNA-seq analysis at embryonic day 18.5 to identify genes differentially expressed in the placentas of obese and normal-weight dams (controls). In male placentas, 511 genes were upregulated and 791 genes were downregulated in response to maternal obesity. In female placentas, 722 genes were downregulated and 474 genes were upregulated in response to maternal obesity. The top canonical pathway downregulated in maternal obesity in male placentas was oxidative phosphorylation. In contrast, sirtuin signaling, NF-kB signaling, phosphatidylinositol, and fatty acid degradation were upregulated. In female placentas, the top canonical pathways downregulated in maternal obesity were triacylglycerol biosynthesis, glycerophospholipid metabolism, and endocytosis. In contrast, bone morphogenetic protein, TNF, and MAPK signaling were upregulated in the female placentas of the obese group. In agreement with RNA-seq data, the expression of proteins associated with oxidative phosphorylation was downregulated in male but not female placentas of obese mice. Similarly, sex-specific changes in the protein expression of mitochondrial complexes were found in placentas collected from obese women delivering large-for-gestational-age (LGA) babies. In conclusion, maternal obesity with fetal overgrowth differentially regulates the placental transcriptome in male and female placentas, including genes involved in oxidative phosphorylation.

Keywords: fetal growth; gene expression; maternal–fetal exchange; mitochondria; trophoblast.


Conflict of interest statement

The authors declare that the research was conducted in the absence of any commercial or financial relationships that could be construed as a potential conflict of interest.

Figures

FIGURE 1
FIGURE 1
Fetal (A) and placental (B) weights, fetal/placental weight ratio (C), and litter size (D) determined at E18.5 in mice from the control and obese groups. Values are means ± SEM, n = 5 in each group, *p < 0.05 vs control; unpaired Student’s t-test. Means without a common letter are statistically different by performing one-way ANOVA with the Tukey–Kramer multiple comparison post hoc test (p < 0.05).
FIGURE 2
FIGURE 2
Venn diagram illustrating differentially expressed genes that overlap between males and females. (A) Number of downregulated genes (obese vs. control) in male and female placentas. (B) Number of upregulated genes (obese vs. control) in male and female placentas.
FIGURE 3
FIGURE 3
Treemap of GO biological process categories upregulated in male placentas of obese dams. REVIGO was used to remove redundant GO terms and join the cluster representatives (single rectangles) into superclusters (represented by different colors). Each rectangle’s size reflects the GO term’s false discovery rate (FDR) value (larger for lower FDR), considering a FDR <0.05 as the criterion for statistical significance after Benjamini–Hochberg correction for multiple testing.
FIGURE 4
FIGURE 4
Treemap of GO cellular component categories upregulated in male placentas of obese dams. REVIGO was used to remove redundant GO terms and join the cluster representatives (single rectangles) into superclusters (represented by different colors). Each rectangle’s size reflects the GO term’s false discovery rate (FDR) value (larger for lower FDR), considering a FDR <0.05 as the criterion for statistical significance after Benjamini–Hochberg correction for multiple testing.
FIGURE 5
FIGURE 5
Treemap of GO molecular function categories upregulated in male placentas of obese dams. REVIGO was used to remove redundant GO terms and join the cluster representatives (single rectangles) into superclusters (represented by different colors). Each rectangle’s size reflects the GO term’s false discovery rate (FDR) value (larger for lower FDR), considering a FDR <0.05 as the criterion for statistical significance after Benjamini–Hochberg correction for multiple testing.
FIGURE 6
FIGURE 6
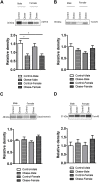
Effect of maternal obesity on the expression of placental mtTFA, Tom70, cytochrome b, and Tom40 in pregnant mice. (A–D) Protein expression of mtTFA, Tom70, cytochrome b, and Tom40 in the placental homogenates of obese and control groups (n = 7/each group). A representative Western blot is shown. Data are from a representative experiment, and similar results were obtained from six other experiments. Values are means +SEM.; *p < 0.05 vs. control by one-way ANOVA with the Tukey–Kramer multiple comparison post hoc test.
FIGURE 7
FIGURE 7
Effect of maternal obesity on the placental expression of Tom20 and cytochrome c in pregnant mice. (A,B) Protein expression of Tom20 and cytochrome c in the placental homogenates of obese and control groups (n = 7/each group). A representative Western blot is shown. Data are from a representative experiment, and similar results were obtained from six other experiments. *p < 0.05 vs. control by one-way ANOVA with the Tukey–Kramer multiple comparison post hoc test.
FIGURE 8
FIGURE 8
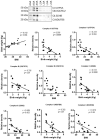
Correlation between maternal BMI, birth weight, and placental mitochondrial, ETC complex (V, III, II, and I) protein expression in male placentas of control (AGA, appropriate-for-gestational-age) and LGA (large-for-gestational-age) pregnancy. r = Pearson’s correlation coefficient, n = 7–11/each group. Placental mitochondrial, ETC complex subunit protein expression in relation to BMI and birth weight. A representative Western blot for mitochondrial, ETC complex subunits (complex V- ATP5F1A, ATP synthase F1 subunit alpha; complex III- UQCRC2, ubiquinol–cytochrome C reductase core protein 2; complex II- SDHB, succinate dehydrogenase complex iron sulfur subunit B; complex I- NDUFB8, NADH-ubiquinone oxidoreductase subunit B8) in homogenates of placentas from pregnancies with varying maternal BMI and birth weights. There was no significant correlation between BMI and mitochondrial, ETC complex subunit III.
FIGURE 9
FIGURE 9
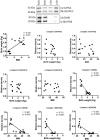
Correlation between maternal BMI, birth weight, and placental mitochondrial, ETC complex (V, III, II, and I) protein expression in female placentas of control (AGA, appropriate-for-gestational-age) and LGA (large-for-gestational-age) pregnancy. r = Pearson’s correlation coefficient, n = 6–10/each group. Placental mitochondrial, ETC complex subunit protein expression in relation to BMI and birth weight. A representative Western blot for mitochondrial, ETC complex subunits (complex V- ATP5F1A, ATP synthase F1 subunit alpha; complex III- UQCRC2, ubiquinol–cytochrome C reductase core protein 2; complex II- SDHB, succinate dehydrogenase complex iron sulfur subunit B; complex I- NDUFB8, NADH-ubiquinone oxidoreductase subunit B8) in homogenates of placentas from pregnancies with varying maternal BMI and birth weights. There was no significant correlation between BMI or birth weight and mitochondrial, ETC complex subunits II and I.

Similar articles

Cited by

References

    1. Abdelraheim S. R., Spiller D. G., McLennan A. G. (2017). Mouse Nudt13 is a mitochondrial Nudix hydrolase with NAD(P)H pyrophosphohydrolase activity. Protein J. 36, 425–432. 10.1007/s10930-017-9734-x - DOI - PMC - PubMed
    1. Alam T. I., Kanki T., Muta T., Ukaji K., Abe Y., Nakayama H., et al. (2003). Human mitochondrial DNA is packaged with TFAM. Nucleic Acids Res. 31, 1640–1645. 10.1093/nar/gkg251 - DOI - PMC - PubMed
    1. Albensi B. C. (2019). What is nuclear factor kappa B (NF-kappaB) doing in and to the mitochondrion? Front. Cell Dev. Biol. 7, 154. 10.3389/fcell.2019.00154 - DOI - PMC - PubMed
    1. Alfaradhi M. Z., Ozanne S. E. (2011). Developmental programming in response to maternal overnutrition. Front. Genet. 2, 27. 10.3389/fgene.2011.00027 - DOI - PMC - PubMed
    1. Alves J. M., Luo S., Chow T., Herting M., Xiang A. H., Page K. A. (2020). Sex differences in the association between prenatal exposure to maternal obesity and hippocampal volume in children. Brain Behav. 10, e01522. 10.1002/brb3.1522 - DOI - PMC - PubMed

LinkOut - more resources