. 2023 Jun 15:13:1174252.
doi: 10.3389/fonc.2023.1174252. eCollection 2023.

Development and validation of cancer-associated fibroblasts-related gene landscape in prognosis and immune microenvironment of bladder cancer

Affiliations

Development and validation of cancer-associated fibroblasts-related gene landscape in prognosis and immune microenvironment of bladder cancer

Meng Zhang et al. Front Oncol. .

Abstract

Backgrounds: Bladder cancer (BLCA) is one of the most prevalent cancers of the genitourinary system, the clinical outcomes of patients with BLCA are bad, and the morbidity rate is high. One of the key components of the tumor microenvironment (TME) is cancer-associated fibroblasts (CAFs) which are critically involved in BLCA tumorigenesis. Previous studies have shown the involvement of CAFs in tumor growth, cancer progression, immune evasion, angiogenesis, and chemoresistance in several cancers such as breast, colon, pancreatic, ovarian, and prostate cancers. However, only a few studies have shown the role of CAFs in the occurrence and development of BLCA.

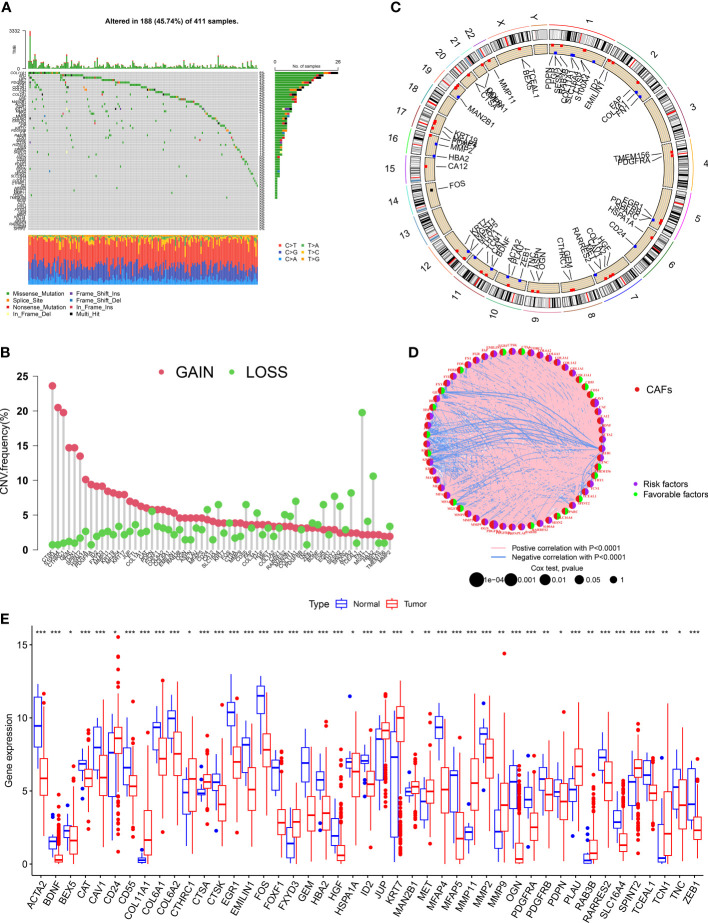
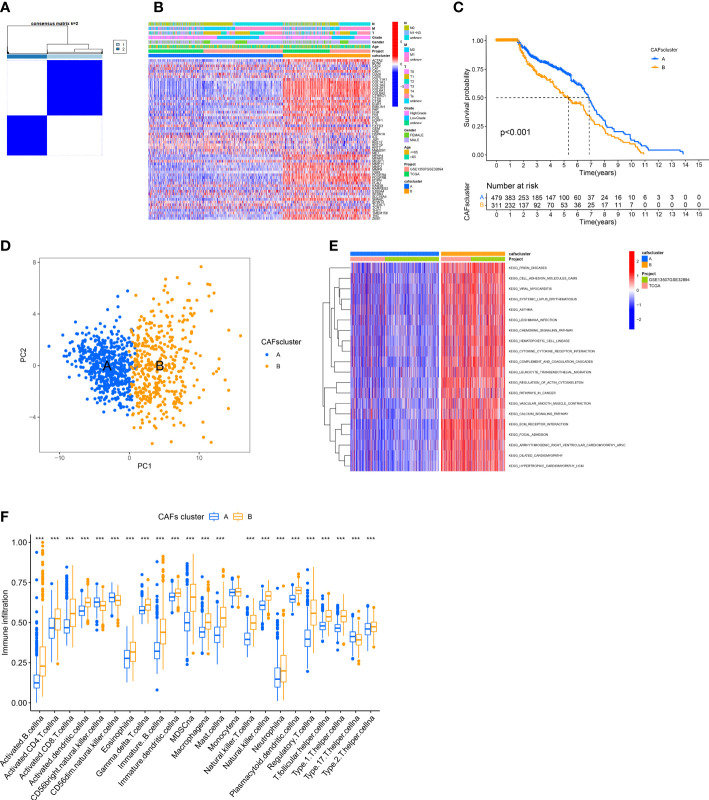
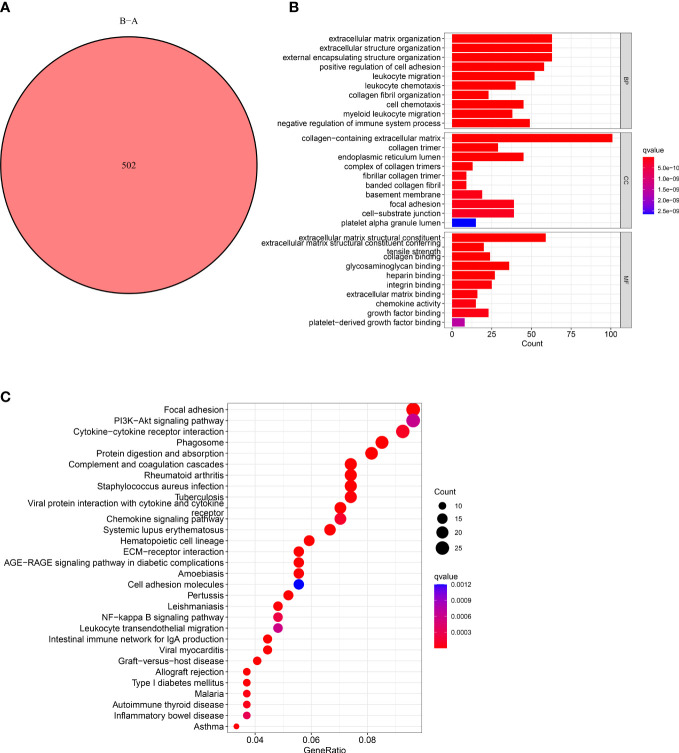
Methods: We have retrieved and merged the data on RNA-sequencing of patients with BLCA from databases including "the Cancer Genome Atlas" and "Gene Expression Omnibus." Next, we compared the differences in CAFs-related genes (CRGs) expression between normal and BLCA tissues. Based on CRGs expression, we randomly divided patients into two groups. Next, we determined the correlation between CAFs subtypes and differentially expressed CRGs (DECRGs) between the two subtypes. Furthermore, the "Gene Ontology" and "Kyoto Encyclopedia of Genes and Genomes pathway" enrichment analyses were conducted to determine the functional characteristics between the DECRGs and clinicopathology.

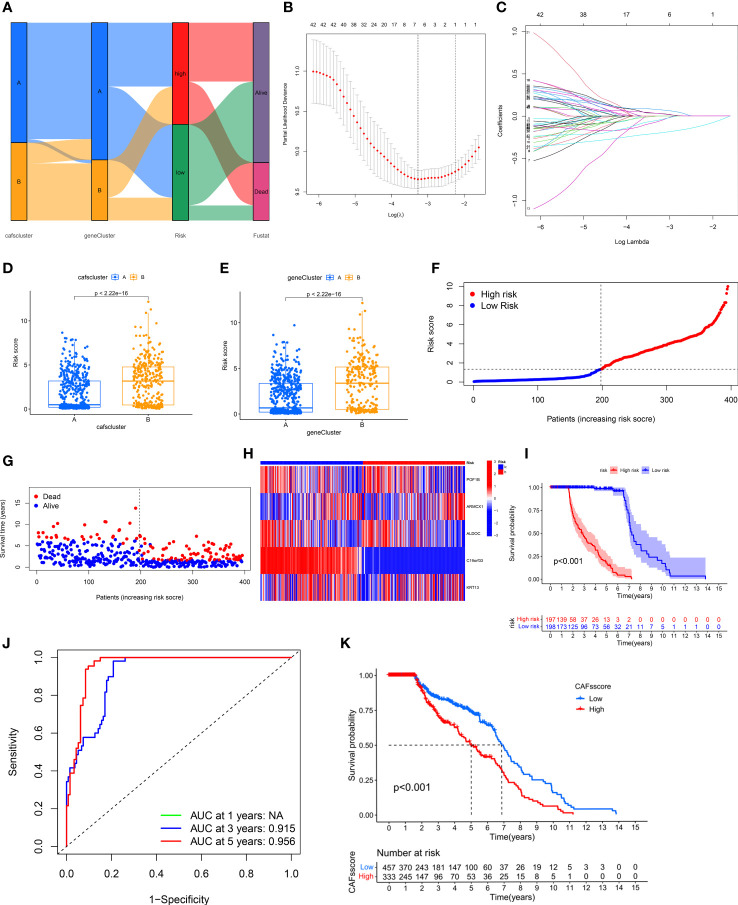
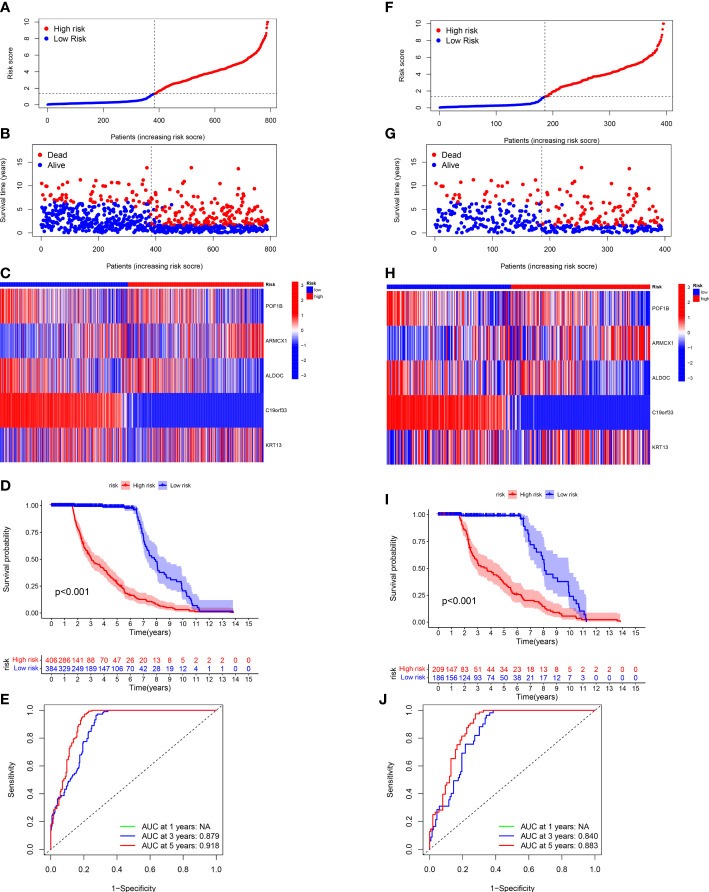
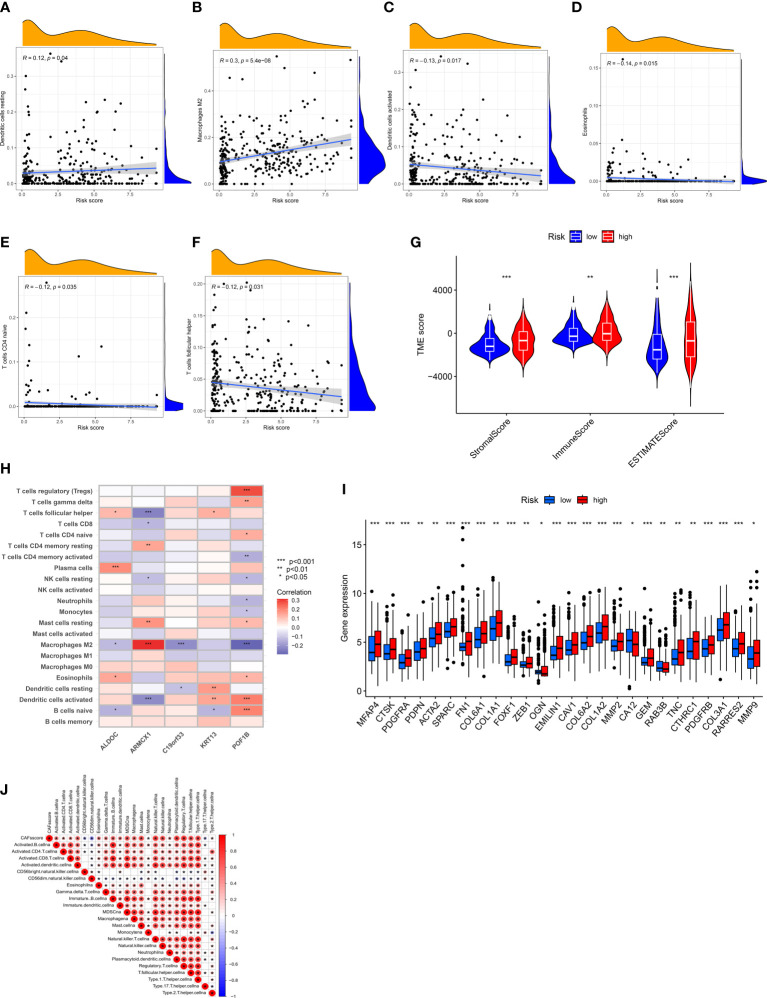
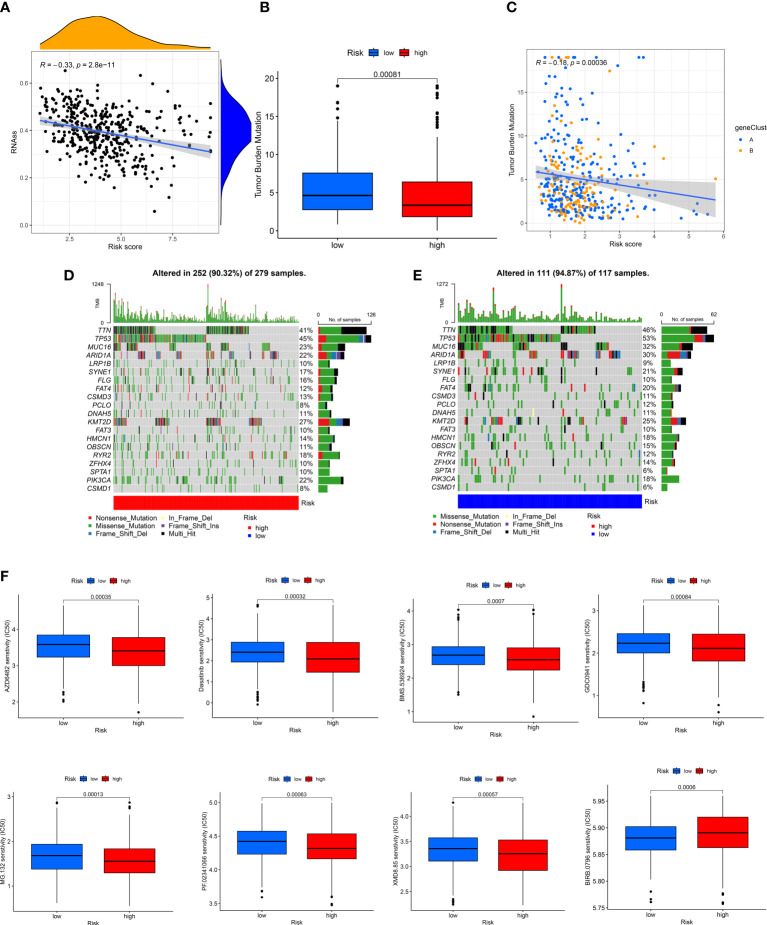
Results: We identified five genes (POF1B, ARMCX1, ALDOC, C19orf33, and KRT13) using multivariate COX regression and "Least Absolute Shrinkage and Selection Operator (LASSO) COX regression analysis" for developing a prognostic model and calculating the CRGs-risk score. The TME, mutation, CSC index, and drug sensitivity were also analyzed.

Conclusion: We constructed a novel five- CRGs prognostic model, which sheds light on the roles of CAFs in BLCA.

Keywords: bladder cancer; cancer-associated fibroblasts (CAF); immune microenvironment; prognosis; tumor microenvironment.


Conflict of interest statement

The authors declare that the research was conducted in the absence of any commercial or financial relationships that could be construed as a potential conflict of interest.

Figures

Figure 1
Figure 1
Landscape of genetic and transcriptional alterations of CAF-related genes in bladder cancer. (A) Somatic mutation in CRGs in patients from the TCGA- BLCA cohort. (B) The frequency of CNV in CRGs in patients with BLCA. (C)The chromosomal location of CNV in CRGs in TCGA-BLCA cohort. (D) The network diagram of CRGs in patients with BLCA. (E) The difference in the expression of 45 CRGs in tissues of normal and patients with BLCA. *P < 0.05, **P < 0.01, ***P < 0.001.
Figure 2
Figure 2
Identification of CAFs Subtypes and their Biological Characteristics in patients with BLCA. (A) The consensus clustering analysis was used to classify patients into two subtypes (k =2). (B) The heatmap shows the correlation between clinical characteristics and two subtypes. (C) KM survival curves were used for comparing the prognosis among patients in the two subtypes. (D) PCA of two clusters. (E) GSVA shows the pathways enriched in the two subtypes. (F) Infiltration of immune cells in the two subtypes. ***P < 0.001.
Figure 3
Figure 3
Characteristics of CAFs-Related DEGs. (A) Venn diagram shows pairwise DEGs in patients in the two subtypes. (B) The barplot graph shows the enrichment of GO analysis and CRGs. (C) The bubble graph shows the enrichment of KEGG pathways and CRGs.
Figure 4
Figure 4
Construction and Validation of CRG Prognostic Model. (A) Sankey diagram shows the distribution of two CAFs subtypes. (B, C) LASSO regression analysis was performed on CRGs. (D, E) Significant differences in gene clusters and CAF clusters in patients in both risk groups. (F, G) The risk score plots of the two risk groups in the training set. (H) The risk heatmap of the two risk groups in the training set. (I) KM survival curves of the OS of patients in both risk groups in the training set (P < 0.001). (J) The ROC curves of 3- and 5-year OS of patients in both risk score groups in the training set. (K) CRGs-risk score for predicting the OS of patients with BLCA.
Figure 5
Figure 5
Validating the CRG Prognostic Model in the Entire and Test Sets. The risk plots, Survival duration and profanity, Risk heatmap, and ROC curves of 3- and 5 years for the risk score in the entire (A-E) and testing (F-J) sets.
Figure 6
Figure 6
Assessment of TME of patients in Both Risk Groups. (A–F) A positive correlation between the CRGs-risk score and the resting DCs and M2 Macrophages. A negative correlation between the CRGs-risk score and the activated DCs, Eosinophils, naïve CD4 T cells, and Tfh cells. (G) Correlation between CRGs-risk score, immune, and stromal scores. (H) Correlation between five selected CRGs and the proportion of immune cells. (I) CRGs expression in patients in two risk groups. (J) Correlation between the CRGs-risk score and infiltrating immune cells. *P < 0.05, **P < 0.01, ***P < 0.001.
Figure 7
Figure 7
Evaluation of the correlation between CRGs-risk score and CSC, Mutation, and Drug sensitivity. (A) A positive correlation between the CSC index and CRGs-risk score. (B, C) The Boxplot and Spearman correlation shows that patients in LRH had a higher TME rate. (D, E) The somatic mutation in CRGs in patients in both groups. (F, G) The sensitivity of patients in both groups to chemotherapy drugs.
Figure 8
Figure 8
Determining the expression CRGs in tissues of normal bladder and BLCA by IHC images.

Similar articles

Cited by

References

    1. Barani M, Hosseinikhah SM, Rahdar A, Farhoudi L, Arshad R, Cucchiarini M, et al. . Nanotechnology in bladder cancer: diagnosis and treatment. Cancers (Basel) (2021) 13(9):2214. doi: 10.3390/cancers13092214 - DOI - PMC - PubMed
    1. Siegel RL, Miller KD, Jemal A. Cancer statistics, 2020. CA Cancer J Clin (2020) 70(1):7–30. doi: 10.3322/caac.21590 - DOI - PubMed
    1. Alifrangis C, McGovern U, Freeman A, Powles T, Linch M. Molecular and histopathology directed therapy for advanced bladder cancer. Nat Rev Urol (2019) 16(8):465–83. doi: 10.1038/s41585-019-0208-0 - DOI - PubMed
    1. Hedegaard J, Lamy P, Nordentoft I, Algaba F, Høyer S, Ulhøi BP, et al. . Comprehensive transcriptional analysis of early-stage urothelial carcinoma. Cancer Cell (2016) 30(1):27–42. doi: 10.1016/j.ccell.2016.05.004 - DOI - PubMed
    1. Wu Q, Wong JPC, Kwok HF. Putting the brakes on tumorigenesis with natural products of plant origin: insights into the molecular mechanisms of actions and immune targets for bladder cancer treatment. Cells (2020) 9(5):1213. doi: 10.3390/cells9051213 - DOI - PMC - PubMed