. 2023 Jun 15:17:1171115.
doi: 10.3389/fnins.2023.1171115. eCollection 2023.

Emergent structural and functional properties of hippocampal multi-cellular aggregates

Affiliations

Emergent structural and functional properties of hippocampal multi-cellular aggregates

Victor P Acero et al. Front Neurosci. .

Abstract

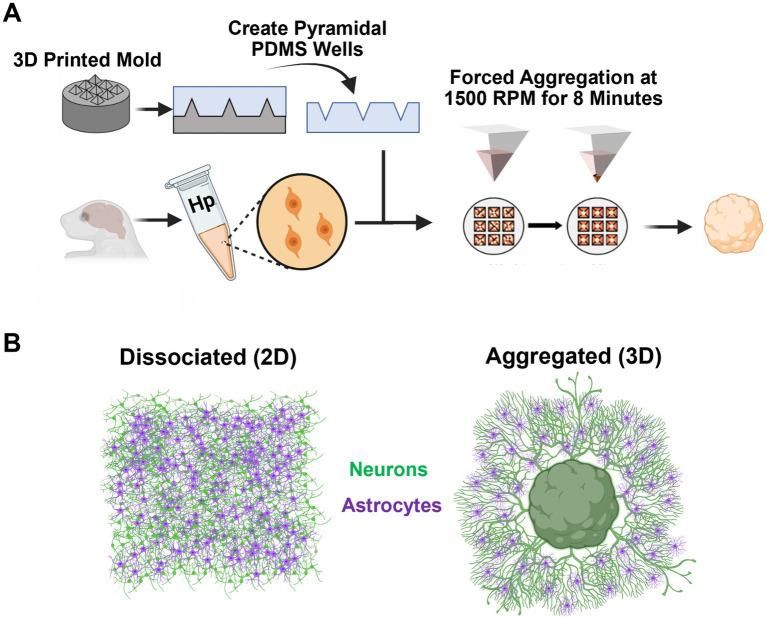
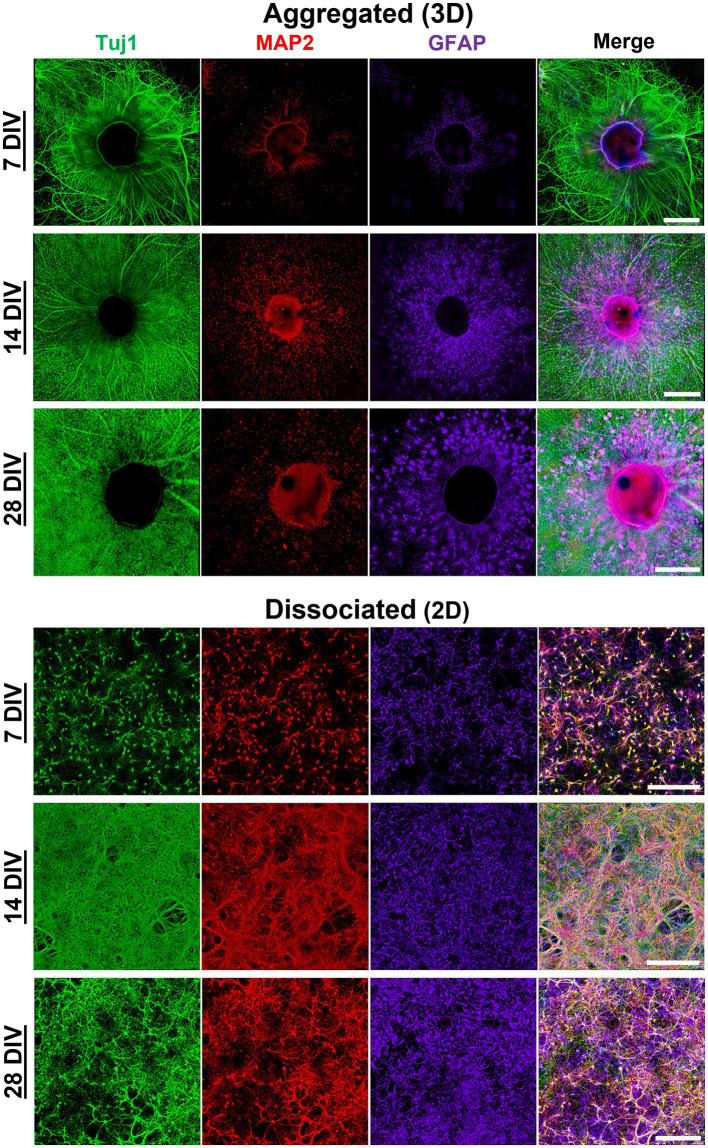
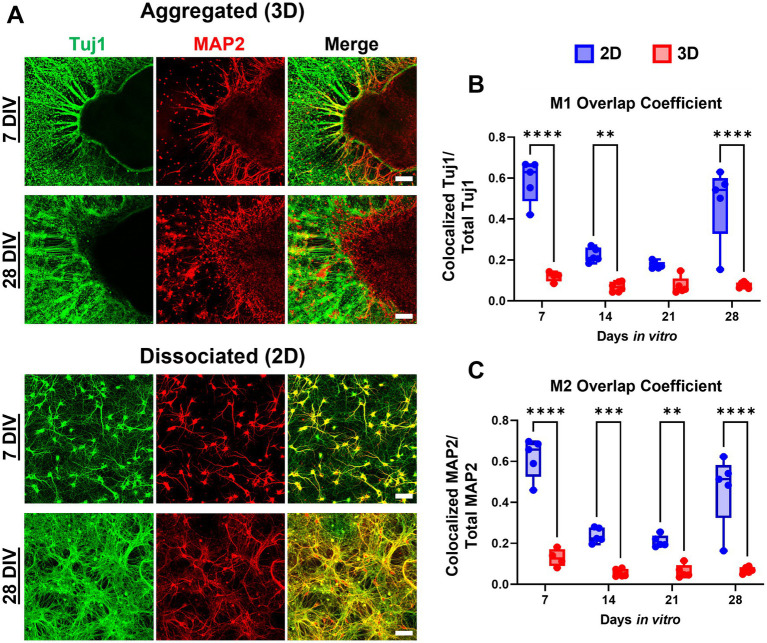
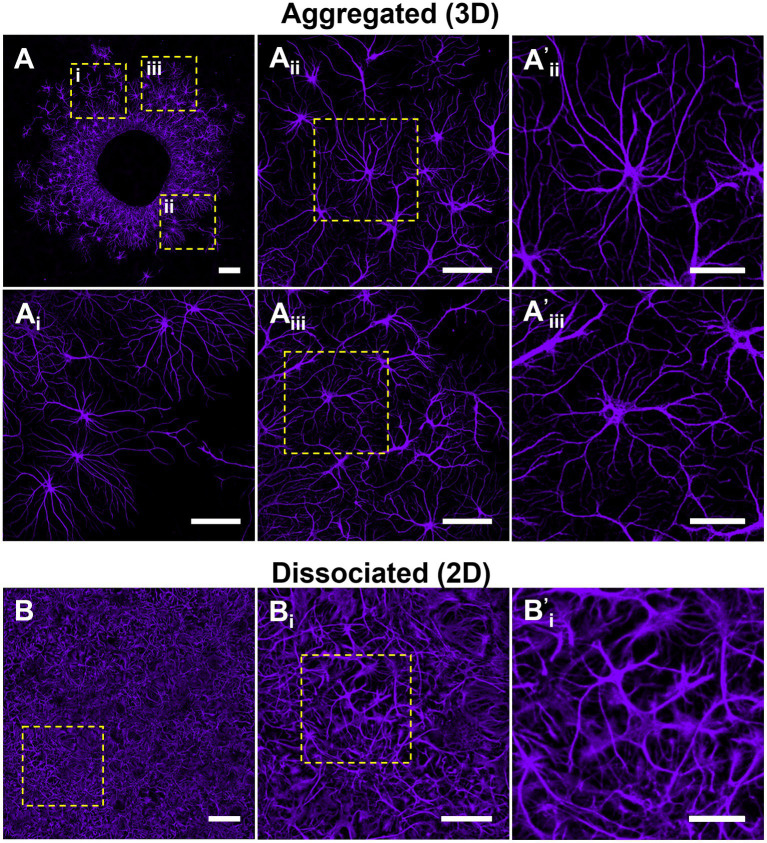
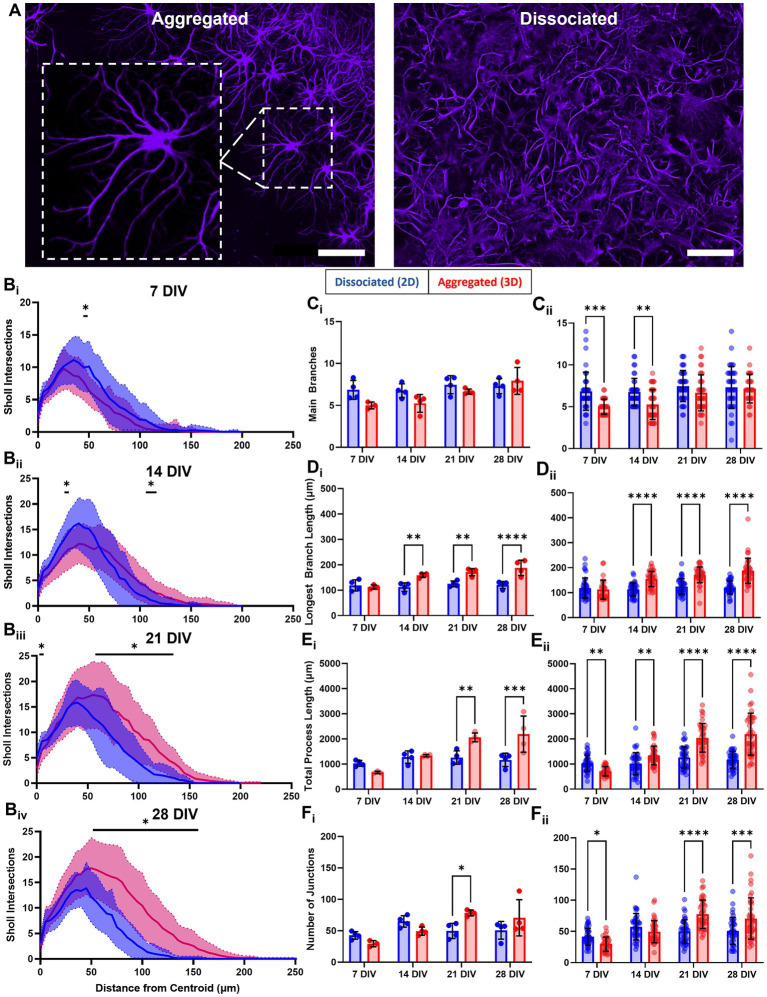
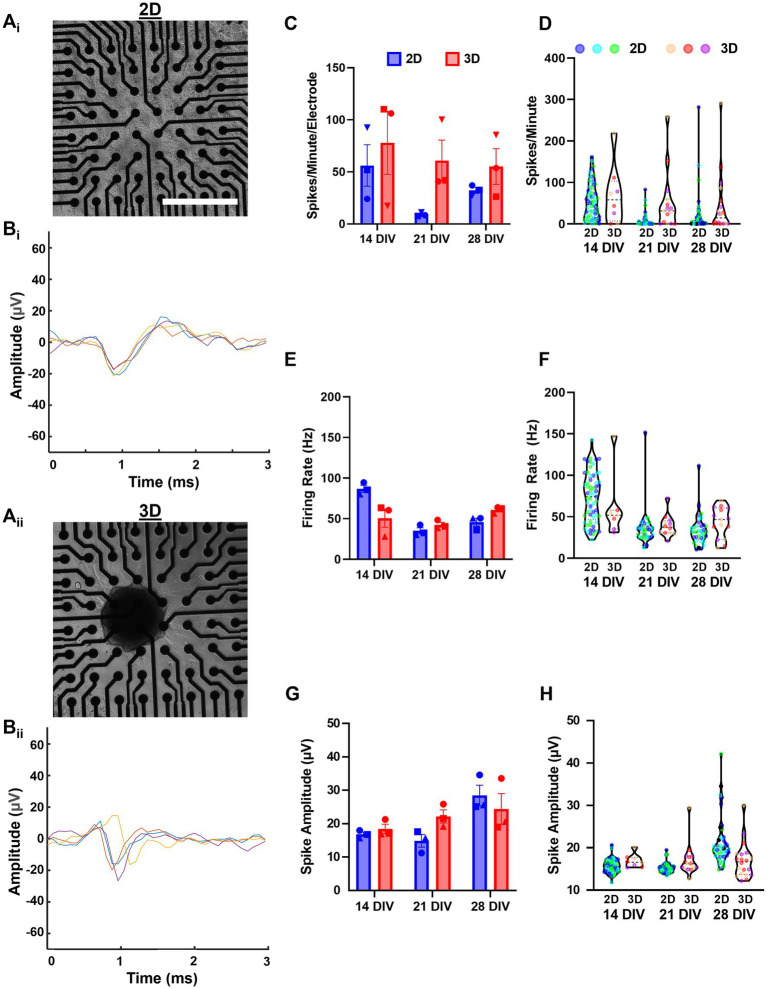
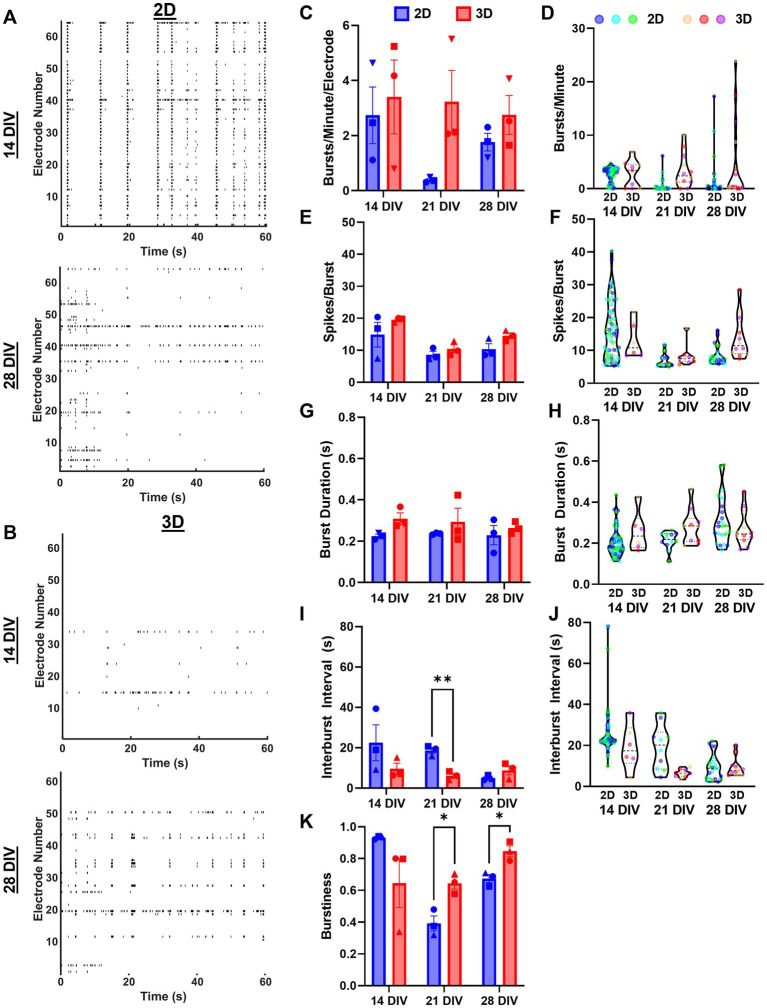
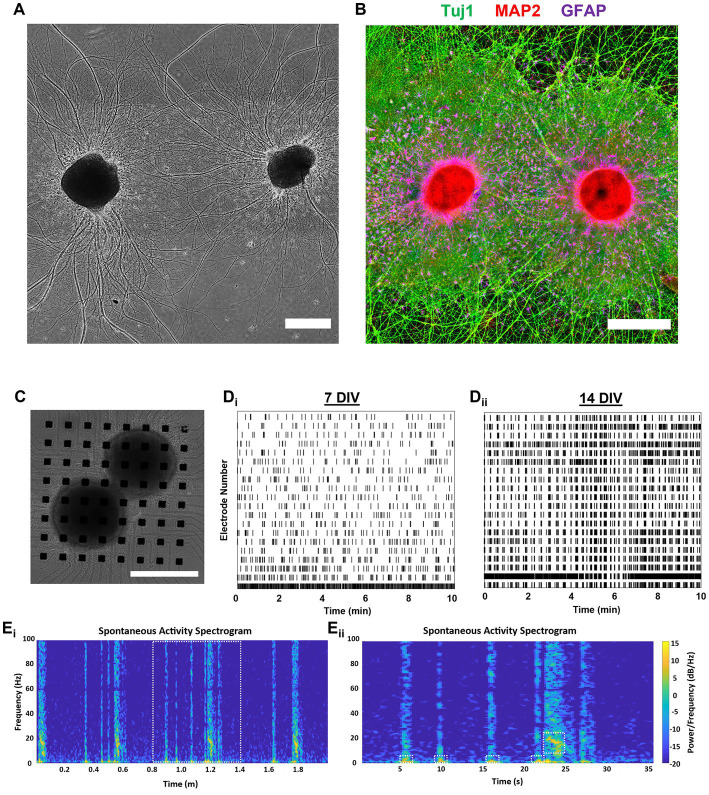
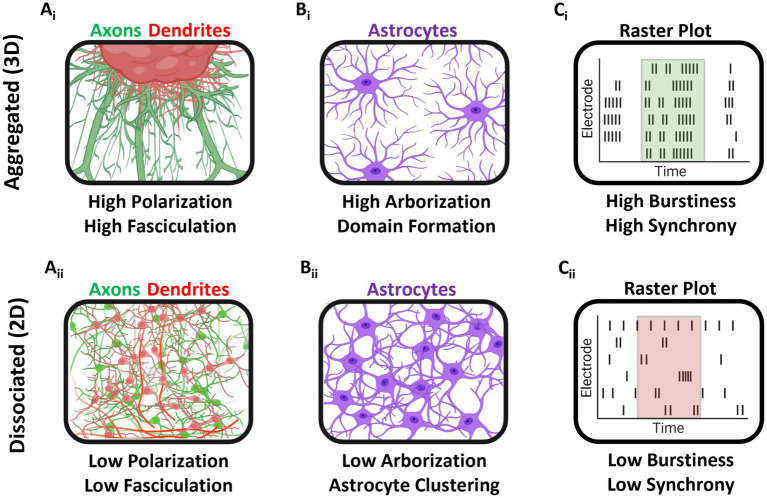
Hippocampal neural networks are distinctly capable of integrating multi-modal sensory inputs to drive memory formation. Neuroscientific investigations using simplified in vitro models have greatly relied on planar (2D) neuronal cultures made from dissociated tissue. While these models have served as simple, cost-effective, and high-throughput tools for examining various morphological and electrophysiological characteristics of hippocampal networks, 2D cultures fail to reconstitute critical elements of the brain microenvironment that may be necessary for the emergence of sophisticated integrative network properties. To address this, we utilized a forced aggregation technique to generate high-density (>100,000 cells/mm3) multi-cellular three-dimensional aggregates using rodent embryonic hippocampal tissue. We contrasted the emergent structural and functional properties of aggregated (3D) and dissociated (2D) cultures over 28 days in vitro (DIV). Hippocampal aggregates displayed robust axonal fasciculation across large distances and significant neuronal polarization, i.e., spatial segregation of dendrites and axons, at earlier time points compared to dissociated cultures. Moreover, we found that astrocytes in aggregate cultures self-organized into non-overlapping quasi-domains and developed highly stellate morphologies resembling astrocyte structures in vivo. We maintained cultures on multi-electrode arrays (MEAs) to assess spontaneous electrophysiological activity for up to 28 DIV. We found that 3D networks of aggregated cultures developed highly synchronized networks and with high burstiness by 28 DIV. We also demonstrated that dual-aggregate networks became active by 7 DIV, in contrast to single-aggregate networks which became active and developed synchronous bursting activity with repeating motifs by 14 DIV. Taken together, our findings demonstrate that the high-density, multi-cellular, 3D microenvironment of hippocampal aggregates supports the recapitulation of emergent biofidelic morphological and functional properties. Our findings suggest that neural aggregates may be used as segregated, modular building blocks for the development of complex, multi-nodal neural network topologies.

Keywords: 3D neuron cultures; In vitro hippocampal culture; astrocyte domains; in vitro electrophysiology; neural spheroid; neuronal polarization.


Conflict of interest statement

DC was a scientific co-founder of Innervace, Inc., and Axonova Medical, LLC, which are University of Pennsylvania spin-out companies focused in neuroregenerative medicine. The remaining authors declare that the research was conducted in the absence of any commercial or financial relationships that could be construed as a potential conflict of interest.

Figures

Figure 1
Figure 1
Experimental approach. (A) We utilized 3D printed molds to generate inverted pyramidal PDMS wells. Rat E18 dissociated neuronal suspension was transferred to the inverted pyramidal PDMS wells (50,000 cells/well), centrifuged at 1500 rpm for 8 min, and incubated overnight to allow the newly formed aggregate to stabilize. (B) This study examined the emergent morphological and functional differences between dissociated (2D) and aggregated (3D) hippocampal neuron-astrocyte cultures.
Figure 2
Figure 2
Morphological maturation of aggregated and dissociated hippocampal cultures. Morphological maturation of aggregated and dissociated hippocampal cultures, specifically axon (Tuj1), dendrites (MAP2), and astrocytes (GFAP) was visualized utilizing immunofluorescence confocal microscopy. Hippocampal aggregates demonstrate robust fasciculation of axonal projections which project 500–1000 μm from the edge of the aggregate as early as 7 DIV. Moreover, we found that MAP2+ dendrite growth was predominantly restricted to the most proximal (<50 μm) area relative to the aggregate body. Astrocytes were shown to survive in both culture conditions. In aggregated cultures, astrocytes appeared to demonstrate greater arborization relative to dissociated cultures. Astrocytes in aggregated culture appears to self-organize into domain-like structures, rather than clustering as was seen in dissociated cultures. Scale bar = 500 μm.
Figure 3
Figure 3
Scanning electron microscope (SEM) images of aggregated and dissociated hippocampal cultures. (A,B) SEM images of dissociated hippocampal cultures growing on planar surfaces. (C) SEM image of the aggregate body shows the high-density three-dimensional packing of neuronal somata and self-generated extracellular matrix that likely supports aggregate cohesion. (D) Processes protrude from the aggregate body onto the planar cell culture surface. (E) Thick bundles of axons emerge due to the fasciculation of numerous individual neurite processes. (F) Axon fascicles also spontaneously defasciculate and merge with the surround bed of neurites on the planar surface. (A,B) Scale bar = 100 μm; (C,D) scale bar = 250 μm; Ei to E, Eii to Ei and Eiii to Eii; (F) scale bar = 100 μm; (Fi) scale bar = 30 um.
Figure 4
Figure 4
Aggregated neurons demonstrate reduced MAP2:Tuj1 colocalization, indicating increased polarity. (A) We assessed both the spatial overlap and co-labeling of neurites with Tuj1/MAP2 in aggregated versus dissociated cultures. (B,C) We quantified neuronal polarization between culture conditions across time utilizing the Mander’s Overlap Coefficients (MOC) M1 and M2 as measures of Tuj1 and MAP2 co-localization. Across timepoints there was significantly greater Tuj1-MAP2 colocalization in dissociated (2D) cultures relative to aggregated (3D) cultures, however the difference between culture conditions was most pronounced at earlier (7 and 14 DIV) time points. For M1: 7 DIV, p < 0.0001; 14 DIV, p = 0.0049; 28 DIV, p < 0.0001. For M2: 7 DIV, p < 0.0001; 14 DIV, p = 0.0006; 21 DIV, p = 0.0037; 28 DIV, p < 0.0001. Scale bar = 100 μm. The significance levels were denoted as follows: ** for p < 0.01, *** for p < 0.001, and **** for p < 0.0001.
Figure 5
Figure 5
Astrocytes in aggregated cultures self-organize into non-overlapping domains. We qualitatively assessed astrocyte distribution and putative domain formation within aggregated versus dissociated cultures. Astrocytes in aggregated cultures were observed to organize into individual domains spatially-distanced from neighboring astrocytes. (A) Astrocytes demonstrated more apparent boundary formation as a function of distance from the aggregate. (B) In contrast, astrocytes in dissociated 2D cultures did not display a segregated spatial organization nor the formation of distinct borders between cells. (A,B) Scale bar = 200 μm; (Ai–iii), (Bi) scale bar = 100 μm; (A’i,ii,Bi) scale bar = 50 μm.
Figure 6
Figure 6
Astrocytes develop more arborized, stellate morphologies in aggregate cultures. (A) Following our observations that astrocytes in aggregated and dissociated cultures developed qualitatively distinct morphologies. (B) We adapted the Sholl analysis of neuronal arborization to the quantification of astrocytic arborization in each culture, revealing significant differences in astrocyte arborization in 2D versus 3D at specific distance ranges (7 DIV, 55–60 μm; 14 DIV, 45 and 120–130 μm; 21 DIV, 5 and 90–155 μm; 28 DIV, 60–170 μm). (Ci) Average number of main, or primary, branches per astrocyte in dissociated and aggregated cultures. (Cii) Number of main branches for each individual astrocyte (7 DIV, p = 0.0004; 14 DIV, p = 0.0019). (Di) Average length of longest branch (14 DIV, p = 0.03; 21 DIV, p = 0.03; 28 DIV, p < 0.0001). (Dii) Length of the longest main branch for each individual astrocyte (14, 21, and 28 DIV, p < 0.0001). (Ei) Mean total process length per astrocyte (21 DIV, p = 0.0047; 28 DIV, p = 0.0005). (Eii) Total process length for each individual astrocyte (7 DIV, p = 0.007; 14 DIV, p = 0.0052; 21 and 28 DIV, p < 0.0001). (Fi) Mean number of junctions, or branch points, per astrocyte (21 DIV, p = 0.0008). (Fii) Number of junctions for each individual astrocyte (7 DIV, p = 0.0423; 21 DIV, p < 0.0001; 28 DIV, p = 0.0001). Scale bar = 100 μm. The significance levels were denoted as follows: * for p < 0.05, ** for p < 0.01, *** for p < 0.001, and **** for p < 0.0001.
Figure 7
Figure 7
Assessment of spontaneous spiking activity shows hippocampal aggregates develop active networks. (Ai) Aggregated and (Aii) dissociated cultures were imaged at 7 DIV before the start of experiments. (Bi,ii) Representative plots of four consecutive spike waveforms from 2D and 3D networks demonstrating that our spike detection algorithm is effectively isolating individual spikes. (C) Spikes per minute per electrode across cultures and (D) spikes per minute values for individual electrodes from each culture. (E) Mean firing rate (Hz) across cultures and (F) mean firing rate (Hz) for individual electrodes from each culture. (G) Finally, mean spike amplitude across cultures and (H) mean spike amplitude for individual electrodes from each culture. Scale bar = 500 μm.
Figure 8
Figure 8
Assessment of spontaneous bursting activity reveals distinct bursting characteristics between 2D and 3D networks. (A,B) Raster plots of representative samples of network activity at 14 and 28 DIV for dissociated and aggregated cultures. (C) Bursts per minute per electrode across cultures and (D) bursts per minute values for individual electrodes from each culture. (E) Spikes per burst across cultures and (F) spikes per burst for individual electrodes from each culture. (G) Burst duration across cultures and (H) burst duration for individual electrodes from each culture. (I) Interburst interval across cultures (21 DIV, p = 0.0088) and (J) interburst interval for individual electrodes from each culture. (K) Finally, the burstiness per culture, i.e., proportion of total spiking activity occurring within a burst (21 DIV, p = 0.0430; 28 DIV, p = 0.0430). The significance levels were denoted as follows: * for p < 0.05, ** for p < 0.01.
Figure 9
Figure 9
Assessment of dual-aggregate network activity shows rapid maturation and relevant electrophysiological properties. (A,B) Dual-aggregate cultures support long-distance axonal fasciculation, neuronal polarization, and quasi-domain formation by astrocytes, and were not morphologically differentiable from single aggregate cultures. (A) Representative phase image of a dual-aggregate system at 14 DIV. (B) We used immunocytochemistry to visualize the axonal processes, somatodendritic compartments, and astrocytes domains of a representative dual-aggregate culture at 21 DIV. (C) Representative culture featuring two aggregates on (generally) separate corners of a 64-electrode MEA for 14 DIV. Raster plots of a continuous 10-min recording from a representative dual-aggregate network demonstrating that dual-aggregate systems develop more synchronized bursting activity as they mature from (Di) 7 DIV to (Dii) 14 DIV. (Ei) To visualize the oscillatory dynamics of the dual-aggregate system we generated a spectrogram (0–100 Hz) of a 2 min recording. (Eii) Zoom-in of a representative super-burst composed of preceding short duration bursts with low frequency bursting (2–10 Hz) activity followed by a longer duration burst dominated by higher frequency bursting (10–20 Hz); various bursting regimes denoted by dashed line boxes. (A–C) Scale bar = 500  m.
Figure 10
Figure 10
Graphical summary of findings. (Ai) Aggregated cultures developed large axonal fascicles and demonstrated neuronal polarization (distinct dendrite and axonal spatial localization). (Aii) In dissociated cultures, axonal fasciculation and neuronal polarization were greatly attenuated. (Bi) Astrocytes in aggregate cultures self-organized into domain-like topologies and demonstrated robust arborization relative to dissociated cultures. (Bii) Dissociated culture astrocytes showed high spatial clustering and low arborization. (Ci,ii) Finally, aggregated cultures grown on MEAs had greater burstiness, i.e., proportion of total spiking activity occurring within a burst, at 28 DIV, as compared to dissociated cultures.

Similar articles

References

    1. Adewole D. O., Struzyna L. A., Burrell J. C., Harris J. P., Nemes A. D., Petrov D., et al. . (2021). Development of optically controlled ‘living electrodes’ with long-projecting axon tracts for a synaptic brain-machine interface. Sci. Adv. 7:eaay5347. doi: 10.1126/sciadv.aay5347 - DOI - PubMed
    1. Balasubramanian S., Packard J. A., Leach J. B., Powell E. M. (2016). Three-dimensional environment sustains morphological heterogeneity and promotes phenotypic progression during astrocyte development. Tissue Eng 22, 885–898. doi: 10.1089/ten.tea.2016.0103, PMID: - DOI - PMC - PubMed
    1. Barry J., Gu Y., Gu C. (2010). Polarized targeting of L1-CAM regulates axonal and dendritic bundling in vitro. Eur. J. Neurosci. 32, 1618–1631. doi: 10.1111/j.1460-9568.2010.07447.x, PMID: - DOI - PMC - PubMed
    1. Braet F., de Zanger R., Wisse E. (1997). Drying cells for SEM, AFM and TEM by hexamethyldisilazane: a study on hepatic endothelial cells. J. Microsc. 186, 84–87. doi: 10.1046/j.1365-2818.1997.1940755.x - DOI - PubMed
    1. Butler J. L., Paulsen O. (2015). Hippocampal network oscillations – recent insights from in vitro experiments. Curr. Opin. Neurobiol. 31, 40–44. doi: 10.1016/j.conb.2014.07.025, PMID: - DOI - PubMed

LinkOut - more resources