. 2022 Jun 21;10(4):1564-1581.
doi: 10.1016/j.gendis.2022.05.036. eCollection 2023 Jul.

PLSCR1 promotes apoptosis and clearance of retinal ganglion cells in glaucoma pathogenesis

Affiliations

PLSCR1 promotes apoptosis and clearance of retinal ganglion cells in glaucoma pathogenesis

Jingyi Luo et al. Genes Dis. .

Abstract

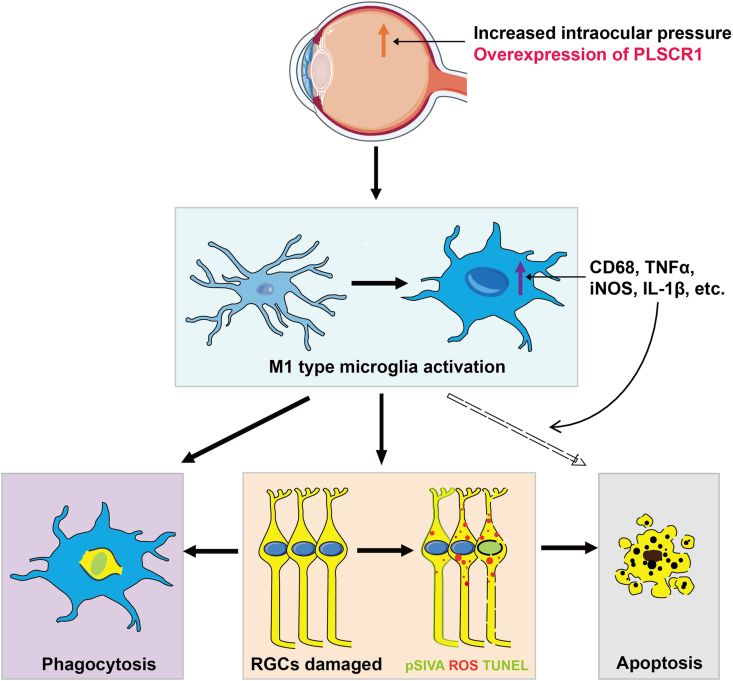
Glaucoma is the leading cause of irreversible blindness worldwide. In the pathogenesis of glaucoma, activated microglia can lead to retinal ganglion cells (RGCs) apoptosis and death, however, the molecular mechanisms remain largely unknown. We demonstrate that phospholipid scramblase 1 (PLSCR1) is a key regulator promoting RGCs apoptosis and their clearance by microglia. As evidenced in retinal progenitor cells and RGCs of the acute ocular hypertension (AOH) mouse model, overexpressed PLSCR1 induced its translocation from the nucleus to the cytoplasm and cytomembrane, as well as elevated phosphatidylserine exposure and reactive oxygen species generation with subsequent RGCs apoptosis and death. These damages were effectively attenuated by PLSCR1 inhibition. In the AOH model, PLSCR1 led to an increase in M1 type microglia activation and retinal neuroinflammation. Upregulation of PLSCR1 resulted in strongly elevated phagocytosis of apoptotic RGCs by activated microglia. Taken together, our study provides important insights linking activated microglia to RGCs death in the glaucoma pathogenesis and other RGC-related neurodegenerative diseases.

Keywords: Apoptosis; Glaucoma; PLSCR1; Phagocytosis; Retinal ganglion cells.


Figures

Fig. 1
Figure 1
Overexpressed PLSCR1 leads to its translocation in RPCs. (A) Western blot shows the protein expression of PLSCR1 in RPCs without pAd treatment (Blank), and RPCs treated with pAd-NC and pAd-PLSCR1. (B) Statistic analysis of the relative protein expression of PLSCR1 normalized to β-Tubulin in RPCs demonstrates the expression increases in pAd-NC and pAd-PLSCR1 groups. Two-tailed Student's t-test (n = 3 for each experiment). ∗P < 0.05, ∗∗∗P < 0.001. Data are mean ± SD. (C) Immunofluorescence shows that PLSCR1 locates in the nucleus, cytoplasm, and cytomembrane in RPCs without pAd treatment and RPCs infected with pAd-NC, while it is translocated from the nucleus to the cytoplasm and cytomembrane with enhanced immunofluorescence in RPCs infected with pAd-PLSCR1. Scale bars, 20 μm.
Fig. 2
Figure 2
Overexpressed PLSCR1 promotes phosphatidylserine (PS) exposure, cell apoptosis, and reactive oxygen species (ROS) generation in RPCs. (A) Live-cell imaging using the polarity sensitive indicator of viability and apoptosis (pSIVA) and propidium iodide (PI) shows the PS exposure and cell death increases in RPCs treated with pAd-NC and pAd-PLSCR1. Scale bars, 100 μm. (B) Apoptosis of RPCs (Blank), and RPCs treated with pAd-NC or pAd-PLSCR1 were evaluated by Annexin V-FITC and PI by flow cytometry. (C) Quantification analysis of the early and late apoptotic rate in RPCs (Blank), and RPCs treated with pAd-NC or pAd-PLSCR1. (D) The production of ROS using 2′,7′-dichlorodihydrofluorescein diacetate (DCFH-DA) is detected by flow cytometry. (E) Statistic analysis of the mean intensity of DCFH-DA fluorescence value in different groups shows PLSCR1 significantly increased the ROS generation in RPCs. (A, B, D) RPCs are infected with pAd-NC and pAd-PLSCR1 for 48 h. (C, E) Statistic analysis shows two-tailed Student's t-test (n = 3 for each experiment). P < 0.05, ∗∗P < 0.01. Data are mean ± SD.
Fig. 3
Figure 3
Upregulated PLSCR1 contributes to its translocation in the retina and optic nerve of TG-PLSCR1 mice. (A) Western blot results show the PLSCR1 protein expression elevates in the retina of TG-PLSCR1 mice compared with WT. (B) Statistic analysis of PLSCR1 normalized expression level. Two-tailed Student's t-test (n = 3 for each experiment). ∗∗∗P < 0.001. Data are mean ± SD. (C) Immunofluorescence images of PLSCR1 in the retina and optic nerve of WT and TG-PLSCR1 showed different expression and localization. Scale bars, 50 μm. GCL, ganglion cell layer; INL, inner nuclear layer; ONL, outer nuclear layer; ON, optic nerve.
Fig. 4
Figure 4
Overexpression of PLSCR1 aggravates RGCs damage and death after AOH. (A) H&E staining shows the thickness of the retina in different groups. Scale bars, 20 μm. (B) Statistic analysis shows the thickness of different layers of the retina significantly decrease in AOH-treated TG-PLSCR1 mice. (C) Indicative map demonstrates that three images (central, middle, and peripheral) were captured in every quadrant of the whole mount retina. A total of 12 fields were assessed for each retina. (D) Immunofluorescence images show that the number of RBPMS labeled RGCs (red) decreased in the AOH-treated mice (5 days). The change is more pronounced in TG-PLSCR1 mice. The upper row shows the density distribution of RGCs in the whole mount retina (Scale bars, 1 mm). The lower row exhibits the magnified micrographs from the middle region in the superior quadrant of the corresponding retinas (white box) (Scale bars, 50 μm). (E) Statistic analysis shows the average survival RGCs numbers from 12 fields per retina. (F) Toluidine blue staining images of optic nerve transverse section demonstrate axon damage in the AOH-treated mice, manifesting reduced axon density, myelin disruption, and fields with gliosis (Scale bars, 5 μm). (G) Statistic analysis of axon damage grade shows TG-PLSCR1 mice have much severer axon damage than WT mice. (B, E, G) Two-tailed Student's t-test (B and G: n = 4; E: n = 5 for each experiment). P < 0.05, ∗∗P < 0.01, ∗∗∗P < 0.001, and NS indicates difference not significant. Data are mean ± SD. RNFL, retinal nerve fiber layer; IPL, inner plexiform layer; INL, inner nuclear layer; OPL, outer plexiform layer; ONL, outer nuclear layer. S, superior; I, inferior; N, nasal; T, temporal.
Fig. 5
Figure 5
Elevated PLSCR1 facilitates PS exposure, cell apoptosis, and higher ROS production after AOH treatment. (AC) Immunofluorescence images of annexin-based fluorescent indicator polarity sensitive indicator of viability and apoptosis (pSIVA) in the ganglion cell layer (A), dihydroethidium (DHE) (B), and TUNEL staining (C) shows that PS exposure, ROS level, and retinal cell apoptosis markedly increased in TG-PLSCR1 retinas after AOH. Scale bars, 50 μm. (DF) Statistic analysis of pSIVA immunopositivity (D), ROS level (E), and TUNEL staining cell number (F) shows two-tailed Student's t-test (n = 3 for each experiment). P < 0.05, ∗∗P < 0.01, ∗∗∗P < 0.001, and NS indicates difference not significant. Data are mean ± SD.
Fig. 6
Figure 6
Overexpressed PLSCR1 promotes activated microglia with increased phagocytosis, M1 polarization, and pro-inflammatory cytokines secretion. (A) Immunofluorescence images of retinal flat mounts show microglia infiltrating the ganglion cell layer (GCL) with ameboid morphology and upregulation of the phagocytic molecule marker CD68 (green) on the third day after AOH. The immunostaining of CD68 (green) is co-localized within IBA1 labeled microglia (red). Scale bar, 50 μm. (B) Statistic analysis shows the number of IBA1 labeled microglia increases after treatment and more activated microglia in the GCL of TG-PLSCR1 mice compared with WT mice. (C) Statistic analysis shows that the immunopositivity of CD68 is significantly enhanced, demonstrating that microglial activation is much more pronounced in the TG-PLSCR1 mice. (D, E) The mRNA of WT and TG-PLSCR1 mice with AOH treatment are isolated from the mouse retinas. qPCR data show higher mRNA levels of M1 type microglia markers (TNF-α, iNOS, CD86, CCL2, CXCL10, IL-1β, and IL-6) in TG-PLSCR1 mice compared with WT mice; whereas the mRNA level of M2 type microglia markers (IL-10, YM-1, TGF-β, CD206, and Fizz-1) shows no significant difference between groups. (F) RNA-seq analysis identifies significant upregulated microglia-mediated inflammation gene transcripts suggesting a higher level of microglial activation and microglial inflammatory response in TG-PLSCR1 retinas compared with controls. (G) qPCR analysis verifies the genes expression in RNA-seq data. (B–E, G) Two-tailed Student's t-test (B and C: n = 4; D, E, and G: n = 6 for each experiment). P < 0.05, ∗∗P < 0.01, ∗∗∗P < 0.001 and NS indicates difference not significant. Data are mean ± SD.
Fig. 7
Figure 7
PLSCR1 facilitates clearance of apoptotic RGCs by microglia phagocytosis after AOH. (A) Retinal flat mounts from TG-PLSCR1 mice three days after AOH shows more activated microglia and more apoptotic RGCs than WT AOH-treated mice. Microglia labeled with IBA1 (purple), apoptotic cells labeled with TUNEL (green), and RGCs labeled with RBPMS (red). Arrowhead indicates the apoptotic RGCs phagocytosed by microglia. Scale bar, 20 μm. (B, C) Three-dimensional images reconstruction of the indicated area (white box in A) confirm the apoptotic RGCs inside the soma of microglia. Scale bar, 2 μm. (D) Statistic analysis for TUNEL labeled RGCs with or without microglial phagocytosis in WT and TG-PLSCR1 mice. Two-tailed Student's t-test (n = 3 for each experiment). ∗∗∗P < 0.001. Data are mean ± SD.
Fig. 8
Figure 8
Schematic illustrating the activated retinal microglia contribute to RGCs death by phagocytosis and secreting pro-inflammatory cytokines in AOH, and overexpression of PLSCR1 exacerbates this pathological process. In the AOH retina, RGCs become damaged (orange box) marked by exposed phosphatidylserine (PS), TUNEL, and reactive oxygen species (ROS) staining, which induce microglia recruitment. Ramified microglia infiltrate the ganglion cell layer (GCL) three days after AOH, showing ameboid morphology, upregulated phagocytic molecules (CD68), M1 phenotype activation markers (e.g., CD86 and CXCL10), and pro-inflammatory cytokines (e.g., TNF-α and iNOS). The activated microglia, on the one hand, phagocytose a subset of TUNEL labeled RGCs (purple box); on the other hand, additionally influence and potentiate the apoptotic route for RGCs death via pro-inflammatory cytokines secretion, such as TNF-α and IL-1β (grey box). Overexpression of PLSCR1 in the AOH-treated eye increases the PS exposure, apoptosis, and ROS generation of RGCs, and therefore intensifies microglia activation in phagocytosis and pro-inflammatory cytokine production, which aggravates RGCs clearance and death.

References

    1. Davis B.M., Crawley L., Pahlitzsch M., Javaid F., Cordeiro M.F. Glaucoma: the retina and beyond. Acta Neuropathol. 2016;132(6):807–826. - PMC - PubMed
    1. Quigley H.A. Glaucoma. Lancet. 2011;377(9774):1367–1377. - PubMed
    1. Skowronska-Krawczyk D., Zhao L., Zhu J., et al. P16INK4a upregulation mediated by SIX6 defines retinal ganglion cell pathogenesis in glaucoma. Mol Cell. 2015;59(6):931–940. - PMC - PubMed
    1. Silverman S.M., Wong W.T. Microglia in the retina: roles in development, maturity, and disease. Annu Rev Vis Sci. 2018;4:45–77. - PubMed
    1. Baudouin C., Kolko M., Melik-Parsadaniantz S., Messmer E.M. Inflammation in Glaucoma: from the back to the front of the eye, and beyond. Prog Retin Eye Res. 2021;83 - PubMed

LinkOut - more resources