Review
. 2023 Mar 24:4:100083.
doi: 10.1016/j.crneur.2023.100083. eCollection 2023.

Are musical activities associated with enhanced speech perception in noise in adults? A systematic review and meta-analysis

Affiliations
Review

Are musical activities associated with enhanced speech perception in noise in adults? A systematic review and meta-analysis

Elisabeth Maillard et al. Curr Res Neurobiol. .

Abstract

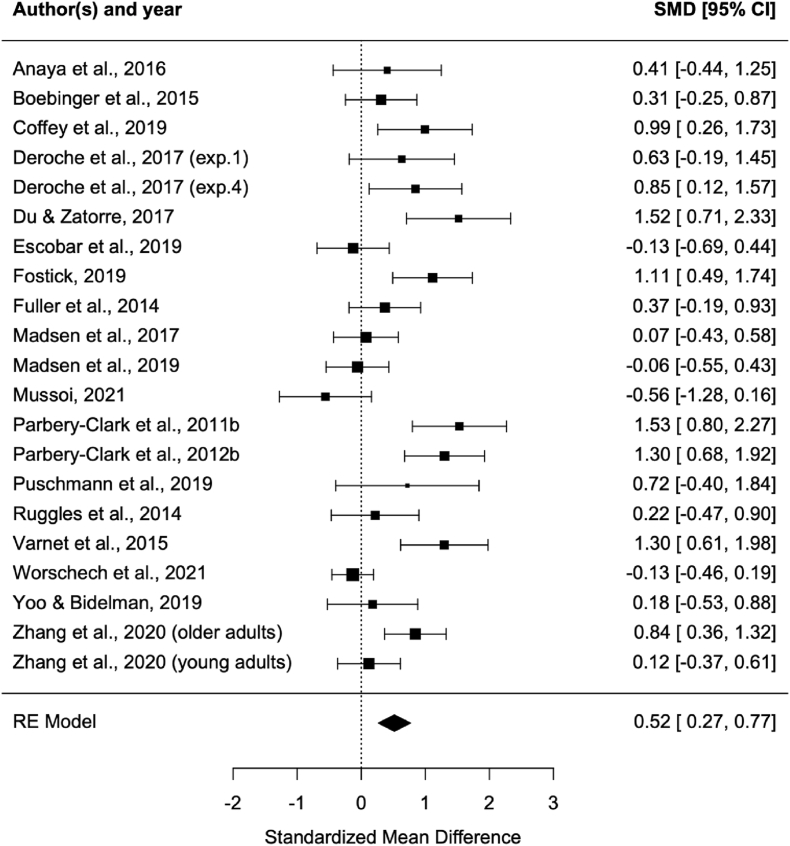
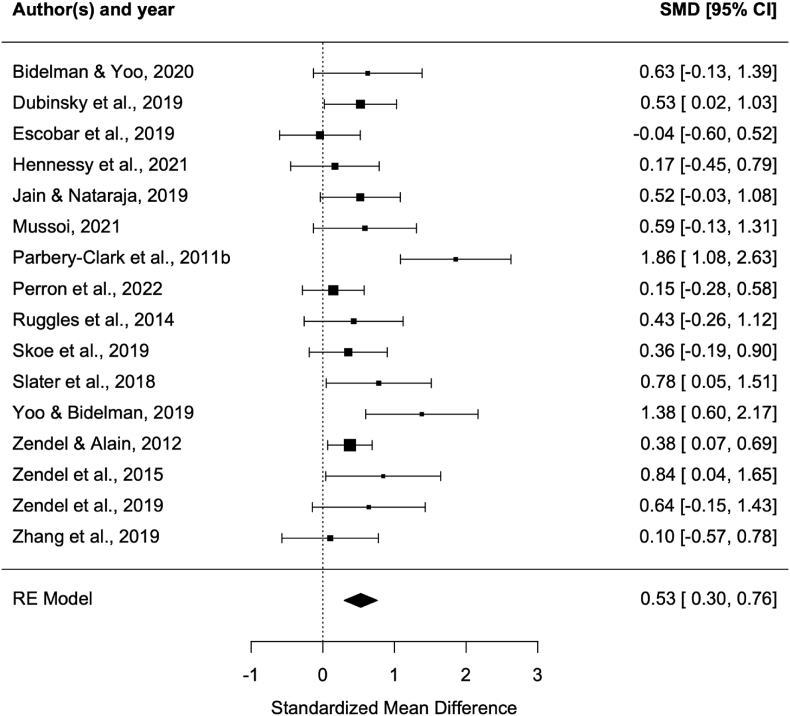
The ability to process speech in noise (SPiN) declines with age, with a detrimental impact on life quality. Music-making activities such as singing and playing a musical instrument have raised interest as potential prevention strategies for SPiN perception decline because of their positive impact on several brain system, especially the auditory system, which is critical for SPiN. However, the literature on the effect of musicianship on SPiN performance has yielded mixed results. By critically assessing the existing literature with a systematic review and a meta-analysis, we aim to provide a comprehensive portrait of the relationship between music-making activities and SPiN in different experimental conditions. 38/49 articles, most focusing on young adults, were included in the quantitative analysis. The results show a positive relationship between music-making activities and SPiN, with the strongest effects found in the most challenging listening conditions, and little to no effect in less challenging situations. This pattern of results supports the notion of a relative advantage for musicians on SPiN performance and clarify the scope of this effect. However, further studies, especially with older adults, using adequate randomization methods, are needed to extend the present conclusions and assess the potential for musical activities to be used to mitigate SPiN decline in seniors.

Keywords: Auditory masking; Cocktail party listening; Experience-dependent plasticity; Learning transfer; Musician; Speech processing; Speech-in-noise.


Conflict of interest statement

Pascale Tremblay reports financial support was provided in the form of a research grant by the 10.13039/501100000038Natural Sciences and Engineering Research Council of Canada.

Figures

Image 1
Graphical abstract
Fig. 1
Fig. 1
PRISMA figure.
Fig. 2
Fig. 2
Effect sizes for the speech in noise masker condition. Each box represents the effect estimate of an individual study and its size is proportional to that study's weight on the pooled result. The horizontal lines through the boxes represent the 95% confidence interval. The diamond represents the pooled result from the random effect meta-analysis. RE Model = Random effect model, SMD = Standardized mean difference (Hedge's G), 95% CI = 95% confidence interval.
Fig. 3
Fig. 3
Effect sizes for the speech in one-talker masker condition. Each box represents the effect estimate of an individual study and its size is proportional to that study's weight on the pooled result. The horizontal lines through the boxes represent the 95% confidence interval. The diamond represents the pooled result from the random effect meta-analysis. RE Model = Random effect model, SMD = Standardized mean difference (Hedge's G), 95% CI = 95% confidence interval.
Fig. 4
Fig. 4
Effect sizes for the speech in two-talker masker condition. Each box represents the effect estimate of an individual study and its size is proportional to that study's weight on the pooled result. The horizontal lines through the boxes represent the 95% confidence interval. The diamond represents the pooled result from the random effect meta-analysis. RE Model = Random effect model, SMD = Standardized mean difference (Hedge's G), 95% CI = 95% confidence interval.
Fig. 5
Fig. 5
Effect sizes for the speech in four-talker masker condition. Each box represents the effect estimate of an individual study and its size is proportional to that study's weight on the pooled result. The horizontal lines through the boxes represent the 95% confidence interval. The diamond represents the pooled result from the random effect meta-analysis. RE Model = Random effect model, SMD = Standardized mean difference (Hedge's G), 95% CI = 95% confidence interval.
Fig. 6
Fig. 6
Effect sizes for the speech in spatially separated masker condition. Each box represents the effect estimate of an individual study and its size is proportional to that study's weight on the pooled result. The horizontal lines through the boxes represent the 95% confidence interval. The diamond represents the pooled result from the random effect meta-analysis. RE Model = Random effect model, SMD = Standardized mean difference (Hedge's G), 95% CI = 95% confidence interval.
Fig. 7
Fig. 7
Effect sizes for the speech in SNR <0 dB condition. Each box represents the effect estimate of an individual study and its size is proportional to that study's weight on the pooled result. The horizontal lines through the boxes represent the 95% confidence interval. The diamond represents the pooled result from the random effect meta-analysis. RE Model = Random effect model, SMD = Standardized mean difference (Hedge's G), 95% CI = 95% confidence interval.
Fig. 8
Fig. 8
Effect sizes for the speech in SNR = 0 dB condition. Each box represents the effect estimate of an individual study and its size is proportional to that study's weight on the pooled result. The horizontal lines through the boxes represent the 95% confidence interval. The diamond represents the pooled result from the random effect meta-analysis. RE Model = Random effect model, SMD = Standardized mean difference (Hedge's G), 95% CI = 95% confidence interval.
Fig. 9
Fig. 9
Effect sizes for the speech in SNR> 0 dB condition. Each box represents the effect estimate of an individual study and its size is proportional to that study's weight on the pooled result. The horizontal lines through the boxes represent the 95% confidence interval. The diamond represents the pooled result from the random effect meta-analysis. RE Model = Random effect model, SMD = Standardized mean difference (Hedge's G), 95% CI = 95% confidence interval.

References

    1. Alain C., Zendel B.R., Hutka S., Bidelman G.M. Turning down the noise: the benefit of musical training on the aging auditory brain. Hear. Res. 2014;308:162–173. doi: 10.1016/j.heares.2013.06.008. - DOI - PubMed
    1. Anaya E.M., Pisoni D.B., Kronenberger W.G. Long-term musical experience and auditory and visual perceptual abilities under adverse conditions. J Acoust Soc Am. 2016;140(3):2074. doi: 10.1121/1.4962628. - DOI - PMC - PubMed
    1. Anderson S., Parbery-Clark A., White-Schwoch T., Kraus N. Auditory brainstem response to complex sounds predicts self-reported speech-in-noise performance. J. Speech Lang. Hear. Res. 2013;56(1):31–43. doi: 10.1044/1092-4388(2012/12-0043. - DOI - PMC - PubMed
    1. Anderson S., White-Schwoch T., Parbery-Clark A., Kraus N. Reversal of age-related neural timing delays with training. Proc. Natl. Acad. Sci. U. S. A. 2013;110(11):4357–4362. doi: 10.1073/pnas.1213555110. - DOI - PMC - PubMed
    1. Arbogast T.L., Mason C.R., Kidd G., Jr. The effect of spatial separation on informational masking of speech in normal-hearing and hearing-impaired listeners. J. Acoust. Soc. Am. 2005;117(4 Pt 1):2169–2180. doi: 10.1121/1.1861598. - DOI - PubMed

LinkOut - more resources