. 2023 Jun 10:4:100092.
doi: 10.1016/j.crneur.2023.100092. eCollection 2023.

Motion distractors perturb saccade programming later in time than static distractors

Affiliations

Motion distractors perturb saccade programming later in time than static distractors

Devin H Kehoe et al. Curr Res Neurobiol. .

Abstract

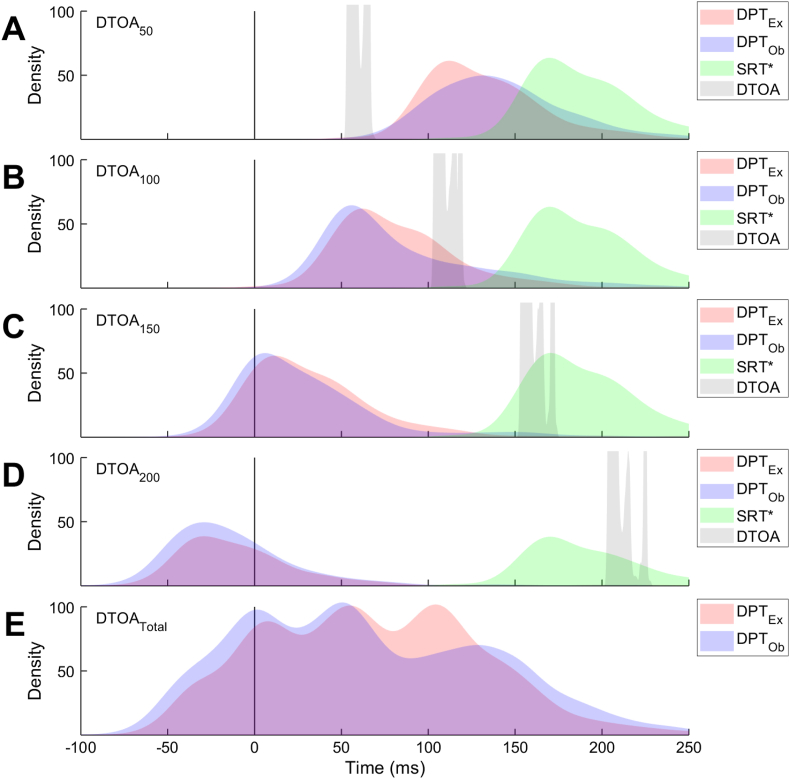
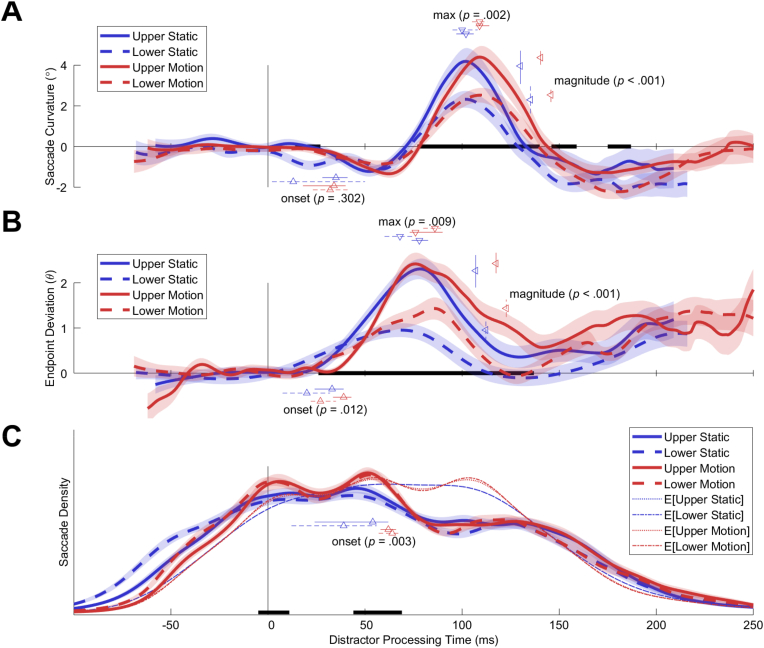
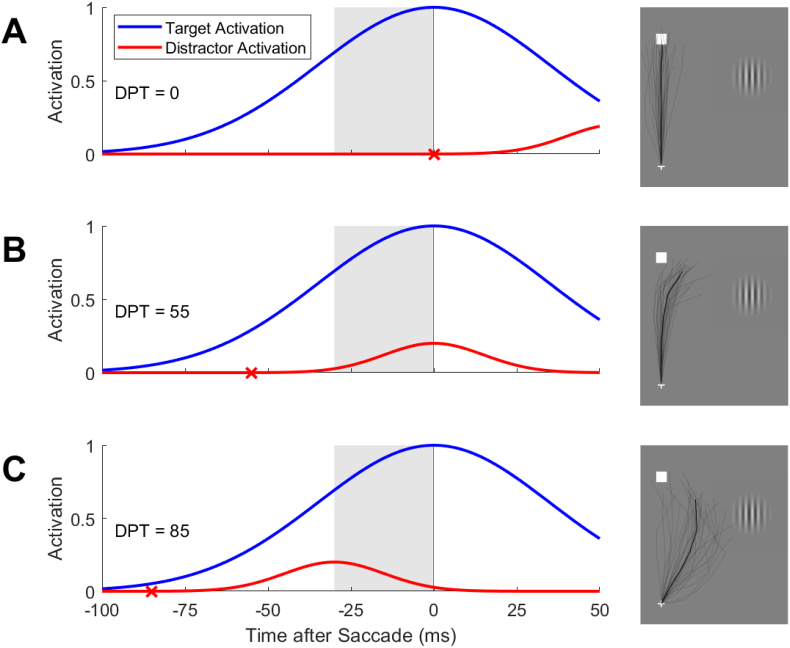
The mechanism that reweights oculomotor vectors based on visual features is unclear. However, the latency of oculomotor visual activations gives insight into their antecedent featural processing. We compared the oculomotor processing time course of grayscale, task-irrelevant static and motion distractors during target selection by continuously measuring a battery of human saccadic behavioral metrics as a function of time after distractor onset. The motion direction was towards or away from the target and the motion speed was fast or slow. We compared static and motion distractors and observed that both distractors elicited curved saccades and shifted endpoints at short latencies (∼25 ms). After 50 ms, saccade trajectory biasing elicited by motion distractors lagged static distractor trajectory biasing by 10 ms. There were no such latency differences between distractor motion directions or motion speeds. This pattern suggests that additional processing of motion stimuli occurred prior to the propagation of visual information into the oculomotor system. We examined the interaction of distractor processing time (DPT) with two additional factors: saccadic reaction time (SRT) and saccadic amplitude. Shorter SRTs were associated with shorter DPT latencies of biased saccade trajectories. Both SRT and saccadic amplitude were associated with the magnitude of saccade trajectory biases.

Keywords: Behavioral chronometry; Eye movements; Saccade averaging; Saccade curvature; Sensorimotor processing; Target selection.


Conflict of interest statement

The authors declare that they have no known competing financial interests or personal relationships that could have appeared to influence the work reported in this paper

Figures

Image 1
Graphical abstract
Fig. 1
Fig. 1
Trial temporal schematics. A: Stimuli sequence. After maintaining fixation for 200 ms, the target was presented for 500 ms or until a saccade to the target was detected. The distractor was displayed after a randomized interval, referred to as distractor-target onset asynchrony (DTOA). B: Trial epochs. Trials were parsed into 3 temporal intervals: saccadic reaction time (SRT), DTOA, and distractor processing time. The boundaries of these intervals were defined by 3 temporal events: target onset, distractor onset, and saccade onset. DTOA is an independent variable, while SRT and distractor processing time are dependent variables. Distractor processing time was derived by subtracting DTOA from SRT.
Fig. 2
Fig. 2
Expected vs. observed distractor processing time (DPT) distributions split by distractor-target onset asynchrony (DTOA). Expected DPT distributions are plotted in red. Observed DPT distributions are plotted in blue. Bootstrapped SRT distributions are plotted in green. Observed DTOA distributions are plotted in gray. A: DTOA = 50 ms. B: DTOA = 100 ms. C: DTOA = 150 ms. D: DTOA = 200 ms. E: Aggregate of all DTOAs. (For interpretation of the references to color in this figure legend, the reader is referred to the Web version of this article.)
Fig. 3
Fig. 3
Saccade metrics as a function of distractor processing time split by static (blue) and motion (red) distractor types. Mean saccade metrics are plotted with thick, colored lines. Standard error of the mean across subjects (n = 31) is indicated by shading. Black lines along the abscissa in each panel indicate epochs of significant (p < .05, sliding Friedman test) differences between saccade metrics. Arrowheads indicate the estimated onset latency of saccadic perturbation (▲), the estimated time of maximum saccadic perturbation (▼), and the magnitude of saccadic perturbation (◄). Arrowheads are color-coded to indicate distractor condition. Error bars intersecting the arrowheads indicate the bootstrapped 95% confidence interval of each point estimate. P values indicate significance (distribution test) of the difference between bootstrapped point estimates in each condition. A: Mean saccade curvature as a function of distractor processing time. B: Mean endpoint deviation as a function of distractor processing time. C: Mean saccade probability density as a function of distractor processing time. Dotted lines indicate expectation models. (For interpretation of the references to color in this figure legend, the reader is referred to the Web version of this article.)
Fig. 4
Fig. 4
Saccade metrics as a function of distractor processing time split by static (blue), motion towards the target (green), and motion away from the target (yellow) distractor types. Mean saccade metrics are plotted with thick, colored lines. Standard error of the mean across subjects (n = 31) is indicated by shading. Black lines along the abscissa in each panel indicate epochs of significant (p < .05, sliding Friedman test) differences between saccade metrics. Arrowheads indicate the estimated onset latency of saccadic perturbation (▲), the estimated time of maximum saccadic perturbation (▼), and the magnitude of saccadic perturbation (◄). Arrowheads are color-coded to indicate distractor condition. Error bars intersecting the arrowheads indicate the bootstrapped 95% confidence interval of each point estimate. P values indicate significance (distribution test) of the difference between bootstrapped point estimates in each condition. A: Mean saccade curvature as a function of distractor processing time. B: Mean endpoint deviation as a function of distractor processing time. C: Mean saccade probability density as a function of distractor processing time. Dotted lines indicate expectation models. (For interpretation of the references to color in this figure legend, the reader is referred to the Web version of this article.)
Fig. 5
Fig. 5
Saccade metrics as a function of distractor processing time split by static (blue), slow motion (magenta), and fast motion (orange) distractor types. Mean saccade metrics are plotted with thick, colored lines. Standard error of the mean across subjects (n = 31) is indicated by shading. Black lines along the abscissa in each panel indicate epochs of significant (p < .05, sliding Friedman test) differences between saccade metrics. Arrowheads indicate the estimated onset latency of saccadic perturbation (▲), the estimated time of maximum saccadic perturbation (▼), and the magnitude of saccadic perturbation (◄). Arrowheads are color-coded to indicate distractor condition. Error bars intersecting the arrowheads indicate the bootstrapped 95% confidence interval of each point estimate. P values indicate significance (distribution test) of the difference between bootstrapped point estimates in each condition. A: Mean saccade curvature as a function of distractor processing time. B: Mean endpoint deviation as a function of distractor processing time. C: Mean saccade probability density as a function of distractor processing time. Dotted lines indicate expectation models. (For interpretation of the references to color in this figure legend, the reader is referred to the Web version of this article.)
Fig. 6
Fig. 6
Saccade metrics as a function of distractor processing time split by distractor type (static, motion) × vertical visual hemifield (upper, lower). Static is plotted in blue. Motion is plotted in red. Upward saccades are plotted with solid lines. Downward saccades are plotted with broken lines. Mean saccade metrics are plotted with thick, colored lines. Standard error of the mean across subjects (n = 31) is indicated by shading. Black lines along the abscissa in each panel indicate epochs of significant (p < .05, sliding Friedman test) differences between saccade metrics. Arrowheads indicate the estimated onset latency of saccadic perturbation (▲), the estimated time of maximum saccadic perturbation (▼), and the magnitude of saccadic perturbation (◄). Arrowheads are color-coded to indicate distractor condition. Error bars intersecting the arrowheads indicate the bootstrapped 95% confidence interval of each point estimate. P values indicate significance (distribution test) of the difference between bootstrapped point estimates in each condition. A: Mean saccade curvature as a function of distractor processing time. B: Mean endpoint deviation as a function of distractor processing time. C: Mean saccade probability density as a function of distractor processing time. Dotted lines indicate expectation models for upwards saccades. Alternating dashed/dotted lines indicate expectation models for downward saccades. (For interpretation of the references to color in this figure legend, the reader is referred to the Web version of this article.)
Fig. 7
Fig. 7
Saccade metrics as a function of distractor processing time and saccadic reaction time (SRT) in the motion distractor condition. Left panels: Mean (across subjects, n = 31) saccade metrics as a function of distractor processing time and SRT plotted as a 3D manifold above a 2D heatmap with a colorbar to indicate scaling. Right subpanels: Distractor processing time parameter estimates as a function of SRT. Black dots indicate parameter estimates at each level of SRT across b = 1000 bootstrapped resamples. Thick black line indicates median of bootstrapped distributions as a function of SRT. Thin black lines indicate empirical 95% confidence intervals of bootstrapped distributions as a function of SRT. Dashed black line indicates mean linear model of parameter estimates as a function of SRT fit to each bootstrapped distribution. Text labels indicates parameter type and the mean slope (β) across linear models fit to each bootstrapped distribution. Asterisks indicates significance of a one-tailed distribution test between squared, unitized slope distribution and squared, unitized model residual distribution (*p < .05, **p < .01, ***p < .001). Thick red line indicates median of constant 1D distribution of parameter estimates in the motion distractor condition. Thin red lines indicate empirical 95% confidence interval of constant 1D distribution of parameter estimates in the motion distractor condition. Black rectangles along abscissa indicate the SRT intervals in which the distribution of parameter estimates as a function of SRT was significantly different than the constant 1D distribution of parameter estimates (p < .05; sliding distribution test). A: Mean saccade curvature as a function of distractor processing time and SRT. B: Saccade curvature onset parameter estimate as a function of SRT. C: Saccade curvature max parameter estimate as a function of SRT. D: Saccade curvature magnitude parameter estimate as a function of SRT. E: Mean endpoint deviation as a function of distractor processing time and SRT. F: Endpoint deviation onset parameter estimate as a function of SRT. G: Endpoint deviation max parameter estimate as a function of SRT. H: Endpoint deviation magnitude parameter estimate as a function of SRT. I: Mean saccade density as a function of distractor processing time and SRT. (For interpretation of the references to color in this figure legend, the reader is referred to the Web version of this article.)
Fig. 8
Fig. 8
Saccade metrics as a function of distractor processing time and saccade amplitude in the motion distractor condition. Left panels: Mean (across subjects, n = 31) saccade metrics as a function of distractor processing time and saccade amplitude plotted as a 3D manifold above a 2D heatmap with a colorbar to indicate scaling. Right subpanels: Distractor processing time parameter estimates as a function of saccade amplitude. Black dots indicate parameter estimates at each level of saccade amplitude across b = 1000 bootstrapped resamples. Thick black line indicates median of bootstrapped distributions as a function of saccade amplitude. Thin black lines indicate empirical 95% confidence intervals of bootstrapped distributions as a function of saccade amplitude. Dashed black line indicates mean linear model of parameter estimates as a function of saccade amplitude fit to each bootstrapped distribution. Text labels indicates parameter type and the mean slope (β) across linear models fit to each bootstrapped distribution. Asterisks indicates significance of a one-tailed distribution test between squared, unitized slope distribution and squared, unitized model residual distribution (*p < .05, **p < .01, ***p < .001). Thick red line indicates median of constant 1D distribution of parameter estimates in the motion distractor condition. Thin red lines indicate empirical 95% confidence interval of constant 1D distribution of parameter estimates in the motion distractor condition. Black rectangles along abscissa indicate the saccade amplitude intervals in which the distribution of parameter estimates as a function of saccade amplitude was significantly different than the constant 1D distribution of parameter estimates (p < .05; sliding distribution test). A: Mean saccade curvature as a function of distractor processing time and saccade amplitude. B: Saccade curvature onset parameter estimate as a function of saccade amplitude. C: Saccade curvature max parameter estimate as a function of saccade amplitude. D: Saccade curvature magnitude parameter estimate as a function of saccade amplitude. E: Mean endpoint deviation as a function of distractor processing time and saccade amplitude. F: Endpoint deviation onset parameter estimate as a function of saccade amplitude. G: Endpoint deviation max parameter estimate as a function of saccade amplitude. H: Endpoint deviation magnitude parameter estimate as a function of saccade amplitude. I: Mean saccade density as a function of distractor processing time and saccade amplitude. J: Saccade density onset parameter estimate as a function of saccade amplitude. (For interpretation of the references to color in this figure legend, the reader is referred to the Web version of this article.)
Fig. 9
Fig. 9
Theoretical and empirical saccadic vector-weighted averaging. Left panels: Hypothetical neural activation as a function of time before saccade initiation for oculomotor cells encoding the target (blue) or the distractor (red). Gray shaded region indicates the critical epoch between 30 and 0 ms prior to saccade initiation. Saccade trajectories are determined by the vector-weighted average of the target and distractor activation functions in the critical epoch. Red “x” indicates the distractor onset time. Text label indicates corresponding distractor processing time (DPT). Distractor activation functions had a 30 ms initial phase as reported elsewhere (McPeek and Keller, 2002) and a lead time of 25 ms after distractor onset as was observed in the current experiment. Right panels: Example displays with target (square), fixation (“+”), distractor (grating), and observed saccade trajectories (gray and black traces). Gray traces are average saccade trajectories for each subject at the respective distractor processing time (±5 ms) indicated by the text label in each row. Trajectories were angularly scaled by 10° for illustrative purposes (e.g., a saccade trajectory angled 45° towards the distractor was actually observed as only 4.5°). Black traces are the average saccade trajectories across subjects. A: Distractor onset occurs at the time of saccade initiation (distractor processing time = 0). The visual onset burst elicited by the distractor is well outside the critical epoch and no averaging should occur. This is consistent with observation as saccades were straight at this DPT. B: Distractor onset occurs 55 ms before saccade initiation (distractor processing time = 55). The visual onset burst is aligned with the upper portion of the critical epoch. Minimal averaging should occur in the early portion of the saccade, while maximum averaging should occur in the latter portion of the saccade. This is consistent with observation as, at this DPT, saccades were initially straight but then curved towards the distractor in the latter portion. C: Distractor onset occurs 85 ms before saccade initiation (distractor processing time = 85). The visual onset burst is aligned with the lower portion of the critical epoch. Maximum averaging should occur in the initial portion of the saccade, but minimal averaging should occur in the latter portion of the saccade. This is consistent with observation as, at this DPT, the saccade is initially directed in between the target and distractor, but angles back towards the target in the latter portion. (For interpretation of the references to color in this figure legend, the reader is referred to the Web version of this article.)

Similar articles

Cited by

References

    1. Aizawa H., Wurtz R.H. Reversible inactivation of monkey superior colliculus. I. Curvature of saccadic trajectory. J. Neurophysiol. 1998;79:2082–2096. - PubMed
    1. Albright T.D. Direction and orientation selectivity of neurons in visual area MT of the macaque. J. Neurophysiol. 1984;52:1106–1130. - PubMed
    1. Azzopardi P., Fallah M., Gross C.G., Rodman H.R. Response latencies of neurons in visual areas MT and MST of monkeys with striate cortex lesions. Neuropsychologia. 2003;41:1738–1756. - PubMed
    1. Basso M.A., Liu P. Context-dependent effects of substantia nigra stimulation on eye movements. J. Neurophysiol. 2007;97:4129–4142. - PubMed
    1. Basso M.A., Wurtz R.H. Modulation of neuronal activity by target uncertainty. Nature. 1997;389:66–69. - PubMed

LinkOut - more resources